Introduction:
Hammer candlestick pattern ek aham technical analysis ka tareeqa hai jo ke stock market mein istemal hota hai. Ye pattern market ke trend ko samajhne mein madadgar hota hai aur traders ko potential reversals ka pata lagane mein help karta hai. Hammer candlestick ek aisa graphical representation hai jo price action ko darust taur par interpret karne mein madad deta hai.
Structure of Hammer Candlestick Pattern:
Hammer candlestick pattern ek single candlestick pattern hai, jo ke market ke movement ko represent karta hai. Iski pehchan karne ke liye, traders ko candlestick ka structure aur uske characteristics ko samajhna zaroori hai. Hammer candlestick pattern ko dekhne mein asan hota hai, kyun ke iska shape ek hammer ki tarah hota hai. Ismein ek choti si body hoti hai, jo ke price range ko darust karti hai, aur iske neeche ek lamba tail hota hai, jo ke lower shadow ya wick kehlata hai.
Purpose of Hammer Candlestick Pattern:
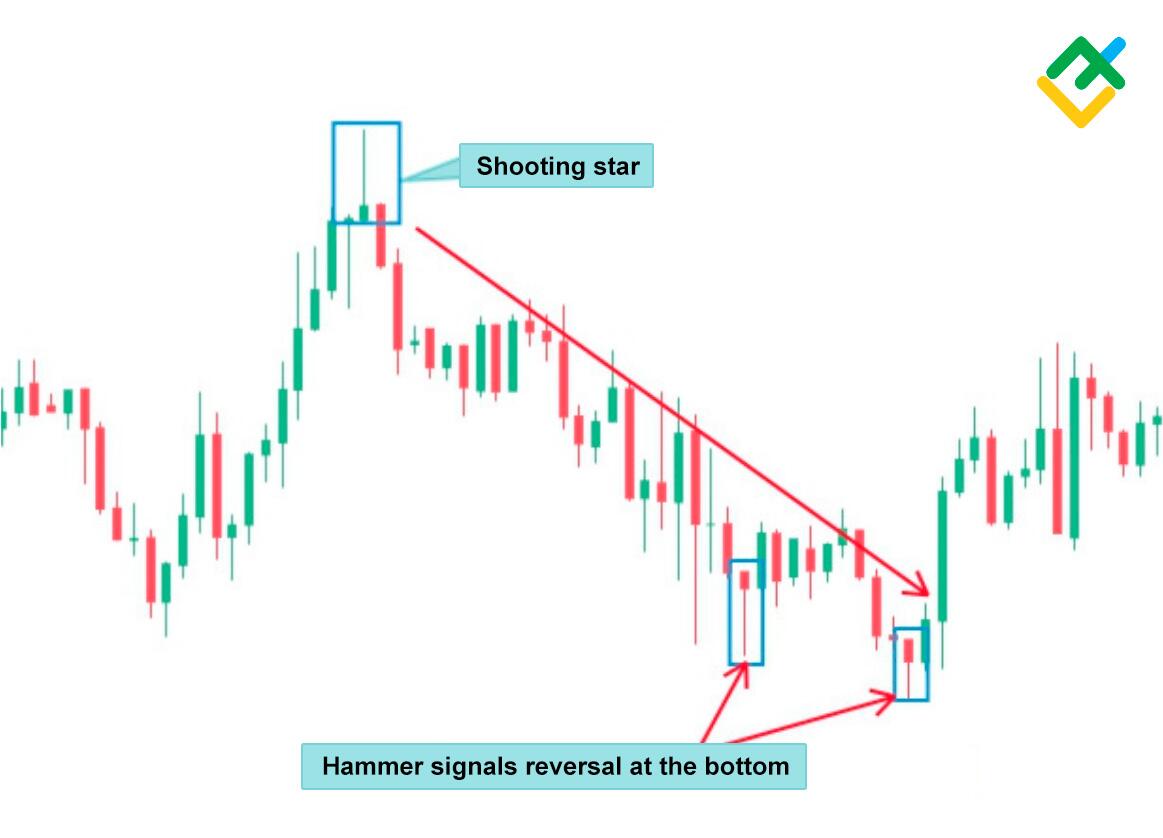
Hammer candlestick ka asal maqsad market mein potential reversal ko highlight karna hai. Agar hammer candlestick pattern downtrend ke baad aata hai, toh ye indicate karta hai ke sellers control mein hain lekin ab buyers wapas market mein dakhil ho rahe hain. Iska matlab hai ke market mein reversal hone ke chances hain aur bullish trend shuru ho sakta hai.
Characteristics of Hammer Candlestick Pattern:
Hammer candlestick pattern ke kuch important characteristics hain jo traders ko samajhne chahiye. Pehle toh, iski body choti hoti hai aur wick ya tail lambi hoti hai, jo ke kam se kam do guna body ke barabar hoti hai. Dusre, iski closing price open price ke qareeb hoti hai ya equal hoti hai, jo ke ek aur confirmation hai ke buyers ne control lena shuru kiya hai.
Utilizing Hammer Candlestick Pattern:
Hammer candlestick pattern ki pehchan karke traders apne trading decisions ko improve kar sakte hain. Agar ye pattern sahi tarah se confirm hota hai aur market mein confirmatory signals bhi hote hain, toh traders long positions le sakte hain, expecting a bullish reversal. Lekin hamesha yaad rahe ke ek single candlestick pattern par pura bharosa na karein, aur dusre technical indicators aur analysis tools ka bhi istemal karein.
Risk Management and Prudent Decisions:
Hammer candlestick pattern ke istemal mein ek aur bat yaad rakhni chahiye ke ye sirf ek tool hai, aur market mein hamesha risk hota hai. Market conditions badal sakti hain aur isliye prudent risk management ka bhi khayal rakhna zaroori hai.
Conclusion:
Is tareeqe se, hammer candlestick pattern ek useful aur effective tool hai jo traders ko market ke potential reversals ka pata lagane mein madad karta hai. Lekin, hamesha apni research aur analysis ko mazbooti se karein aur multiple indicators ka istemal karke apne trading decisions ko validate karein.
تبصرہ
Расширенный режим Обычный режим