3 Candle sticks Chart Patterns
X
  • وقت
  • دکھائیں
Clear All
new posts
  • #1 Collapse

    3 Candle sticks Chart Patterns
    Hello,
    Dosto kaise hain aap aap ke kharyat ke umeed ke sath aaj ke apne topic ka aghaz karte hain is main hum un candle sticks patterns ke bare main discuss karage jo aik se ziada khas tor par three candle sticks patterns par mustamil hote hain ayye jante hain


    Three Candle Sticks Patterns
    Forex chart main banne wala chart patterns jo ke 3 candle sticks se mil kar banta hay woh kon kon se hain, unmein se kuchh neche darj hain aur in ke tafsel bhe darj ke gai hain

    1. Morning star
    2. Evening star
    3. Bullish abandoned baby
    4. Bearish abandoned baby
    5. Three white soldiers
    6. Three black crows
    7. Bullish three line strike
    8. Bearish three line strike
    9. Three inside up
    10. Three inside down

    In chart patterns ka use market trend ko predict karne ke liye kiya jata hay.


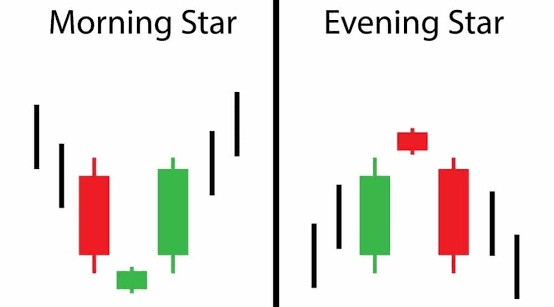
    Morning And Evening Star Candlesticks
    Click image for larger version

Name:	images - 2024-01-27T093410.419_1.png
Views:	57
Size:	20.8 کلوبائٹ
ID:	12815671
    Morning star pattern ek bullish reversal pattern hay. Yah pattern ek bearish candle se shuru hota hay, jiski baad ek doji candle aati hay, aur phir ek bullish candle aati hay. Morning star pattern ka matlab hay ke bearish trend bearish trend mein badal raha hay.
    Evening star pattern ek bearish reversal pattern hay. Yah pattern ek bullish candle se shuru hota hay, jiski baad ek doji candle aati hay, aur phir ek bearish candle aati hay. Evening star pattern ka matlab hay ke bullish trend bearish trend mein badal raha hay.


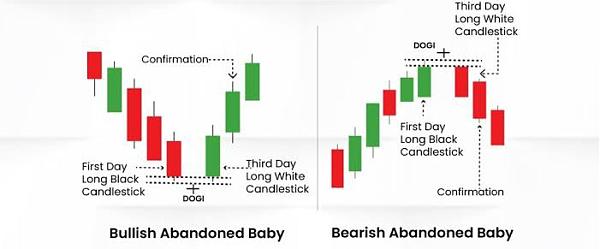
    Bullish And Bearish Abandoned Baby
    Click image for larger version

Name:	images - 2024-01-27T093230.199_1.jpeg
Views:	29
Size:	39.4 کلوبائٹ
ID:	12815672
    Bullish abandoned baby pattern ek bullish reversal pattern hay. Yah pattern ek bearish candle se shuru hota hay, jiski baad ek bullish candle aati hay, aur phir ek doji candle aati hay. Bullish abandoned baby pattern ka matlab hay ke bearish trend bullish trend mein badal raha hay.
    Bearish abandoned baby pattern ek bearish reversal pattern hay. Yah pattern ek bullish candle se shuru hota hay, jiski baad ek bearish candle aati hay, aur phir ek doji candle aati hay. Bearish abandoned baby pattern ka matlab hay ke bullish trend bearish trend mein badal raha hay.


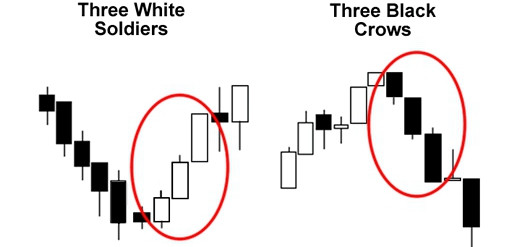
    Three White Soldier And Black Crow Patterns
    Click image for larger version

Name:	images - 2024-01-27T093146.953_1.png
Views:	32
Size:	24.3 کلوبائٹ
ID:	12815673
    Three white soldiers pattern ek bullish continuation pattern hay. Yah pattern teen bullish candles ka combination hay. Three white soldiers pattern ka matlab hay ke bullish trend chalta rahega.
    Three black crows pattern ek bearish continuation pattern hay. Yah pattern teen bearish candles ka combination hay. Three black crows pattern ka matlab hay ke bearish trend chalta rahega.


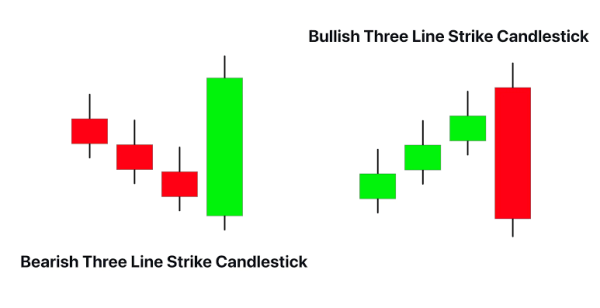
    Bulish And Bearish ThreeLine Strike
    Click image for larger version

Name:	images - 2024-01-27T093043.292.png
Views:	29
Size:	9.4 کلوبائٹ
ID:	12815674
    Bullish three line strike pattern ek bullish reversal pattern hay. Yah pattern teen bullish candles ka combination hay. Bullish three line strike pattern ka matlab hay ke bearish trend bullish trend mein badal raha hay.
    Bearish three line strike pattern ek bearish reversal pattern hay. Yah pattern teen bearish candles ka combination hay. Bearish three line strike pattern ka matlab hay ke bullish trend bearish trend mein badal raha hay.


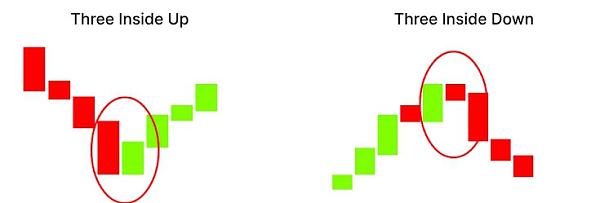
    Three Inside Up And Down Side Pattern
    Click image for larger version

Name:	images - 2024-01-27T093757.957_1.png
Views:	32
Size:	24.9 کلوبائٹ
ID:	12815675
    Three inside up pattern ek bullish continuation pattern hay. Yah pattern teen candles ka combination hay, jinmein se do bullish candles hain aur ek bearish candle hay. Three inside up pattern ka matlab hay ke bullish trend chalta rahega.
    Three inside down pattern ek bearish continuation pattern hay. Yah pattern teen candles ka combination hay, jinmein se do bearish candles hain aur ek bullish candle hay. Three inside down pattern ka matlab hay ke bearish trend chalta rahega.

    In chart patterns ko identify karne ke liye, aapko candlestick chart ka use karna hoga. Candlestick chart mein, har candle market ki ek price movement ko represent karti hay. Candlesticks ki length price movement ki size ko represent karti hay, aur candles ka color price movement ki direction ko represent karti hay.

    Use karne se pehle apne risk management strategy ko develop karna chahiye.

    Thank you for your attention
  • <a href="https://www.instaforex.org/ru/?x=ruforum">InstaForex</a>
  • #2 Collapse


    3 Candlestick Chart Patterns:

    Candlestick chart patterns trading mein istemal hoti hain aur ye patterns market ke movements ko samajhne mein madad karte hain. Yahan kuch aise 3 candlestick chart patterns hain jo traders ke liye ahem ho sakte hain:
    1. Three White Soldiers:
    Click image for larger version

Name:	grade2-morning-evening-star.png
Views:	39
Size:	8.7 کلوبائٹ
ID:	12815719
    Pattern Ki Pehchan:
    • Ye pattern uptrend ke doran ata hai.
    • Pehla candle ek upward movement ko represent karta hai.
    • Doosra aur teesra candle bhi strong upward movement dikhata hai.
    • In teeno candles ki closing prices pehle ke candle se ziada hoti hain.

    Tijarat Mein Istemal:
    • Three White Soldiers pattern uptrend ko confirm karta hai.
    • Traders is pattern ko dekhte hue long positions le sakte hain.
    • Confirmatory indicators ka istemal karna important hai.
    1. Three Black Crows:

    Pattern Ki Pehchan:
    • Ye pattern downtrend ke doran dikhai deta hai.
    • Pehla candle ek downward movement ko represent karta hai.
    • Doosra aur teesra candle bhi strong downward movement dikhata hai.
    • In teeno candles ki closing prices pehle ke candle se ziada neeche hoti hain.

    Tijarat Mein Istemal:
    • Three Black Crows pattern downtrend ko confirm karta hai.
    • Traders is pattern ko dekhte hue short positions le sakte hain.
    • Confirmatory indicators ka istemal karna important hai.
    1. Evening Star:

    Pattern Ki Pehchan:
    • Ye pattern uptrend ke baad aata hai aur reversal ko indicate karta hai.
    • Pehla candle ek strong upward movement ko represent karta hai.
    • Doosra candle small body ka hota hai aur ideally pehle ke upar close hota hai.
    • Teesra candle ek downward movement ko represent karta hai aur iski closing price doosre candle ke neeche hoti hai.

    Tijarat Mein Istemal:
    • Evening Star pattern bearish reversal ko indicate karta hai.
    • Traders is pattern ko dekhte hue apne long positions ko review kar sakte hain aur naye short positions le sakte hain.
    • Confirmatory indicators ka istemal karna important hai.

    In teeno candlestick chart patterns ka istemal traders ko market trends aur reversals ko samajhne mein madad karta hai. Hamesha yaad rahe ke patterns ko confirm karne ke liye doosre technical indicators ka bhi istemal karna zaroori hai aur risk management ka khayal rakhna chahiye.

    • #3 Collapse


      3 Candlestick Chart Patterns:
      1. Three White Soldiers (Teen Sufaid Sipahi):
      Click image for larger version

Name:	1 NRDyeA5b_zWD_5Fv7wsURQ.png
Views:	27
Size:	59.6 کلوبائٹ
ID:	12815733
      Pehchan:
      • Ye pattern uptrend ke doran ata hai.
      • Pehla candle ek upward movement ko represent karta hai.
      • Doosra aur teesra candle bhi strong upward movement dikhata hai.
      • In teeno candles ki closing prices pehle ke candle se ziada hoti hain.

      Tijarat Mein Istemal:
      • Three White Soldiers pattern uptrend ko confirm karta hai.
      • Traders is pattern ko dekhte hue long positions le sakte hain.
      • Confirmatory indicators ka istemal karna important hai.
      1. Three Black Crows (Teen Kaley Kauwon):

      Pehchan:
      • Ye pattern downtrend ke doran dikhai deta hai.
      • Pehla candle ek downward movement ko represent karta hai.
      • Doosra aur teesra candle bhi strong downward movement dikhata hai.
      • In teeno candles ki closing prices pehle ke candle se ziada neeche hoti hain.

      Tijarat Mein Istemal:
      • Three Black Crows pattern downtrend ko confirm karta hai.
      • Traders is pattern ko dekhte hue short positions le sakte hain.
      • Confirmatory indicators ka istemal karna important hai.
      1. Evening Star (Shaam Ki Sitara):

      Pehchan:
      • Ye pattern uptrend ke baad aata hai aur reversal ko indicate karta hai.
      • Pehla candle ek strong upward movement ko represent karta hai.
      • Doosra candle small body ka hota hai aur ideally pehle ke upar close hota hai.
      • Teesra candle ek downward movement ko represent karta hai aur iski closing price doosre candle ke neeche hoti hai.

      Tijarat Mein Istemal:
      • Evening Star pattern bearish reversal ko indicate karta hai.
      • Traders is pattern ko dekhte hue apne long positions ko review kar sakte hain aur naye short positions le sakte hain.
      • Confirmatory indicators ka istemal karna important hai.

      In teeno candlestick chart patterns ka istemal traders ko market trends aur reversals ko samajhne mein madad karta hai. Hamesha yaad rahe ke patterns ko confirm karne ke liye doosre technical indicators ka bhi istemal karna zaroori hai aur risk management ka khayal rakhna chahiye.

      • #4 Collapse


        3 Candlesticks Chart Patterns:

        Candlestick patterns market analysis mein istemal hoti hain taki traders ko potential price movements ka andaza ho sake. Yahan kuch aise 3 candlesticks chart patterns hain jo traders ke liye ahem ho sakte hain:Click image for larger version

Name:	Capture.PNG
Views:	29
Size:	76.9 کلوبائٹ
ID:	12815774
        1. Morning Star:
          • Pehla Candle (Bearish): Morning Star pattern ka shuru hota hai jab market downtrend mein hota hai. Pehla candle ek bearish (downward) candle hota hai, jo ke existing trend ko darust karta hai.
          • Doosra Candle (Doji or Small): Doosra candle chhota hota hai aur iski opening aur closing price aapas mein kareeb hoti hain, isse Doji kehte hain. Ye indicate karta hai ke market indecision mein hai.
          • Teesra Candle (Bullish): Teesra candle ek strong bullish (upward) candle hota hai, jo ke uptrend ko darust karta hai. Iska opening price doosre candle ke closing price se upar hota hai.
        2. Evening Star:
          • Pehla Candle (Bullish): Evening Star pattern downtrend ke baad aata hai. Pehla candle ek strong bullish candle hota hai, jo existing trend ko darust karta hai.
          • Doosra Candle (Doji or Small): Doosra candle chhota hota hai aur iski opening aur closing price aapas mein kareeb hoti hain. Ye indecision ko darust karta hai.
          • Teesra Candle (Bearish): Teesra candle ek bearish candle hota hai, jiska opening price doosre candle ke closing price se neeche hota hai, isse downtrend ko confirm kiya jata hai.
        3. Three White Soldiers:
          • Pehla Candle (Bullish): Three White Soldiers pattern ek bullish reversal pattern hai. Pehla candle ek strong bullish candle hota hai, jo ke existing trend ko darust karta hai.
          • Doosra Candle (Bullish): Doosra candle bhi bullish hota hai aur iski opening price pehle candle ke closing price ke kareeb hoti hai.
          • Teesra Candle (Bullish): Teesra candle bhi bullish hota hai, iski opening price doosre candle ke closing price ke kareeb hoti hai. Ye pattern uptrend ko confirm karta hai.

        Yeh patterns traders ko market ke potential reversals ki taraf ishara karti hain, lekin hamesha yaad rahe ke kisi bhi strategy ka istemal karte waqt confirmatory indicators ka bhi khayal rakhein.

        • #5 Collapse

          Assalam.o.alaikum dear friend apki bat bilkul thek hay agar ham hikkake candlestick ko agar ham mamoli smjhy gay tu hamy bhaut hi nuqsan hoga q kay ye candle bhaut hi hard hoty hay is ko week smjhna sa hamy nuqsan ho sakta hay or chart patterns ka use market trend ko predict karne ke liye kiya jata ha

          Morning And Evening Star Candlesticks
          Click image for larger version  Name:	images - 2024-01-27T093410.419_1.png Views:	6 Size:	20.8 KB ID:	12815671 pattern ek bullish reversal pattern hay. Yah pattern ek bearish candle se shuru hota hay, jiski baad ek doji candle aati hay, aur phir ek bullish candle aati hay. Morning star pattern ka matlab hay ke bearish trend bearish trend mein badal raha hay.pattern ek bearish reversal pattern hay. Yah pattern ek bullish candle se shuru hota hay, jiski baad ek doji candle aati hay, aur phir ek bearish candle aati hay. Evening star pattern ka matlab hay ke bullish trend bearish trend mein badal raha hay. hay hamy treading market me ik achi hasiyat rhak kar hamy market ko smjhna cahaiye agar ham mhenat or ik acha work karna chaty hay to hamy is pattren ki zarorat hoti hay q kay is say hi ham ik achi treading kar sakty hay agar ham patren ko nhi smjhty tu hamy lose ho sakta hay Agar Ham market mein agar iski range Dekh Kar trading Karte Hain To Ham ismein bahut acchi trading kar Sakenge Agar Ham range ke mutabik ismein trading Karke Agar pattern aur knowledge aur experience ke Taur per Ham ismein work Karte Hain To Ham ummid Karte Hain Ki ismein acchi trading kar Sakenge Kyunki market ki range Dekh Kar trading Karni chahie Agar Ham range Dekh Kar trading Nahin Karenge To Ham ismein Achcha work nahin kar Sakenge Kyunki training Mein range ki bahut hi jarurat hoti hai Kyunki range ke mutabik Ham ismein trading kar sakte hain
          Ye pattern uptrend ke baad aata hai aur reversal ko indicate karta hai.
          Pehla candle ek strong upward movement ko represent karta hai.
          Doosra candle small body ka hota hai aur ideally pehle ke upar close hota hai.
          Teesra candle ek downward movement ko represent karta hai aur iski closing price doosre candle ke neechy say use karna chaiye candles ka combination hay. Bearish three line strike pattern ka matlab hay ke bullish trend bearish trend mein badal raha hay.
          Up And Down Side Pattern
          Click image for larger version  Name:	images - 2024-01-27T093757.957_1.png Views:	6 Size:	24.9 KB ID:	12815675
          pattern ek bullish continuation pattern hay. Yah pattern teen candles ka combination hay, jinmein se do bullish candles hain aur ek bearish candle hay. Three inside up pattern ka matlab hay ke bullish trend chalta rahega.
          pattern ek bearish continuation pattern hay. Yah pattern teen candles ka combination hay, jinmein se do bearish candles hain aur ek bullish candle hay. Three inside down pattern ka matlab hay ke bearish trend chalta rahega.
          Like tu banta hay ik🙏
          • #6 Collapse


            3 Candlesticks Chart Patterns:

            **1. Morning Star Candlestick Pattern (Subah Ki Sitara Candlestick Pattern):
            • Tafsili Bayan:
              • Morning Star ek bullish reversal pattern hai jo market mein trend change ko indicate karta hai.
              • Ye pattern downtrend ke baad aata hai.
            • Tareeqa-e-Istemal:
              • Pehla candle ek bearish (downward) candle hota hai.
              • Doosra candle small aur indecisive hota hai, jo ke market mein uncertainty ko darust karta hai.
              • Teisra candle ek strong bullish (upward) candle hota hai, jo ke bullish reversal ko confirm karta hai.
            Click image for larger version

Name:	Capture.PNG
Views:	24
Size:	95.8 کلوبائٹ
ID:	12815830
            **2. Evening Star Candlestick Pattern (Shaam Ki Sitara Candlestick Pattern):
            • Tafsili Bayan:
              • Evening Star ek bearish reversal pattern hai jo market mein trend change ko indicate karta hai.
              • Ye pattern uptrend ke baad aata hai.
            • Tareeqa-e-Istemal:
              • Pehla candle ek strong bullish (upward) candle hota hai.
              • Doosra candle chhota hota hai aur indecisive hota hai.
              • Teisra candle ek strong bearish (downward) candle hota hai, jo ke bearish reversal ko confirm karta hai.

            **3. Three White Soldiers Candlestick Pattern (Teen Safed Sipahi Candlestick Pattern):
            • Tafsili Bayan:
              • Three White Soldiers ek bullish reversal pattern hai jo market mein trend change ko darust karta hai.
              • Ye pattern downtrend ke baad aata hai.
            • Tareeqa-e-Istemal:
              • Teen consecutive (musalsal) white (upward) candles hote hain.
              • Har candle pehle se ziada close hoti hai aur overall trend ko confirm karti hai.

            Trading Mein Istemal:
            • Ye patterns market trends ko anticipate karne aur trend reversal points ko identify karne mein madadgar hote hain.
            • Confirmatory indicators ka istemal karna bhi ahem hai taki false signals se bacha ja sake.

            Hifazati Tadabeer:
            • Market conditions aur overall trend ko madde nazar rakhein.
            • Confirmatory indicators aur doosre technical tools ka istemal karein.
            • Risk management ka khayal rakhna zaroori hai. Stop-loss orders ka istemal karke apne positions ko control mein rakhein.

            In teen candlestick patterns ka istemal traders ko market movements ko samajhne aur trend reversal points ko identify karne mein madad karta hai. Lekin, hamesha confirmatory factors aur risk management ka khayal rakhna zaroori hai.

            • <a href="https://www.instaforex.org/ru/?x=ruforum">InstaForex</a>
            • #7 Collapse


              Teen Candlesticks Chart Patterns:

              **1. Morning Star:
              • Morning Star ek bullish reversal pattern hai jo market mein trend change ko indicate karta hai. Is pattern mein teen consecutive candles hote hain.
              • Pehla Candle (Bearish): Pehla candle ek downtrend ko represent karta hai.
              • Dusra Candle (Small Body): Dusra candle chhota hota hai aur indecision ya market consolidation ko darust karta hai.
              • Teisra Candle (Bullish): Teisra candle strong bullish candle hota hai, jo uptrend ki shuruaat ko confirm karta hai.
              Click image for larger version

Name:	Capture.PNG
Views:	31
Size:	105.1 کلوبائٹ
ID:	12815879
              **2. Evening Star:
              • Evening Star ek bearish reversal pattern hai jo market mein trend change ko darust karta hai. Is pattern mein teen consecutive candles hote hain.
              • Pehla Candle (Bullish): Pehla candle ek uptrend ko represent karta hai.
              • Dusra Candle (Small Body): Dusra candle chhota hota hai aur indecision ya market consolidation ko darust karta hai.
              • Teisra Candle (Bearish): Teisra candle strong bearish candle hota hai, jo downtrend ki shuruaat ko confirm karta hai.

              **3. Three White Soldiers:
              • Three White Soldiers ek bullish reversal pattern hai jo market mein trend change ko darust karta hai. Is pattern mein teen consecutive strong bullish candles hote hain.
              • Har candle pehle se ziada high aur low ke saath open hoti hai.
              • Ye pattern uptrend ke baad aakar dikhaayi deta hai aur bullish momentum ko indicate karta hai.

              Trading Mein Istemal:
              • In teeno patterns ko samajh kar, traders market mein upcoming trend reversal ko anticipate kar sakte hain aur apne trading decisions ko iske mutabiq adjust kar sakte hain.
              • Confirmatory indicators ka bhi istemal karna important hai taki false signals se bacha ja sake.

              Teen Candlesticks Chart Patterns, market trends ko identify karne mein madad karte hain aur traders ko potential trend reversals ko recognize karne mein madad karte hain.

              اب آن لائن

              Working...
              X