Hello friends
What is Red candlestick patterns
Red candlestick patterns forex aur stock market mein use hone wale technical analysis ke hisse hain. Ye patterns market ki price movements ko represent karte hain, specifically jab stock ya currency price down ja rahi hoti hai. Chaliye is concept ko detail mein samajhne ki koshish karte hain.
Low price
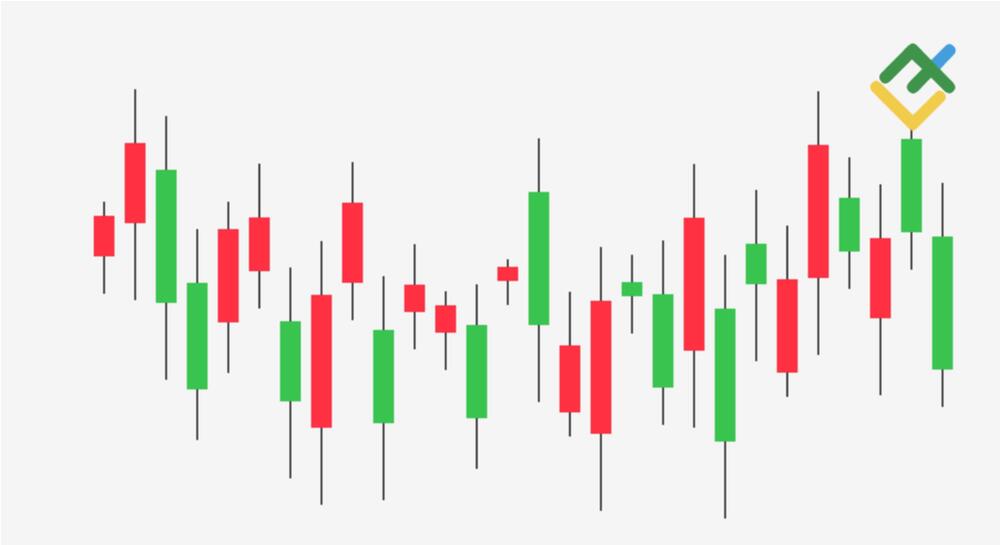
Red candlestick patterns, market charts par visual representation ke taur par aate hain. Har candlestick chart par har ek din (ya kisi aur timeframe par) ki opening, closing, high, aur low prices ko darust taur par darust taur par depict karta hai. Ek red candlestick pattern ka zahiri taur par rang red hota hai, jo ke indicate karta hai ke market mein selling pressure hai aur price down ja rahi hai.
Basic structure
Red candlestick patterns ka basic structure hota hai: ek rectangle jise hum body kehte hain, aur usse upar aur niche nikli lines jise hum shadows ya wicks kehte hain. Agar red candlestick ka opening price closing price se ziada hota hai, toh rectangle (body) red hota hai, aur iski upper side pe ek line hoti hai jo opening ko represent karti hai, aur lower side pe ek line hoti hai jo closing ko represent karti hai.
Bearish trend
Yeh candlestick patterns market sentiment ko darust taur par samajhne mein madad karte hain. Agar red candlestick patterns bar-bar aane lagte hain, toh yeh indicate karta hai ke market bearish trend mein hai, yaani ke prices down ja rahe hain.
Hanging man
Red candlestick patterns ki kuch common variations hain, jaise ke Marubozu, Hanging Man, Shooting Star, Bearish Engulfing, aur Doji. Har variation apni khasiyat aur market conditions ke hisaab se istemal hota hai.
Bearish engulfing
Marubozu ek strong bearish signal deta hai jabke Hanging Man aur Shooting Star reversals ko indicate kar sakte hain, yani ke trend change hone wala hai. Bearish Engulfing ek pattern hai jisme ek chota green candlestick ko ek bara red candlestick engulf karta hai, isay bearish reversal ke liye indicator samjha jata hai. Doji ek aisa pattern hai jisme opening aur closing price ek doosre ke bohat kareeb hoti hain, aur yeh indecision ko darust karte hain.
Potential reversal
Red candlestick patterns ka istemal market trends aur potential reversals ko identify karne mein hota hai. Investors in patterns ki madad se samajhne ki koshish karte hain ke ab market mein selling pressure hai aur prices down ja rahe hain, taki woh apne investment decisions ko uske mutabiq adjust kar sakein.In conclusion, red candlestick patterns ek important tool hain jo market analysis mein istemal hota hai. In patterns ko samajhne ke liye, investors ko market charts aur unke variations ko dhyan se dekhna chahiye. Red candlestick patterns ka istemal trend identification aur reversal points ko identify karne mein hota hai, lekin yaad rahe ke kisi single indicator par pura bharosa na karein aur market dynamics ko samajhne ke liye multiple tools ka istemal karein.
What is Red candlestick patterns
Red candlestick patterns forex aur stock market mein use hone wale technical analysis ke hisse hain. Ye patterns market ki price movements ko represent karte hain, specifically jab stock ya currency price down ja rahi hoti hai. Chaliye is concept ko detail mein samajhne ki koshish karte hain.
Low price
Red candlestick patterns, market charts par visual representation ke taur par aate hain. Har candlestick chart par har ek din (ya kisi aur timeframe par) ki opening, closing, high, aur low prices ko darust taur par darust taur par depict karta hai. Ek red candlestick pattern ka zahiri taur par rang red hota hai, jo ke indicate karta hai ke market mein selling pressure hai aur price down ja rahi hai.
Basic structure
Red candlestick patterns ka basic structure hota hai: ek rectangle jise hum body kehte hain, aur usse upar aur niche nikli lines jise hum shadows ya wicks kehte hain. Agar red candlestick ka opening price closing price se ziada hota hai, toh rectangle (body) red hota hai, aur iski upper side pe ek line hoti hai jo opening ko represent karti hai, aur lower side pe ek line hoti hai jo closing ko represent karti hai.
Bearish trend
Yeh candlestick patterns market sentiment ko darust taur par samajhne mein madad karte hain. Agar red candlestick patterns bar-bar aane lagte hain, toh yeh indicate karta hai ke market bearish trend mein hai, yaani ke prices down ja rahe hain.
Hanging man
Red candlestick patterns ki kuch common variations hain, jaise ke Marubozu, Hanging Man, Shooting Star, Bearish Engulfing, aur Doji. Har variation apni khasiyat aur market conditions ke hisaab se istemal hota hai.
Bearish engulfing
Marubozu ek strong bearish signal deta hai jabke Hanging Man aur Shooting Star reversals ko indicate kar sakte hain, yani ke trend change hone wala hai. Bearish Engulfing ek pattern hai jisme ek chota green candlestick ko ek bara red candlestick engulf karta hai, isay bearish reversal ke liye indicator samjha jata hai. Doji ek aisa pattern hai jisme opening aur closing price ek doosre ke bohat kareeb hoti hain, aur yeh indecision ko darust karte hain.
Potential reversal
Red candlestick patterns ka istemal market trends aur potential reversals ko identify karne mein hota hai. Investors in patterns ki madad se samajhne ki koshish karte hain ke ab market mein selling pressure hai aur prices down ja rahe hain, taki woh apne investment decisions ko uske mutabiq adjust kar sakein.In conclusion, red candlestick patterns ek important tool hain jo market analysis mein istemal hota hai. In patterns ko samajhne ke liye, investors ko market charts aur unke variations ko dhyan se dekhna chahiye. Red candlestick patterns ka istemal trend identification aur reversal points ko identify karne mein hota hai, lekin yaad rahe ke kisi single indicator par pura bharosa na karein aur market dynamics ko samajhne ke liye multiple tools ka istemal karein.

تبصرہ
Расширенный режим Обычный режим