What is Cup and handle
No announcement yet.
X
  • وقت
  • دکھائیں
Clear All
new posts
  • #1 Collapse

    What is Cup and handle
    Cup and Handle

    "Cup and Handle Candlestick Pattern" forex trading mein aik technical analysis concept hai jo traders ko potential trend reversal ya continuation ke signals dene mein madad karta hai. Is pattern ka naam uske shape se aya hai, jise aik "cup" aur uske baad aane wale chhote pattern ko "handle" kehte hain.
    Formation:
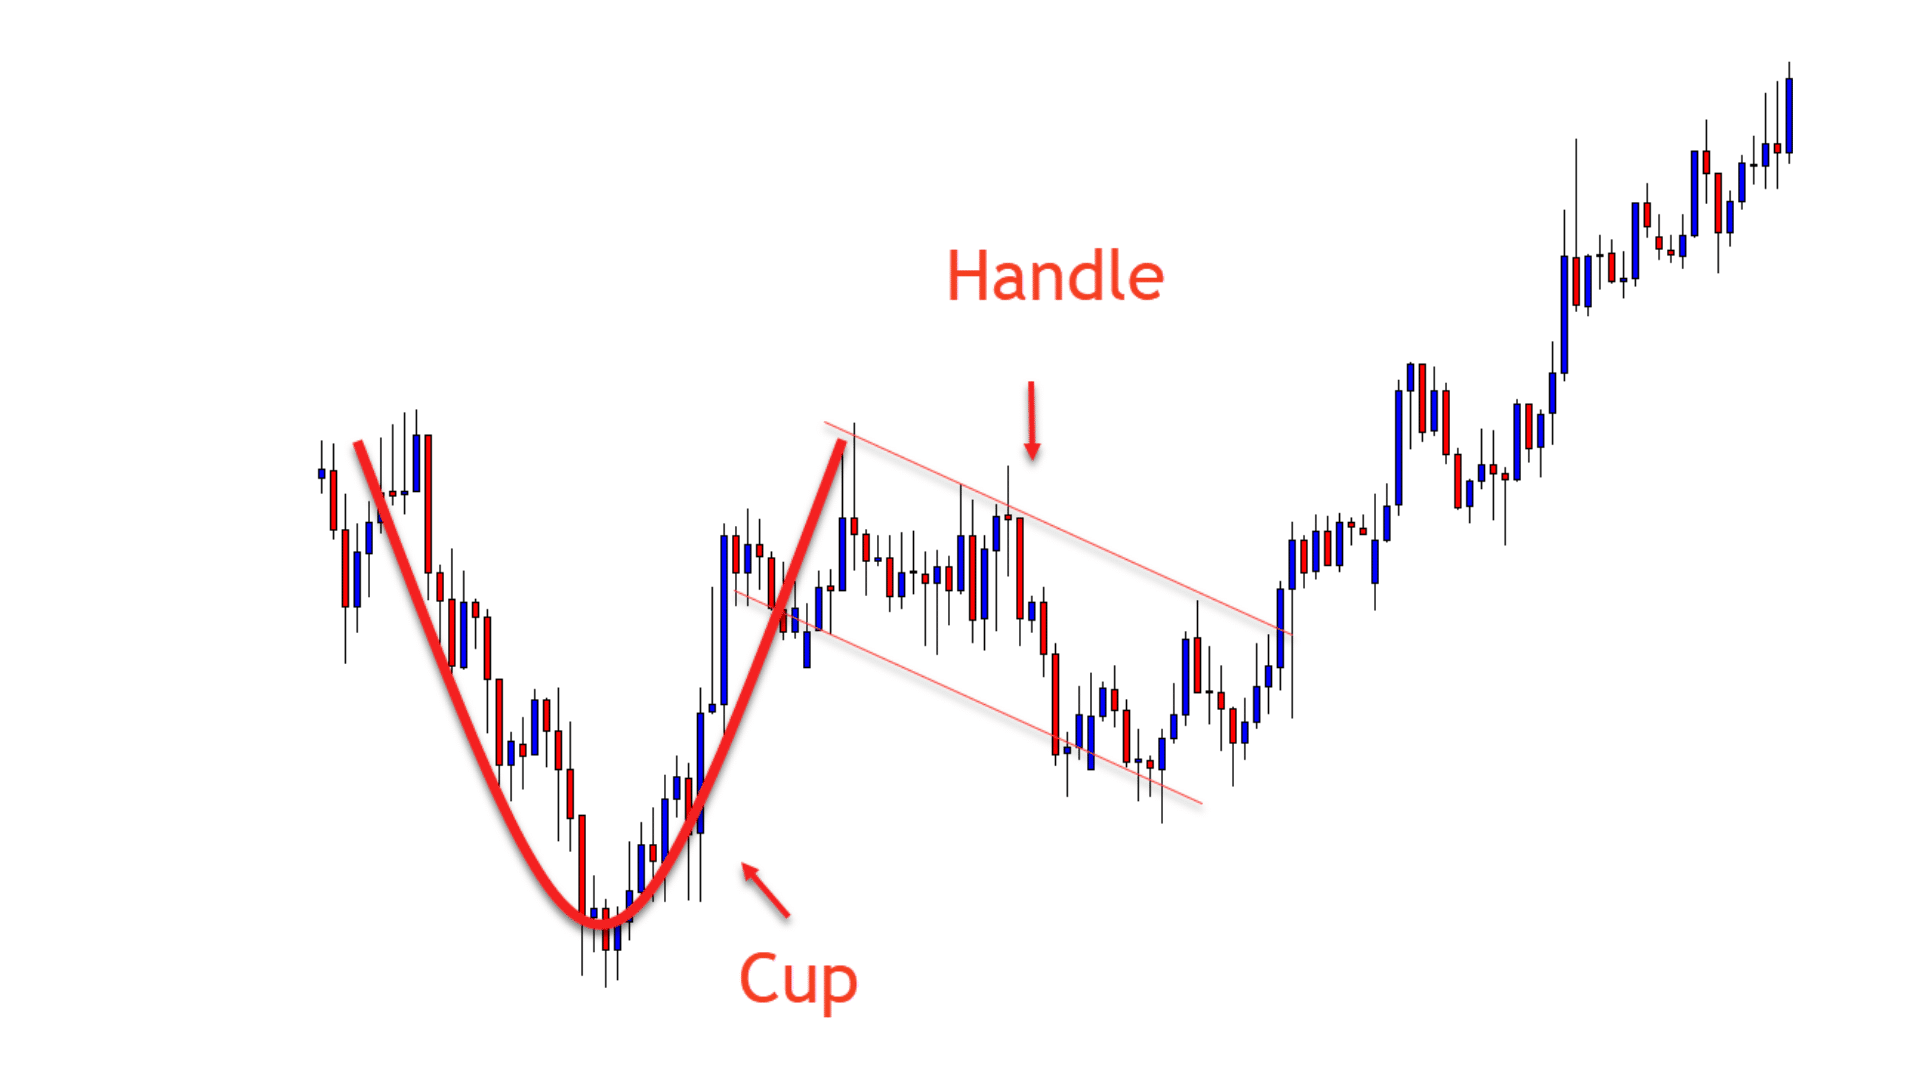
    Cup and Handle pattern ka formation do phases mein hota hai. Pehli phase mein, price mein aik gradual downtrend hoti hai, jise hum "cup" kehte hain. Is downtrend ke baad price mein aik gradual uptrend shuru hota hai, jo ek chhota sa consolidation pattern banata hai, jise "handle" kehte hain.

    Cup:
    Cup, yaadgar taur par, price ki gradual girawat ko represent karta hai jise market mein thora sa pessimism hota hai. Is phase mein, traders sell karte hain aur price down hoti hai. Cup ki shape rounded hoti hai, aur iski depth aur duration vary karti hai.

    Handle:
    Handle phase mein, price mein aik chhota sa pullback hota hai, lekin overall trend ab positive hota hai. Handle price mein consolidation ko represent karta hai, jahan traders ko lagta hai ke downtrend khatam ho gaya hai aur ab fir se uptrend shuru ho sakta hai.

    Trading Signals:
    Cup and Handle pattern ko dekhte hue traders ko bullish reversal ya continuation ke signals milte hain. Agar price handle ke baad bhi uptrend mein rehta hai, to yeh confirmatory signal hai ke bullish momentum strong hai. Agar handle ke baad breakout hota hai, to traders ko buying opportunities ka signal milta hai.

    Risk Management:
    Hamesha yaad rakhein ke kisi bhi pattern ya indicator ki 100% guarantee nahi hoti. Cup and Handle pattern ka istemal karne se pehle, confirmatory factors ka bhi dhyan rakhein. Doosre technical indicators aur market context ko samajhna bhi crucial hai. Is pattern ko sahi tarah se interpret karne ke liye, stop-loss orders ka bhi istemal karna zaroori hai taki traders apne trades ko effectively manage kar sakein.

    In conclusion, Cup and Handle Candlestick Pattern ek important tool hai jo traders ko market trends ke potential changes ke liye alert karta hai. Lekin, sahi risk management aur confirmatory signals ke sath istemal karna important hai.

    Click image for larger version

Name:	download (7).png
Views:	62
Size:	11.4 کلوبائٹ
ID:	12810743

  • <a href="https://www.instaforex.org/ru/?x=ruforum">InstaForex</a>
  • #2 Collapse

    "Cup and Handle" ek technical analysis pattern hai jo forex trading mein istemal hota hai. Yeh pattern market mein potential trend reversal ko darust karti hai. Iske key points ko samajhne ke liye, humein do mukhtalif hisson mein tafseel se ghaur karna hoga: "Cup" aur "Handle".

    Cup:

    Cup ek chart pattern hai jo market mein downtrend ke baad aata hai. Iska appearance aik cup ki tarah hota hai, jisme price pehle gira hota hai aur phir gradual taraqqi dikhaata hai. Cup ka bottom rounded hota hai aur is period mein trading volume kam hota hai. Ye bottom formation market mein ek consolidation phase ko represent karta hai, jisme sellers ke dominance ko gradually buyers ke favor mein convert hone mein tabdeel hota hai.

    Handle:

    Handle cup ke baad aata hai aur ek chota downtrend ko darust karta hai. Handle normally cup ke upar hua move ko corrects karta hai, lekin iski length cup ki tulna mein kam hoti hai. Handle formation ke doran bhi trading volume kam hota hai. Is phase mein market mein thoda sa uncertainty hota hai, lekin agar handle ke baad price phir se upar chala gaya, to ye ek bullish signal hai.

    Click image for larger version

Name:	download.png
Views:	73
Size:	7.5 کلوبائٹ
ID:	12811516


    Keypoints:

    1. Cup Formation:
    Cup ka formation market mein initial downtrend ke baad hota hai. Isme price gradual taur par upar ki taraf move karta hai, aur bottom rounded hota hai.

    2. Low Trading Volume in Cup:
    Cup formation ke doran trading volume normally kam hota hai, jo indicate karta hai ke market mein consolidation phase hai.

    3. Handle Formation:
    Cup ke baad aata hai handle, jo ki ek chota downtrend hota hai. Handle ka length normal cup ke tulna mein kam hota hai.

    4. Low Trading Volume in Handle:
    Jaise cup ke doran, handle ke bhi formation ke doran trading volume kam hota hai, jo ek temporary market uncertainty ko darust karta hai.

    5. Breakout Confirmation:
    Cup and handle pattern ka poora hona ke baad, jab price handle ke upar se phir se upar jaata hai, to ye ek bullish breakout confirm karta hai. Traders is signal ko istemal karke long positions le sakte hain.

    6. Stop-Loss and Target Levels:
    Traders ko stop-loss aur target levels tay karte waqt dhyan rakhna chahiye. Stop-loss levels ko handle ke neeche aur target levels ko cup ki height ke hisab se set kiya ja sakta hai.

    7. Confirmation with Other Indicators:
    Cup and handle pattern ko confirm karne ke liye, traders dusre technical indicators jaise ke RSI, MACD, aur volume analysis ka istemal kar sakte hain.

    Is pattern ki sahi tarah se samajh aur istemal se traders ko market ke potential trend reversals ka pata chal sakta hai, lekin hamesha yaad rakhein ke kisi bhi technical analysis pattern ki 100% guarantee nahi hoti, aur market mein risk ka hamesha khayal rakha jana chahiye.
    Never risk more than you can afford to lose on a single trade.
    • #3 Collapse

      Introduction About Cup and Handle Pattern:

      Assalam o Alicom! Dear Sisters and Brothers Today my topic is cup and handle pattern this topic is very important and interesting topic Cup and Handle Pattern ek bullish pattern hai jo technical analysis mein istemal hota hai. Is pattern mein market price ko ek "U" shape ya cup ki tarah dikhate hai jis mein bottom rounded hota hai. Uske badh consolidation ya retracement hota hai jisse handle kehte hai. Is pattern se ek potential bullish trend movement ka signal milta hai. Cup and handle pattern mainly bullish continuation pattern ke taur par consider kiya jata hai lekin ye bullish reversal pattern bhi ho sakta hai.

      Identification of Cup and Handle Pattern:

      Pyary Bahio or Behno Cup and Handle Pattern ko identify karne ke liye ap forex main kisi bhi currency pair ka chart open kary or dekhy chart par jahan price pehly ek rounded bottom banata hai jo cup ki shape ki tarah hota hai. Cup banany ke badh price ek choti range mein consolidate hoti hai jis se handle ban jata hai, jo ek choty "u" ki tarah dikhta hai.


      How to Understand Cup and Handle Pattern:

      Dear Forex Members Cup and Handle pattern ko samajhne ke liye pehly "Cup" aur "Handle" dono ke meanings ko samajhna zaroori hai. Cup part mein, price action mein ek rounded shape ka movement hota hai, jis se ek cup ya bowl ki tarah dekha ja sakta hai. Yeh generally ek extended downtrend ke baad dikhta hai.
      Last edited by ; 20-01-2024, 11:45 PM.
      • #4 Collapse


        Cup and Handle Chart Pattern:

        Click image for larger version

Name:	download (47).png
Views:	48
Size:	6.4 کلوبائٹ
ID:	12823740


        (Heading): "Cup and Handle" Chart Pattern

        (Haalat): "Cup and Handle" ek technical analysis tool hai jo market trends ko identify karne aur anticipate karne ke liye istemal hota hai. Yeh pattern price chart par ek "cup" jaise shape banata hai, jise phir ek small consolidation period (handle) follow karta hai.

        Bunyadi Tafseelat:

        (Heading): "Bunyadi Tafseelat"

        (Haalat): Cup and Handle pattern ka asal concept ye hai ke jab market mein ek uptrend hota hai, toh price mein ek rounded bottom shape ban jati hai, jise hum log "cup" kehte hain. Phir is cup ke baad ek small consolidation phase aata hai, jo ke handle ki tarah hota hai.

        Cup:

        (Heading): "Cup"

        (Haalat): Cup ek rounded bottom shape hoti hai, jo ke market mein previous downtrend ke baad uptrend ki indication deti hai. Cup ki depth aur symmetry ko analyze karke traders trend reversal ko identify kar sakte hain.

        Handle:

        (Heading): "Handle"

        (Haalat): Handle ek small consolidation phase hota hai jo cup ke baad aata hai. Handle ki formation ke doran price mein sideways movement hoti hai. Handle ka size, slope, aur duration analyze karke traders anticipate karte hain ke uptrend continue hogi ya phir reversal hone ke chances hain.

        Trading Strategies:

        (Heading): "Trading Strategies"

        (Haalat): Traders cup and handle pattern ko dekhte hain aur uske breakout ke baad confirmatory signals ki talaash karte hain. Agar price handle ke breakout ke baad trend ke direction mein move karta hai, toh traders apne positions adjust karte hain.

        Tawajjuat Aur Hifazati Tadabeer:

        (Heading): "Tawajjuat Aur Hifazati Tadabeer"

        (Haalat): Cup and handle pattern ka istemaal karne se pehle, doosre technical indicators aur market conditions ka bhi analysis karna zaroori hai. Risk management, stop-loss orders, aur proper entry/exit points ka tawajju dena bhi bohot important hai.

        Conclusion:

        (Heading): "Tadbeer Aur Gyaan Baratne Ka Waqt"

        (Haalat): Cup and handle chart pattern ek powerful tool hai trend reversal ya continuation ko identify karne mein. Is pattern ka sahi taur par interpret karna aur market conditions ke mutabiq trading decisions lena bohot zaroori hai. Is Roman Urdu mein tafseelat se aapko samajh aagayi hogi ke "Cup and Handle" chart pattern kya hota hai aur kaise Forex trading mein iska istemaal hota hai.
        Last edited by ; 06-02-2024, 09:05 AM.
        • #5 Collapse

          What is Cup and Handle Pattern;
          Dear member Cup and handle" ek technical analysis pattern hai jo stock market mein istemal hota hai. Is pattern mein price chart par ek "cup" shape aur phir ek "handle" shape nazar aati hai. Cup and handle pattern generally bullish hota hai aur ye indicate karta hai ke stock ka price upar ja sakta hai.Cup" phase mein stock price pehle girta hai phir slow taur par badhne lagta hai, creating a rounded bottom. "Handle" phase mein price phir se thoda gir sakta hai lekin overall trend positive hota hai. Agar handle successfully form hota hai, toh traders ye samajhte hain ke stock ka price aur bhi upar ja sakta hai.Yeh pattern traders ko market trends aur possible price movements ke bare mein idea dene mein madad karta hai.
          Market Trends;
          Dear Cup part mein, price action mein ek rounded shape ka movement hota hai, jis se ek cup ya bowl ki tarah dekha ja sakta hai. Yeh generally ek extended downtrend ke baad dikhta hai.Dear Sisters and Brothers Cup and Handle Pattern ek bullish pattern hai jo technical analysis mein istemal hota hai. Is pattern mein market price ko ek "U" shape ya cup ki tarah dikhate hai jis mein bottom rounded hota hai. Uske badh consolidation ya retracement hota hai jisse handle kehte hai. Is pattern se ek potential bullish trend movement ka signal milta hai. Cup and handle pattern mainly bullish continuation pattern ke taur par consider kiya jata hai lekin ye bullish reversal pattern bhi ho sakta hai.
          End;
          Dear Cup ek chart pattern hai jo market mein downtrend ke baad aata hai. Iska appearance aik cup ki tarah hota hai, jisme price pehle gira hota hai aur phir gradual taraqqi dikhaata hai. Cup ka bottom rounded hota hai aur is period mein trading volume kam hota hai. Ye bottom formation market mein ek consolidation phase ko represent karta hai, jisme sellers ke dominance ko gradually buyers ke favor mein convert hone mein tabdeel hota hai.
          • #6 Collapse

            What is Cup and handle


            Click image for larger version

Name:	download (82).jpeg
Views:	47
Size:	12.3 کلوبائٹ
ID:	12811610


            "Cup and Handle" ek technical analysis pattern hai jo stock market mein paya jata hai. Ye pattern generally bullish reversal pattern hota hai, iska matlab hai ke jab ye pattern ban raha hota hai, to market mein pehle bearish trend ke baad tezi ka chance hota hai. Yeh pattern traders ko potential buy signals dene mein madad karta hai.

            Is pattern ko "Cup and Handle" is liye kaha jata hai kyunki iski appearance ek cup aur handle ki tarah hoti hai. Yahan is pattern ki tafseel di gayi hai:
            1. Cup Formation:
              • Pehli stage mein, security ki price mein ek rounded bottom ya cup shape banti hai.
              • Cup ki shape kabhi bhi perfect round nahi hoti, lekin general idea yeh hai ke prices pehle girte hain aur phir aahista aahista wapas upar jaate hain.
              • Cup ke bottom par aane wale prices ke sath trading volume bhi dekha jata hai, jo is trend ko confirm karta hai.
            2. Handle Formation:
              • Cup ban jane ke baad, market mein thori si correction ya price decline hoti hai, jise "handle" kehte hain.
              • Handle ek descending (girte hue) ya sideways price movement hota hai.
              • Handle ke doran volume generally kam hota hai.
            3. Breakout:
              • Handle ke baad agar price phir se upar jaane lagti hai aur cup ki height ko cross karti hai, to ise "breakout" kaha jata hai.
              • Breakout ke doran volume increase ho sakta hai, jo ek aur confirmation signal ho sakta hai.

            Cup and Handle pattern ka istemaal traders karte hain taake woh trend reversal ka pata laga sakein aur potential buying opportunities ko identify kar sakein. Is pattern ka mool uddeshya yeh hota hai ki jab cup and handle complete hota hai aur breakout hota hai, to stock ya security mein tezi ki shuruat ho sakti hai.

            Yeh pattern kisi bhi time frame par dekha ja sakta hai, lekin iske successful hone ke liye sahi samay par entry aur exit karna zaroori hai. Har pattern ki tarah, Cup and Handle bhi 100% confirmation nahi deta, aur is par bharosa karne se pehle doosre technical indicators aur analysis ke saath milake istemal karna behtar hota hai.
            • #7 Collapse

              :-Forex me Cup Aur Handle-:

              "Cup and Handle" ek technical analysis pattern hai jo forex market mein price chart par dikhai deta hai. Ye pattern traders ko potential trend reversals ya trend continuation ke signals provide karne ke liye istemal hota hai.
              1. Cup: Cup pattern, price chart par ek rounded bottom ko represent karta hai. Isme price initially down hoti hai, fir gradual taur par upar ki taraf move karti hai, jise ek curve ya cup ki tarah dekha ja sakta hai. Cup pattern ka bottom point typically rounded hota hai.
              2. Handle: Cup ke baad aane wala small consolidation period ko "handle" kaha jata hai. Handle, cup pattern ke upar ek small downward move ko darust karta hai. Handle price chart par ek chhota rectangle ya descending trend line ke roop mein dikhta hai.


              Cup and Handle pattern ko tab consider kiya jata hai jab ye kisi trend ke reversal ko ya trend continuation ko indicate karta hai. Agar cup and handle pattern uptrend ke baad aata hai, toh ye trend continuation ke liye signal dene ka prateet hota hai. Agar ye pattern downtrend ke baad aata hai, toh ye trend reversal ke liye signal provide kar sakta hai.

              :-Forex me Cup Aur Handle Ki Characteristics-:
              1. Muddat:
                • Cup and Handle pattern ban'nay mein kuch haftay ya mahinay lag saktay hain.
                • Cup ka hissa aksar handle se ziada arsa leta hai.
              2. Volume Tijarat:
                • Cup ban'nay ke doran trading volume amuman barh jata hai jab ke qeemat bhi barhti hai.
                • Handle ke doran aksar volume mein kami hoti hai, jo ke ek consolidation ya temporary pause ko darust karti hai.
              3. Breakout Tasdeeq:
                • Traders aksar pattern ki tasdeeq ke liye breakout ka intezar karte hain. Breakout tab hota hai jab qeemat handle ke upper resistance level se ooper jaati hai.
                • Breakout par izafay ke saath izafay wala volume bhi pattern ke signal ko mazbooti deta hai.
              4. Maqsad Qeemat:
                • Pattern ka maqsad qeemat ko measure karke tay kiya ja sakta hai, jismein cup ka nichla hissa handle ka resistance level hai, aur is distance ko breakout point par izafay ke liye add karna hota hai.
                • Lekin yaad rahe ke haqeeqatan mein market kaarwan hamesha maqsad ko pura nahi karta.
              5. Handle Ka Shakhsiyat:
                • Handle alag alag shaklon mein aa sakta hai, jese ke ek sideway consolidation ya halki neeche ki taraf drift.
                • Handle mein becharee dabao mein kami dikhai deni chahiye, jo ek moqaddas tezi ko darust karti hai.
              • #8 Collapse

                What is cup and handle

                Click image for larger version

Name:	1.jpg
Views:	53
Size:	91.9 کلوبائٹ
ID:	12811638


                "Cup and Handle" ek technical analysis chart pattern hai, jo financial markets mein istemal hota hai, jaise ke stocks, commodities, ya cryptocurrencies mein. Yeh pattern ek bullish trend reversal ko darust karna ke liye istemal hota hai aur trader ko potential buying opportunities dikhane mein madad karta hai.


                Is pattern ko do mukhya hisson mein divide kiya ja sakta hai:
                1. Cup (Pyala): Cup, chart par ek U-shaped curve ko represent karta hai, jo ek tea cup ya bowl ki tarah dikhti hai. Is phase mein, asset ki keemat mein pehle dhire-dhire giravat hoti hai, phir dhire-dhire badhav hota hai, aur ek round-shaped bottom ban jata hai. Cup banane wala phase, consolidation aur accumulation ka samay hota hai, jisme buyers ke dwara asset ko accumulate kiya jata hai.
                2. Handle (Dhara): Handle, cup ko follow karne wala chhota sa consolidation period hota hai. Isme keemat mein halki giravat hoti hai, aur ek chhota consolidation pattern ban jata hai. Handle ka role hota hai ek chhota retracement dena, fir keemat mein fir se badhav hone se pehle.


                Cup and handle pattern ka pura ho jana tab hota hai jab keemat handle ke banaye gaye resistance level ko upar se break karti hai. Is breakout ko dekh kar traders ko lagta hai ki asset ki keemat mein aur tezi hone wala hai, aur isse ek potential buying opportunity samjha jata hai.


                Yaad rahe ki chart patterns ka istemal sirf ek tool hai, aur iske saath doosre technical analysis tools aur indicators ka bhi istemal karna important hai. Trading mein kisi bhi pattern par pura bharosa na karein, aur hamesha market conditions ko dhyan mein rakhein.
                • #9 Collapse

                  What is cup and handle


                  "Cup and handle" ek technical analysis pattern hai jo trading aur chart analysis mein istemal hota hai taaki kisi financial asset, jaise ki stocks, mein hone wale potential bullish (upward) trends ko pehchana ja sake. Ye ek continuation pattern hai, jo dikhata hai ki ek mojud uptrend chhota sa consolidation ke baad aage badhne ki sambhavna hai.


                  Pattern do mukhya hisson mein bata hai: cup aur handle.

                  1. Cup Formation:
                  • Cup ka hissa jab banata hai, tab usme ek chai ka cup ya round bottom jaise shape hoti hai. Ye tab banta hai jab asset ki kimat mein dhire-dhire girawat hoti hai, fir ek round bottom aata hai aur uske baad kimat mein tezi se badhne lagti hai.
                  • Cup ka left side initial downtrend ko darshata hai, bottom cup ka sabse niche ka point hai, aur right side cup ke upward movement ka shuruaat ko darshata hai.

                  2. Handle Formation:
                  • Jab cup banta hai, toh uske baad usually ek chhota consolidation period hota hai jise handle kehte hain. Handle ek chhoti si price correction ya consolidation hoti hai jo cup ke upward movement ke baad aati hai.
                  • Handle ko thoda sa niche ya sideways price movement ke roop mein darshaya jata hai.


                  Traders cup and handle pattern ko ek bullish signal maante hain, jiska arth hai ki asset ki kimat aage badhne ki sambhavna hai. Pattern tab complete hota hai jab price handle ke dwara establish kiye gaye resistance level ko paar karta hai.


                  Lekin dhyan dena important hai ki har cup and handle pattern kisi significant price badhne mein nahi result karta, aur traders ko signals ko confirm karne aur informed decisions lene ke liye doosre technical indicators aur analysis tools ka istemal karna chahiye.
                  • #10 Collapse


                    What is cup and handle

                    Click image for larger version

Name:	download (33).jpeg
Views:	42
Size:	15.1 کلوبائٹ
ID:	12811692


                    "Cup and Handle" ek technical analysis pattern hai jo stocks ke price movements ko predict karne ke liye istemal hota hai. Yeh pattern typically bullish trend ke indication ke roop mein samjha jata hai aur traders ko potential entry points aur price targets identify karne mein madad karta hai.

                    Is pattern ka naam uske appearance se aaya hai, jisme do parts hote hain - ek "cup" aur ek "handle". Cup and Handle pattern ka formation hamesha uptrend ke baad hota hai.

                    "Cup" ka phase stock ke price chart par ek rounded bottom ko represent karta hai. Yeh phase usually months ya years tak ka time span cover kar sakta hai. Is phase mein stock ka price initially down hota hai, phir gradual taur par upar ki taraf move karta hai aur ek rounded shape banata hai, jise "cup" kehte hain.

                    "Handle" ek chhota sa consolidation period hota hai, jisme stock ka price phir se thoda sa down hota hai, lekin overall trend positive rehta hai. Handle usually flat ya sideways movement ko darust karta hai.

                    Agar handle ka formation ho jata hai, toh traders ko lagta hai ki stock ready hai ek aur upward move ke liye. Cup and Handle pattern ka confirmation tab hota hai jab stock ka price handle ke breakout ke baad upar ki taraf move karta hai.

                    Traders is pattern ko dekhte hue entry aur exit points decide karte hain. Cup and Handle ki samajh aur sahi tarah se istemal karne ke liye technical analysis ka accha gyaan hona chahiye, kyunki market mein hamesha uncertainty rehti hai aur kisi bhi pattern ki guarantee nahi hoti.
                    • #11 Collapse

                      what is cup and handle

                      Click image for larger version

Name:	d.png
Views:	45
Size:	36.4 کلوبائٹ
ID:	12811710


                      "Cup and Handle" ek technical analysis chart pattern hai, jo stock market aur forex trading mein istemal hota hai. Ye pattern ek bullish reversal pattern hai, yaani ke isse aksar price uptrend ke baad down trend se wapas uptrend mein badalta hai.


                      Cup and Handle Kya Hai?

                      "Cup and Handle" ek aise chart pattern ko describe karta hai jisme price pehle ek round shape banata hai (cup), phir thoda sa niche aata hai, aur phir ek smaller consolidation ya handle banata hai.


                      Kaise Banata Hai:
                      1. Cup (Piyaali): Cup shape banane ke liye, price pehle ek uptrend se girta hai aur phir rounded bottom form karta hai. Is phase mein price gradual taur par girta hai aur fir slow taur par badhne lagta hai, ek rounded shape banate hue.
                      2. Handle (Dasta): Cup ke baad ek small pullback aata hai, jo handle ke roop mein dikhai deta hai. Handle normally ek sideways ya downward movement hota hai, lekin ye overall cup ke shape ke andar rehta hai.


                      Cup and Handle Ka Matlab:
                      1. Bullish Reversal Signal (Bullish Ulati): Cup and Handle pattern ko dekhte hue traders bullish reversal ka signal samajhte hain. Is pattern ke formation ke baad, price ka expectation hota hai ki woh wapas uptrend mein jaayega.
                      2. Entry Point (Daakhil Hone Ka Point): Traders normally handle ke breakout point par entry karte hain. Agar handle ke breakout upward hota hai, toh ye ek potential buying opportunity ho sakti hai.
                      3. Volume Ka Role (Volume Ka Hissa): Pattern ke breakout ya breakdown ke waqt volume ka bhi ek important role hota hai. Agar breakout ke saath volume badh raha hai, toh ye ek positive sign hai.


                      Cup and Handle Trading Strategy:
                      1. Entry Point (Daakhil Hone Ka Point): Traders handle ke breakout point par entry karte hain, jo ki consolidation phase ke baad hota hai.
                      2. Stop-Loss and Target (Nuksan Rokne Aur Lakshya): Stop-loss orders normally handle ke low ke thoda sa neeche lagaye jaate hain. Targets ko determine karne mein previous uptrend ke liye technical analysis ka istemal kiya ja sakta hai.
                      3. Confirmation (Tasdeeq): Traders ko breakout ke baad confirmatory signals ki bhi zarurat hoti hai, jaise ki volume ka tezi se badhna.

                      Yeh important hai ki market mein kuch bhi guarantee nahi hoti, aur har trading strategy risk management ke saath istemal karni chahiye. Cup and Handle pattern ek tool hai jo market analysis mein istemal hoti hai, lekin iske successful hone par kai factors depend karte hain.
                      • #12 Collapse

                        CUP AND HANDLE PATTERN:

                        Click image for larger version

Name:	cup and image.jpg
Views:	18
Size:	15.0 کلوبائٹ
ID:	12911768

                        Cup and Handle pattern ek popular technical analysis pattern hai jo bullish reversal ya continuation ko darust karne mein madadgar hota hai. Yeh pattern ek u-shaped cup ke saath ek handle se milta hai, jo market ke movement ko represent karta hai. Yahan kuch tafseeli points hain Cup and Handle pattern ke mutalliq:


                        Cup Formation (Cup Ka Banawat):

                        Cup and Handle pattern ka pehla hissa "cup" hota hai, jo typically ek u-shaped formation hoti hai. Cup formation ke doran price initially down hoti hai, phir gradual taur par upar ki taraf move karti hai, phir wahi level pe wapas ati hai jahan pe start hui thi, ya usse thoda oopar ya neeche. Is u-shaped formation ko cup kehte hain.

                        Handle Formation (Handle Ka Banawat):

                        Cup ke baad aata hai "handle", jo typically ek choti si downward price movement ko represent karta hai, jiska shape triangle ya small rectangle jaise hota hai. Handle usually cup ke neeche hota hai aur iski length cup ki length se choti hoti hai.

                        Volume Analysis (Volume Ka Mutalaa):

                        Cup and Handle pattern ke confirmation ke liye volume analysis ki zaroorat hoti hai. Cup formation ke doran volume usually increase hoti hai, jabke handle formation ke doran volume thoda kam hoti hai. Breakout ke waqt, volume phir se increase hoti hai.

                        Breakout (Breakout):

                        Cup and Handle pattern ka mukammal hone ke baad, traders breakout ka wait karte hain. Breakout tab hota hai jab price handle ke resistance level ko cross karta hai aur uptrend mein jaata hai. Breakout ke waqt, volume ka bhi izafa hota hai, jo bullish continuation ya reversal ko confirm karta hai.
                        Target Calculation (Maqsad Ka Hisaab):

                        Cup and Handle pattern ka target usually cup ki depth ko handle ke breakout point se add karke calculate kiya jata hai. Yeh target price ko estimate karne mein madadgar hota hai.


                        Cup and Handle pattern ek powerful bullish signal hai, lekin iski confirmation ke liye zaroori hai ke traders volume aur breakout ka bhi tawajjo dein. Is pattern ka istemal karke traders potential entry aur exit points ka faisla kar sakte hain.


                        • #13 Collapse

                          "Cup and Handle" ek bullish continuation pattern hai jo technical analysis mein istemal hota hai. Yeh pattern ek price chart par dekha ja sakta hai jab market mein ek uptrend ke baad price consolidation hoti hai aur phir trend continue hota hai. Is pattern ko "cup" aur "handle" ke shape ki tarah describe kiya jata hai

                          Dear friends Yahan Cup and Handle pattern ke kuch key points hain:

                          Formation


                          Cup and Handle pattern typically ek bullish reversal ya continuation pattern ke roop mein form hota hai.
                          Pehle cup portion mein price ek rounded bottom pattern form karta hai jise "cup" kehte hain. Cup formation mein price mein gradual decline hoti hai jiska baad mein gradual increase hota hai.
                          Cup formation ke baad ek small price consolidation phase hota hai jise "handle" kehte hain. Handle formation mein price mein sideways movement hoti hai ya thoda sa downward movement hota hai.

                          Volume

                          Volume analysis bhi Cup and Handle pattern ke liye important hai. Generally, cup formation mein volume decline hota hai jabki handle formation mein volume low hota hai. Phir jab price handle ke breakout karta hai, toh volume increase hota hai, indicating bullish continuation.

                          Breakout


                          Cup and Handle pattern ka validation handle ke breakout ke baad hota hai. Jab price handle ke upper side breakout karta hai, yani handle ke high level ko cross karta hai, toh yeh ek bullish signal hota hai aur traders ko buy ki opportunity provide karta hai.
                          Breakout ke baad price typically previous uptrend ke continuation mein move karta hai.

                          Target


                          Cup and Handle pattern ka target price ka estimate kiya ja sakta hai. Target ko cup formation ke depth se measure kiya jata hai aur use handle breakout level se add kiya jata hai. Yeh target price ke liye ek estimation provide karta hai.

                          Cup and Handle pattern ek popular aur reliable pattern hai jo traders ke liye bullish continuation ka indication provide karta hai. Lekin, is pattern ko confirm karne ke liye traders ko volume analysis aur breakout confirmation ka bhi dhyan dena chahiye.
                          • #14 Collapse

                            **Cup and Handle Pattern: Forex Trading Mein Iski Ahmiyat**
                            **Cup and Handle** pattern ek bullish continuation pattern hai jo technical analysis mein use hota hai aur price trend ke continuation ko signal karta hai. Yeh pattern stock trading, forex trading, aur other financial markets mein widely recognized hai. Aaj hum is pattern ki detail mein jaayenge aur dekhenge ke isse kaise effectively use kiya ja sakta hai.

                            ### Cup and Handle Pattern Kya Hai?

                            Cup and Handle pattern do main components se mil kar banta hai:

                            1. **Cup**: Cup ka part ek U-shaped curve hota hai jo price ko ek rounded bottom banate hue reflect karta hai. Yeh pattern ka cup part ek gradual decline aur uske baad ek gradual recovery ko represent karta hai. Cup ki shape kuchh is tarah se hoti hai ke price peak ke neeche wapas aati hai aur fir wapas upward movement show karti hai.

                            2. **Handle**: Handle pattern ka second part hota hai jo cup ke right side par develop hota hai. Yeh typically ek consolidation phase hota hai jahan price thoda sideways movement ya slight downward drift dikhati hai, phir se cup ke higher level ke upar breakout ke liye tayar hota hai.

                            ### Pattern Ki Pehchan

                            1. **Cup Formation**: Cup banate waqt, price pehle ek significant decline ko dikhati hai, jo gradually bottom tak reach karta hai aur fir gradually recover karta hai. Cup ke shape ko identify karne ke liye U-shape ya rounded bottom ka dekhna zaroori hai.

                            2. **Handle Formation**: Handle banate waqt, price ek consolidation phase dikhati hai jo usually cup ke right side par hota hai. Yeh consolidation phase usually cup ke high se thoda niche hota hai aur sideways ya slight downward movement ko reflect karta hai.

                            3. **Breakout**: Handle ke formation ke baad, price ko cup ke high se break karna chahiye. Yeh breakout bullish confirmation signal hota hai aur price ke higher levels tak move karne ki expectation hoti hai.

                            ### Trading Strategies

                            1. **Entry Point**: Cup and Handle pattern ke complete hone ke baad, entry point handle ke high ke upar set kiya jata hai. Yeh point bullish breakout ka indication hota hai.

                            2. **Stop-Loss**: Stop-loss ko handle ke low ke neeche set kiya jata hai taake unexpected market movements se protection mil sake.

                            3. **Profit Target**: Profit target ko cup ke height ko measure karke set kiya jata hai. Yeh target ko pattern ke breakout point se add karke calculate kiya jata hai.

                            4. **Volume Analysis**: Cup and Handle pattern ke sath volume analysis bhi important hai. Handle formation ke dauran volume kam hona chahiye aur breakout ke waqt volume increase hona chahiye, jo bullish trend ko confirm karta hai.

                            ### Risks and Considerations

                            1. **False Breakouts**: Cup and Handle pattern ke saath false breakouts bhi ho sakte hain. Traders ko pattern ke formation aur volume analysis par dhyan rakhna chahiye taake accurate breakout signals ko identify kiya ja sake.

                            2. **Market Conditions**: Cup and Handle pattern ko market conditions ke mutabiq use karein. Yeh pattern tabhi effective hota hai jab market overall bullish trend mein ho aur consolidation phase ke baad strong breakout ki expectation ho.

                            ### Conclusion

                            Cup and Handle pattern ek powerful bullish continuation pattern hai jo forex traders ko market ke future movements ko predict karne mein madad karta hai. Is pattern ko sahi tarike se identify karne aur trading strategies ko implement karne se traders ko market ke trends aur breakout signals ko effectively utilize karne ka mauka milta hai. Proper risk management aur volume analysis ke sath, Cup and Handle pattern ka use karke profitable trades ki chances barha sakte hain.
                            • <a href="https://www.instaforex.org/ru/?x=ruforum">InstaForex</a>
                            • #15 Collapse

                              What is the Cup and Handle Pattern?

                              cup-handle-chart-pattern-formation-260nw-1821675758.webp


                              The Cup and Handle Pattern is a classic chart pattern used in technical analysis to identify potential bullish continuation signals. It is a popular pattern among traders and investors for spotting opportunities in uptrends. The pattern resembles a cup with a handle and indicates that after a period of consolidation, the price is likely to resume its upward movement.
                              Characteristics of the Cup and Handle Pattern
                              1. Cup Formation:
                                • The Cup is a rounded, U-shaped consolidation period. It typically starts with a gradual decline, followed by a rounded bottom, and then a gradual rise back to the original price level.
                                • The Cup resembles a "U" shape, indicating a period of accumulation where buyers and sellers are in equilibrium.
                              2. Handle Formation:
                                • The Handle is a consolidation period that forms after the Cup. It generally resembles a small pullback or consolidation near the previous high of the Cup.
                                • The Handle typically appears as a downward or sideways price movement and usually takes about one-quarter to one-third of the time it took to form the Cup.
                              3. Breakout:
                                • The breakout occurs when the price moves above the resistance level formed by the high of the Cup. This breakout is often accompanied by an increase in trading volume, signaling the continuation of the bullish trend.
                              Interpretation of the Cup and Handle Pattern


                              The Cup and Handle Pattern suggests a period of consolidation followed by a continuation of the previous uptrend. The Cup represents a period of accumulation where investors are buying at lower prices, and the Handle represents a final consolidation before a breakout. The pattern indicates that the price is likely to rise once it breaks above the resistance level established by the high of the Cup.
                              Trading the Cup and Handle Pattern


                              When trading the Cup and Handle Pattern, consider the following steps:
                              1. Identify the Pattern: Look for the Cup and Handle formation on the chart. Ensure that the Cup is U-shaped and that the Handle forms a consolidation phase near the previous high.
                              2. Confirm the Breakout: Wait for the price to break above the resistance level formed by the high of the Cup. Confirmation is often indicated by an increase in trading volume.
                              3. Enter the Trade: Enter a long position once the price breaks above the resistance level of the Cup. This breakout signals the continuation of the uptrend.
                              4. Set a Stop-Loss: Place a stop-loss order below the low of the Handle or the bottom of the Cup. This helps protect against potential false signals and adverse price movements.
                              5. Take Profit: Determine your profit target based on the overall market trend, key resistance levels, or a predefined risk-reward ratio. One common method is to measure the height of the Cup and project it upwards from the breakout point.
                              Example of the Cup and Handle Pattern


                              Imagine a stock that has been in an uptrend and then begins to decline, forming a rounded bottom (the Cup). After reaching the low, the stock starts to rise again but consolidates in a smaller, downward-sloping pattern (the Handle). Once the stock breaks above the high of the Cup with increased volume, it signals a potential continuation of the uptrend. A trader might enter a long position at the breakout point and set a stop-loss below the Handle's low.
                              Conclusion


                              The Cup and Handle Pattern is a valuable tool for traders seeking to identify bullish continuation signals. By recognizing and understanding this pattern, traders can make more informed decisions and improve their trading strategies. As with any technical analysis pattern, it is important to use the Cup and Handle Pattern in conjunction with other analysis tools and risk management techniques to enhance its effectiveness and increase the probability of successful trades.

                              Click image for larger version

Name:	ch-PATTERN-image-1-continuation.png
Views:	4
Size:	5.6 کلوبائٹ
ID:	13068886

                              اب آن لائن

                              Working...
                              X