What is the wedge pattern in forex
X
  • وقت
  • دکھائیں
Clear All
new posts
  • #1 Collapse

    What is the wedge pattern in forex
    Wedge pattern

    Wedge Pattern ek technical analysis concept hai jo traders ko market trends aur potential price movements ke signals provide karta hai. Yeh pattern price action analysis par mabni hota hai aur market mein hone wale reversals ya trend continuations ko indicate karta hai.
    Wedge Pattern ek consolidation pattern hai, jise market mein uncertainty ya indecision ke doran create hota hai. Is pattern mein price ek triangle ya wedge shape banata hai, jismein do trend lines converge hoti hain.

    Wedge Pattern do types ka hota hai:

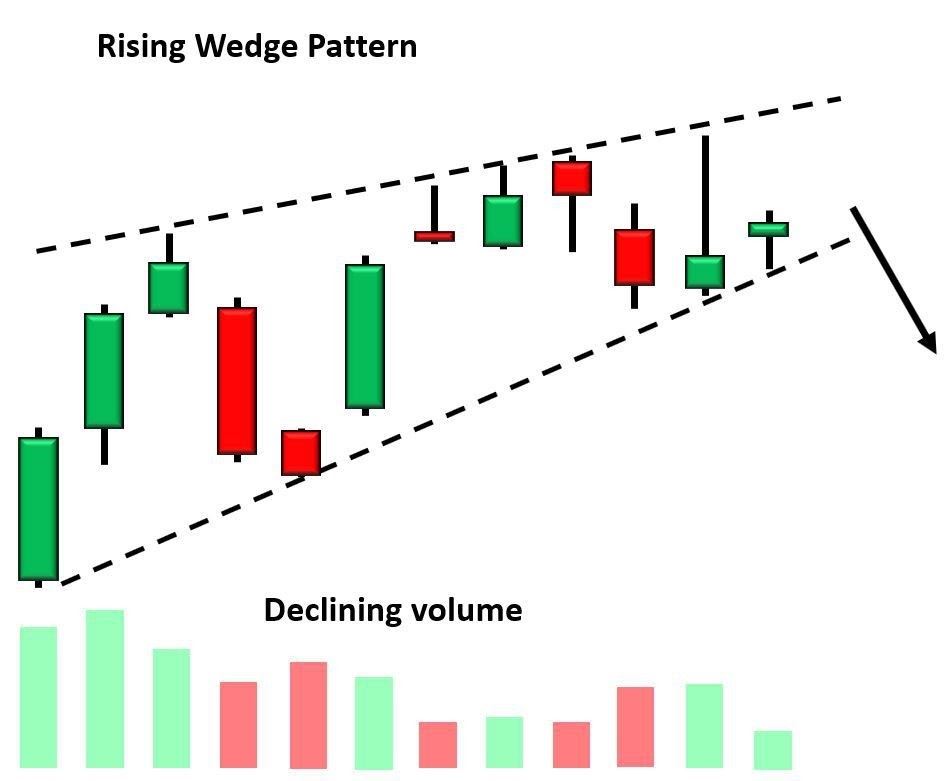
    Rising Wedge (Upar ki Wedge): Ismein upper trend line sloping upward hoti hai, jo indicate karta hai ke higher highs ban rahe hain, aur lower trend line bhi sloping upward hoti hai, jo lower lows ko represent karti hai. Rising wedge typically bearish reversal ko indicate karta hai.

    Falling Wedge (Niche ki Wedge): Ismein lower trend line sloping upward hoti hai, jo indicate karta hai ke lower lows ban rahe hain, aur upper trend line bhi sloping upward hoti hai, jo higher highs ko represent karti hai. Falling wedge typically bullish reversal ko indicate karta hai.

    Wedge Pattern ko identify karne ke liye, traders ko price action aur trend lines ka dhyan rakhna hota hai. Wedge pattern ke formation ke doran, price mehsoos karne wale indecision aur market participants ke conflict ko darust karta hai.

    Wedge pattern ka breakout hone par traders ko entry points milte hain. Agar rising wedge ka breakout niche hota hai, to yeh bearish reversal ko indicate karta hai aur traders selling opportunities dekhte hain. Wahi agar falling wedge ka breakout upar hota hai, to yeh bullish reversal ko indicate karta hai aur traders buying opportunities dekhte hain.

    Hamesha yaad rakhein ke breakout ke confirmation ke liye doosre technical indicators ka bhi istemal karna important hai. Volume analysis aur trend line breakouts ko confirm karne ke liye volume aur price action analysis ka bhi dhyan rakhna chahiye.

    Wedge Pattern ka istemal karke traders apne trading strategies ko refine kar sakte hain. Stop-loss orders ka istemal karke risk management ko bhi maintain kiya ja sakta hai. Lekin, hamesha market context ko samajhna aur confirmatory signals ka wait karna important hai.
    Click image for larger version

Name:	image_115875.png
Views:	58
Size:	9.4 کلوبائٹ
ID:	12809199
    In conclusion, Wedge Pattern ek important tool hai jo traders ko market trends ke potential reversals ya trend continuations ke signals provide karta hai. Yeh pattern market indecision aur uncertainty ko capture karta hai, lekin sahi istemal ke liye patience aur discipline ka bhi hona zaroori hai.


  • <a href="https://www.instaforex.org/ru/?x=ruforum">InstaForex</a>
  • #2 Collapse

    What is Wedge Chart Pattern in Forex?
    Assalam alaikum Dear friends and forex members Wedge Chart Pattern traders ko market me hony waly possible trend reversals ke bare me agah karta hy. Jab yeh pattern ban jata hy, to traders ko samajh aata hy ke market me volatility badhne wala hy. Agar Rising Wedge ban raha hy toh yeh ishara kar sakta hy ke bullish trend khatam hony wala hy aur bearish trend shuru hony wala hy. Wahi agar Falling Wedge ban raha hy toh yeh ishara kar sakta hy ke bearish trend khatam hony wala hy aur bullish trend shuru hony wala hy.

    Wedge pattern
    Dear memners wedge pattern ek technical analysis ka part hy or es me 2 coverging trend lines bnti hein market k highs or lows ko mila k. market k highs ya to falling hoty hein ya rising or esy hi lows bhi falling or rising ho skty hein jiski wja se wedge ki 2 types hoti hy.Wedge chart pattern ek strong reversal pattern hota hy jo k technical analysis me use kia jata hy. Ye pattern donu me se 1 ka signal ho skta hy ye to bullish ya bearish laikin dono conditions me es k 3 feature hoty hein. Converging trend linesdeclining volume breakout of the wedge Declining volume ka mtlb hota hy jesy hesy market wedge me agy brhti hy to wedge ka area short hota jata hy jiski wja se trading volume bht km hota hy or market bht km move karti hy. Breakout ka mtlb hota hy market wedge ko tor k es se bhr nkl jati hy kisi bhi side py ho skta hy nechy ya oper.

    Rising Wedge.
    Dear members wedge generally market k trend k opposite bnta hy mtlb k agr market downtrend me hy to us me rising wedge ho ga or aksr break out wedge ki direction se opposite hota hy mtlb k agr rising wedge hy to breakout lower line se ho ga r market sell me jygi. Rising wedge tb bnta hy jb market higher highs ya or higher lows bnati hy or 2 converging lines banti hein in highs or lows ko mila k. or market ka volume down hota jata hy jesy jesy market move kari hy wedge me.

    Falling Wedge.
    Dear members falling wedge tb banta hy jb market lower highs or lower lows estrha se bnati hy k lows or highs ko mila k 2 converging line banti hein. jesy jes market wedge me move karti hy trading volume km hota jata hy or wedge ka area bhi. falling wedge ka breakout generally upper trend line se hota hy laikin phr bhi apko market ko dehan se dkhna chahiye kyun k bahz oqat wedge ka breakout kisi bhi direction me ho skta hy.

    Trading with wedge Pattern
    Wedge ko trade karny k liye apko es k breakout ka wait karna hota hy jb ap dekhen breakout ho gia hy to uski confirmation ka wait ka wat karen breakout ki confirmation ye hoti hy k breakout k bad market km se km hourly candle close kary apni support ya resistance se bhr.or phr market apni support ya resistance ko test kary. to jb market test kary to ap usi test py trade ln gy or apka stop loss support ya resistance line ya us se thora neechy ho ga


    • #3 Collapse

      What is wedge Chart pattern

      Wedge chart pattern ek technical analysis pattern hai jo price charts par dikhai dene wala hota hai. Yeh pattern price movement ko ek wedge, yaani ki ek tukda, ke andar bandhne ki tendency dikhata hai. Wedge pattern do prakar ke hote hain: Rising Wedge aur Falling Wedge.
      1. Rising Wedge (Upar Ki Or Badhne Wala Wedge):
        • Formation: Rising Wedge pattern uptrend ke doran ban sakta hai. Isme, price ek converging trendline ke beech mein move karta hai, jisme upper trendline (resistance line) lower trendline (support line) ko cross karte hain.
        • Significance: Rising Wedge pattern bearish reversal ya trend continuation ke liye ek potential indication ho sakta hai. Agar price lower trendline ko break karta hai, toh yeh bearish reversal ki possibility ko suggest karta hai.
      2. Falling Wedge (Niche Ki Or Girne Wala Wedge):
        • Formation: Falling Wedge pattern downtrend ke doran ban sakta hai. Isme, price ek converging trendline ke beech mein move karta hai, jisme lower trendline (support line) upper trendline (resistance line) ko cross karte hain.
        • Significance: Falling Wedge pattern bullish reversal ya trend continuation ke liye ek potential indication ho sakta hai. Agar price upper trendline ko break karta hai, toh yeh bullish reversal ki possibility ko suggest karta hai.
      Treading Strategy
      Wedge patterns market volatility aur indecision ko darust karti hain. In patterns ko dekhte hue traders potential trend reversals ya trend continuation ka estimate lagate hain. Breakout direction, yaani ki trendline ko kis tarah se cross karta hai, usse traders potential future price movement ka guess lagate hain.Hamesha yaad rahe ki chart patterns ke saath-sath aur bhi factors ko consider karna important hai trading decisions lene se pehle, aur in patterns ka use kisi aur indicator ya strategy ke saath combine karke karna aur bhi effective ho sakta hai.


      • #4 Collapse

        What is Wedge Chart Pattern in Forex?
        Assalam alaikum Dear friends and forex members Wedge Chart Pattern traders ko market me hony waly possible trend reversals ke bare me agah karta hy. Jab yeh pattern ban jata hy, to traders ko samajh aata hy ke market me volatility badhne wala hy. Agar Rising Wedge ban raha hy toh yeh ishara kar sakta hy ke bullish trend khatam hony wala hy aur bearish trend shuru hony wala hy. Wahi agar Falling Wedge ban raha hy toh yeh ishara kar sakta hy ke bearish trend khatam hony wala hy aur bullish trend shuru hony wala hy.

        Wedge pattern
        Dear memners wedge pattern ek technical analysis ka part hy or es me 2 coverging trend lines bnti hein market k highs or lows ko mila k. market k highs ya to falling hoty hein ya rising or esy hi lows bhi falling or rising ho skty hein jiski wja se wedge ki 2 types hoti hy.Wedge chart pattern ek strong reversal pattern hota hy jo k technical analysis me use kia jata hy. Ye pattern donu me se 1 ka signal ho skta hy ye to bullish ya bearish laikin dono conditions me es k 3 feature hoty hein. Converging trend linesdeclining volume breakout of the wedge Declining volume ka mtlb hota hy jesy hesy market wedge me agy brhti hy to wedge ka area short hota jata hy jiski wja se trading volume bht km hota hy or market bht km move karti hy. Breakout ka mtlb hota hy market wedge ko tor k es se bhr nkl jati hy kisi bhi side py ho skta hy nechy ya oper.

        Rising Wedge.
        Dear members wedge generally market k trend k opposite bnta hy mtlb k agr market downtrend me hy to us me rising wedge ho ga or aksr break out wedge ki direction se opposite hota hy mtlb k agr rising wedge hy to breakout lower line se ho ga r market sell me jygi. Rising wedge tb bnta hy jb market higher highs ya or higher lows bnati hy or 2 converging lines banti hein in highs or lows ko mila k. or market ka volume down hota jata hy jesy jesy market move kari hy wedge me.

        Falling Wedge.
        Dear members falling wedge tb banta hy jb market lower highs or lower lows estrha se bnati hy k lows or highs ko mila k 2 converging line banti hein. jesy jes market wedge me move karti hy trading volume km hota jata hy or wedge ka area bhi. falling wedge ka breakout generally upper trend line se hota hy laikin phr bhi apko market ko dehan se dkhna chahiye kyun k bahz oqat wedge ka breakout kisi bhi direction me ho skta hy.

        Trading with wedge Pattern.
        Wedge ko trade karny k liye apko es k breakout ka wait karna hota hy jb ap dekhen breakout ho gia hy to uski confirmation ka wait ka wat karen breakout ki confirmation ye hoti hy k breakout k bad market km se km hourly candle close kary apni support ya resistance se bhr.or phr market apni support ya resistance ko test kary. to jb market test kary to ap usi test py trade ln gy or apka stop loss support ya resistance line ya us se thora neechy ho ga


        • #5 Collapse

          What is the wedge pattern in forex
          Click image for larger version

Name:	download (11).png
Views:	60
Size:	5.0 کلوبائٹ
ID:	12809532
          Wedge Pattern in Forex Trading

          Forex trading ek complex financial market hai jahan currencies ko khareedna aur bechna hota hai. Traders ke liye mukhtalif strategies aur technical analysis tools ka istemal hota hai taki woh behtar trading decisions le sakein. Ek aham technical pattern jo traders ke liye useful hai, woh hai "wedge pattern." Wedge pattern ek price action pattern hai jo market trend ko identify karne mein madad karta hai. Is article mein hum wedge pattern ke bare mein roman Urdu mein 800 alfaz tak baat karenge.

          Wedge pattern ek trend reversal ya trend continuation pattern hota hai. Iska istemal market ke future movements ko predict karne mein kiya jata hai. Wedge pattern do prakar ke hote hain: ascending wedge (barhte hue wedge) aur descending wedge (ghathte hue wedge).

          Ascending Wedge (Barhte Hue Wedge):

          Ascending wedge pattern ek bullish reversal pattern hai jo market mein bearish trend ke baad paya jata hai. Is pattern mein price ek slanting trend line ke andar move karta hai aur ek horizontal resistance line ko touch karta hai. Is pattern ke andar price higher highs aur higher lows banata hai, lekin ye ek narrow range mein hota hai. Jab ye pattern complete hota hai, traders expect karte hain ke market mein downward reversal hone ke chances hain.

          Descending Wedge (Ghathte Hue Wedge):

          Descending wedge pattern ek bearish reversal pattern hai jo market mein bullish trend ke baad paya jata hai. Is pattern mein price ek slanting trend line ke andar move karta hai aur ek horizontal support line ko touch karta hai. Is pattern ke andar price lower highs aur lower lows banata hai, lekin ye ek narrow range mein hota hai. Jab ye pattern complete hota hai, traders expect karte hain ke market mein upward reversal hone ke chances hain.

          Wedge pattern ka istemal karte waqt traders ko dhyan rakhna chahiye ke is pattern ke success par trading volume ka bhi asar hota hai. Agar volume pattern ke sath badh raha hai, toh ye pattern aur bhi strong hota hai.

          Wedge pattern ke mukhtalif variations hote hain jinme rising wedge, falling wedge, symmetric wedge, aur expanding wedge shamil hain. In variations mein price ka movement aur pattern ka structure alag hota hai, lekin basic idea trend reversal ya continuation ka hi hota hai.

          Wedge pattern ko samajhne ke liye traders ko market ke current trend ko analyze karna hota hai. Agar market mein already ek strong trend hai, toh wedge pattern us trend ko continue karne ka indication de sakta hai. Agar market mein sidha-sidha move nahi ho raha hai ya phir trend weak ho gaya hai, toh wedge pattern trend reversal ko indicate kar sakta hai.

          Wedge pattern ka istemal karte waqt ek aur important factor hai time frame. Different time frames par wedge pattern alag dikh sakta hai, aur iske hone par trader ko apne trading strategy ko customize karna chahiye.

          Ek successful trading strategy banane ke liye, traders ko technical analysis ke sath-sath risk management ka bhi dhyan rakhna chahiye. Wedge pattern sirf ek tool hai market movements ko samajhne ka, lekin iska istemal bina proper risk management ke dangerous ho sakta hai.

          Wedge pattern ke alawa bhi market mein kai aur technical patterns aur indicators hote hain jo traders ke liye useful hote hain. Har ek trader ko apne trading style aur risk tolerance ke hisab se sahi tools choose karne chahiye.

          To conclude, wedge pattern ek important technical analysis tool hai jo traders ko market trends ko identify karne mein madad karta hai. Is pattern ka sahi tarah se istemal karke, traders apne trading decisions ko improve kar sakte hain. Lekin, har ek technical tool ki tarah, wedge pattern ka bhi istemal careful analysis aur risk management ke sath karna chahiye.


          • #6 Collapse

            What is Wedge Chart Pattern in Forex?

            Assalam alaikum Dear friends and forex members Wedge Chart Pattern traders ko market me hony waly possible trend reversals ke bare me agah karta hy. Jab yeh pattern ban jata hy, to traders ko samajh aata hy ke market me volatility badhne wala hy. Agar Rising Wedge ban raha hy toh yeh ishara kar sakta hy ke bullish trend khatam hony wala hy aur bearish trend shuru hony wala hy. Wahi agar Falling Wedge ban raha hy toh yeh ishara kar sakta hy ke bearish trend khatam hony wala hy aur bullish trend shuru hony wala hy.

            Wedge pattern
            Dear memners wedge pattern ek technical analysis ka part hy or es me 2 coverging trend lines bnti hein market k highs or lows ko mila k. market k highs ya to falling hoty hein ya rising or esy hi lows bhi falling or rising ho skty hein jiski wja se wedge ki 2 types hoti hy.Wedge chart pattern ek strong reversal pattern hota hy jo k technical analysis me use kia jata hy. Ye pattern donu me se 1 ka signal ho skta hy ye to bullish ya bearish laikin dono conditions me es k 3 feature hoty hein. Converging trend linesdeclining volume breakout of the wedge Declining volume ka mtlb hota hy jesy hesy market wedge me agy brhti hy to wedge ka area short hota jata hy jiski wja se trading volume bht km hota hy or market bht km move karti hy. Breakout ka mtlb hota hy market wedge ko tor k es se bhr nkl jati hy kisi bhi side py ho skta hy nechy ya oper.

            Rising Wedge.
            Dear members wedge generally market k trend k opposite bnta hy mtlb k agr market downtrend me hy to us me rising wedge ho ga or aksr break out wedge ki direction se opposite hota hy mtlb k agr rising wedge hy to breakout lower line se ho ga r market sell me jygi. Rising wedge tb bnta hy jb market higher highs ya or higher lows bnati hy or 2 converging lines banti hein in highs or lows ko mila k. or market ka volume down hota jata hy jesy jesy market move kari hy wedge me.

            Falling Wedge.
            Dear members falling wedge tb banta hy jb market lower highs or lower lows estrha se bnati hy k lows or highs ko mila k 2 converging line banti hein. jesy jes market wedge me move karti hy trading volume km hota jata hy or wedge ka area bhi. falling wedge ka breakout generally upper trend line se hota hy laikin phr bhi apko market ko dehan se dkhna chahiye kyun k bahz oqat wedge ka breakout kisi bhi direction me ho skta hy.

            Trading with wedge Pattern
            Wedge ko trade karny k liye apko es k breakout ka wait karna hota hy jb ap dekhen breakout ho gia hy to uski confirmation ka wait ka wat karen breakout ki confirmation ye hoti hy k breakout k bad market km se km hourly candle close kary apni support ya resistance se bhr.or phr market apni support ya resistance ko test kary. to jb market test kary to ap usi test py trade ln gy or apka stop loss support ya resistance line ya us se thora neechy ho ga

            • #7 Collapse

              What is Wedge Chart Pattern in Forex?


              Click image for larger version

Name:	download - 2024-01-31T002909.173.png
Views:	75
Size:	2.7 کلوبائٹ
ID:	12818344


              Wedge chart patterns technical analysis mein istemal honay wale patterns hain, jo ke Forex aur doosray maali asar mein aam tor par dekhe jatay hain. Ye patterns do milte julte trendlines se banay jatay hain, jo ke ya to oopar ki taraf ya neeche ki taraf jhuki hoti hain. Isme do mukhtalif qisam ke wedges hote hain: uth rahi wedges aur gir rahi wedges.
              1. Uth Rahi Wedge:
                • Uth rahi wedge mein, dono support aur resistance trendlines oopar ki taraf mudarik hoti hain.
                • Isay yehi samajha jata hai ke mojooda up-trend mein thori rukawat aayi hai, aur isay ummul-tijarat ke palatne ka ek ishara samjha jata hai.
                • Traders aksar isay samajhtay hain ke jab keh nichlay trendline se bahar nikal jata hai, toh yeh ek signal hai ke keemat mazeed girnay ka imkaan hai.
              2. Gir Rahi Wedge:
                • Gir rahi wedge mein, dono support aur resistance trendlines neeche ki taraf jhuki hoti hain.
                • Isay yehi samajha jata hai ke mojooda down-trend mein palatne ka imkaan hai, aur aglay bullish move ka ishara ho sakta hai.
                • Traders aksar isay samajhtay hain ke jab keh oopar ki trendline se bahar nikal jata hai, toh yeh ek signal hai ke keemat mazeed barhne ka imkaan hai.

              Forex Mein Wedge Patterns Par Tijarat Kaise Karein:
              • Entry: Traders aksar isay samajhtay hain ke jab keemat wedge pattern se bahar nikal jata hai, toh position le sakte hain. Jaise ke, uth rahi wedge pattern mein jab keemat neeche ki taraf nikal jati hai, toh short position le sakte hain, ya gir rahi wedge pattern mein jab keemat oopar ki taraf nikal jati hai, toh long position le sakte hain.
              • Stop-Loss: Risk ko control karne ke liye, traders aksar stop-loss order us taraf rakh sakte hain jo ke breakout ke mukhalif hai.
              • Target: Trade ka maqsad aksar wedge ki unchaai ko nap kar tay kiya jata hai aur isey breakout ki taraf muntaqil kiya jata hai. Yeh soorat mein behtar hai ke breakout ke baad keemat kitni door ja sakti hai, isko anjaam dene ke liye use kia jata hai.

              Yeh yaad rakhna zaroori hai ke har wedge pattern badi tezi se keemat mein izafay ko nahi darust karta, aur kabhi-kabhi galat signals bhi aa saktay hain. Traders aksar doosray technical indicators aur analysis ka istemal karte hain taake wedge patterns ke signals ko tasdeeq kar sakein, aur trading ke faislay ko mukammal taur par soch samajh kar lein. Iske ilawa, market ki halat aur doosray factors ko bhi mad-e-nazar rakhna zaroori hai.


              • #8 Collapse

                What is Wedge Chart Pattern in Forex?


                Click image for larger version

Name:	download - 2024-01-31T005145.124.png
Views:	29
Size:	4.4 کلوبائٹ
ID:	12818361


                Wedge Chart Pattern ek technical analysis tool hai jo Forex aur doosre financial markets mein istemal hota hai. Ye pattern market trends ko identify karne mein aur future price movements ko anticipate karne mein madad karta hai. Wedge Chart Pattern ko do tarah ke hote hain: "Rising Wedge" (Uptrend ke baad aane wala) aur "Falling Wedge" (Downtrend ke baad aane wala).

                Wedge Chart Pattern ka tafseeli bayan Roman Urdu mein:
                1. Rising Wedge (Uthte Hue Wedge):
                  • Rising Wedge ek bearish reversal pattern hota hai, jo uptrend ke baad aata hai.
                  • Isme price ek ascending channel mein move karta hai jisme upper trend line aur lower trend line dono slope up kar rahe hote hain.
                  • Price ek narrowing range mein move karta hai, jise wedge kehte hain.
                2. Falling Wedge (Girte Hue Wedge):
                  • Falling Wedge ek bullish reversal pattern hota hai, jo downtrend ke baad aata hai.
                  • Isme price ek descending channel mein move karta hai jisme upper trend line aur lower trend line dono slope down kar rahe hote hain.
                  • Price ek narrowing range mein move karta hai, jise wedge kehte hain.
                3. Breakout:
                  • Wedge pattern ke significant aspect hai uski breakout. Breakout hota hai jab price wedge ke andar se bahar nikalta hai.
                  • Rising Wedge ka breakout neeche hota hai aur Falling Wedge ka breakout upar hota hai.
                4. Volume:
                  • Breakout ke time par volume ka bhi analysis important hai. Agar breakout high volume ke sath hota hai, toh uski credibility zyada hoti hai.
                5. Market Sentiment:
                  • Rising Wedge bearish sentiment ko represent karta hai, jabki Falling Wedge bullish sentiment ko indicate karta hai.
                  • Ye patterns trend reversal ko suggest karte hain.
                6. Risk Management:
                  • Trading decisions lene se pehle risk management ka bhi khayal rakhna important hai. Stop-loss orders ka istemal karke traders apne positions ko protect kar sakte hain.

                Wedge Chart Pattern ko samajhna aur sahi tarah se interpret karna technical analysis ke mahir hone ko mangta hai. Is pattern ke saath doosre technical indicators aur tools ka bhi istemal hota hai trading decisions lene mein.
                • #9 Collapse

                  What is Wedge Chart Pattern in Forex?


                  Click image for larger version

Name:	download - 2024-01-31T010243.602.png
Views:	29
Size:	4.4 کلوبائٹ
ID:	12818366


                  Wedge chart pattern ek technical analysis concept hai, jo ke forex market mein trend reversal ya trend continuation ko represent karne ke liye istemal hota hai. Wedge pattern ek price consolidation phase ko indicate karta hai, jisme price ek narrowing range ke andar move karta hai. Is pattern ko do main types mein divide kiya jata hai: rising wedge aur falling wedge.
                  1. Rising Wedge:
                    • Formation: Rising wedge pattern jab market mein uptrend ke doran banta hai. Isme price higher highs aur higher lows banata hai, lekin ye ek narrowing range ke andar hota hai.
                    • Significance: Rising wedge ko dekhte hue traders expect karte hain ki market mein reversal hone ke chances hote hain. Yeh pattern bearish reversal ko indicate karta hai. Agar price ne rising wedge ko break kar liya, toh ye downtrend ka sign ho sakta hai.
                  2. Falling Wedge:
                    • Formation: Falling wedge pattern market mein downtrend ke doran banta hai. Isme price lower highs aur lower lows banata hai, lekin ye bhi ek narrowing range ke andar hota hai.
                    • Significance: Falling wedge ko dekhte hue traders expect karte hain ki market mein reversal hone ke chances hote hain. Yeh pattern bullish reversal ko indicate karta hai. Agar price ne falling wedge ko break kar liya, toh ye uptrend ka sign ho sakta hai.

                  Wedge pattern ka ek important aspect ye hai ki price consolidation ke doran market mein volatility kam hoti hai, lekin jab price wedge ko break karta hai, toh sudden movement dekha ja sakta hai. Traders is pattern ko price ke future direction ko anticipate karne ke liye use karte hain.

                  Hamesha yaad rahe ki, technical analysis ke patterns ko confirm karne ke liye aur sahi trading decisions lene ke liye, aapko dusre technical indicators aur market conditions ko bhi madde nazar rakhna chahiye. Trading mein risk management ka bhi bohot ahem role hota hai.


                  • #10 Collapse

                    **Wedge Pattern: Forex Trading Mein Iska Kya Role Hai?**
                    Forex trading mein "Wedge Pattern" ek important technical analysis tool hai jo market ke potential reversals aur trend changes ko identify karne mein madad karta hai. Ye pattern price action ke behavior ko dekh kar market ke future movements ko predict karne mein help karta hai. Is post mein hum Wedge Pattern ko detail se samjhenge aur dekhenge ke isko forex trading mein kaise effectively use kiya ja sakta hai.

                    ### Wedge Pattern Ki Pehchaan

                    Wedge Pattern ko identify karna aur samajhna kaafi straightforward hai. Ye pattern do main types mein hota hai: Rising Wedge aur Falling Wedge.

                    1. **Rising Wedge**:
                    - **Structure**: Rising Wedge pattern tab form hota hai jab price higher highs aur higher lows create karti hai, lekin wedge ke boundaries ke andar price ke movement ka slope gradually narrow hota hai.
                    - **Trend Reversal**: Rising Wedge pattern bearish trend reversal ko indicate karta hai. Ye pattern typically uptrend ke dauran form hota hai aur iska breakout lower side se hota hai.

                    2. **Falling Wedge**:
                    - **Structure**: Falling Wedge pattern tab form hota hai jab price lower lows aur lower highs create karti hai, lekin wedge ke boundaries ke andar price ka slope gradually narrow hota hai.
                    - **Trend Reversal**: Falling Wedge pattern bullish trend reversal ko indicate karta hai. Ye pattern generally downtrend ke dauran form hota hai aur iska breakout upper side se hota hai.

                    ### Wedge Pattern Ka Significance

                    1. **Trend Reversal**: Wedge Pattern trend reversal ke signals provide karta hai. Rising Wedge bearish reversal ko aur Falling Wedge bullish reversal ko signal karta hai. Jab pattern complete hota hai aur breakout hota hai, to market me potential reversal ko confirm kiya jata hai.

                    2. **Breakout Confirmation**: Wedge Pattern ka breakout point pattern ke completion ke baad hota hai. Rising Wedge ke case mein breakout lower boundary se hota hai aur Falling Wedge ke case mein upper boundary se. Breakout ke baad price movement ko trend reversal ke signals ko validate karne ke liye use kiya jata hai.

                    ### How to Trade Using Wedge Pattern?

                    1. **Pattern Identification**: Chart par Wedge Pattern ko identify karein. Rising Wedge aur Falling Wedge ko dekh kar pattern ki boundaries aur slope ko analyze karein.

                    2. **Breakout Confirmation**: Pattern ke boundaries se breakout ka wait karein. Rising Wedge ke case mein price ke lower side se breakout hone par selling opportunity consider karein. Falling Wedge ke case mein upper side se breakout hone par buying opportunity consider karein.

                    3. **Entry Point**: Breakout ke baad apni trading position enter karein. Trading position ko breakout point ke close karein aur stop loss aur take profit levels ko set karein.

                    4. **Stop Loss Aur Take Profit**: Apni trades ko secure rakhne ke liye stop loss aur take profit levels ko set karein. Stop loss ko pattern ke opposite boundary ke bahar place karein aur profit targets ko recent support ya resistance levels ke mutabiq set karein.

                    ### Example

                    Agar ek currency pair $1.2000 se $1.2500 tak rise karti hai aur Rising Wedge pattern form hota hai, aur price $1.2400 se lower boundary ko breakout karti hai, to yeh bearish signal ho sakta hai aur selling opportunity ko indicate karta hai.

                    ### Conclusion

                    Wedge Pattern forex trading mein market ke potential reversals aur trend changes ko accurately forecast karne ka ek useful tool hai. Is pattern ko sahi tarike se identify karne aur breakout signals ko use karke aap effective trading decisions le sakte hain. Proper analysis aur risk management ke saath, Wedge Pattern aapki trading strategy ko enhance karne mein madadgar sabit ho sakta hai.
                     
                    • <a href="https://www.instaforex.org/ru/?x=ruforum">InstaForex</a>
                    • #11 Collapse

                      **Wedge Pattern: Forex Trading Mein Iska Kya Role Hai?**
                      Forex trading mein "Wedge Pattern" ek important technical analysis tool hai jo market ke potential reversals aur trend changes ko identify karne mein madad karta hai. Wedge Pattern market ke price movements ko dekh kar trend ke continuation ya reversal ko forecast karne mein help karta hai. Is post mein hum Wedge Pattern ko detail se samjhenge aur dekhenge ke isko forex trading mein kaise effectively use kiya ja sakta hai.

                      ### Wedge Pattern Ki Pehchaan

                      Wedge Pattern do main types mein hota hai: Rising Wedge aur Falling Wedge. Dono patterns ke structure aur significance alag hote hain.

                      1. **Rising Wedge**:
                      - **Structure**: Rising Wedge tab form hota hai jab price higher highs aur higher lows create karti hai lekin wedge ke boundaries ke andar price movement ka slope gradually narrow hota hai. Iska matlab hai ke market ka momentum decreasing ho raha hai.
                      - **Trend Reversal**: Rising Wedge pattern typically uptrend ke dauran form hota hai aur bearish reversal ko indicate karta hai. Jab price wedge ki upper boundary ko breakout karti hai, to bearish movement shuru hoti hai.

                      2. **Falling Wedge**:
                      - **Structure**: Falling Wedge tab form hota hai jab price lower lows aur lower highs create karti hai, lekin wedge ke boundaries ke andar price ka slope gradually narrow hota hai. Iska matlab hai ke market ke selling pressure me reduction ho raha hai.
                      - **Trend Reversal**: Falling Wedge pattern downtrend ke dauran form hota hai aur bullish reversal ko indicate karta hai. Jab price wedge ki lower boundary ko breakout karti hai, to bullish movement shuru hoti hai.

                      ### Wedge Pattern Ka Significance

                      1. **Trend Reversal**: Wedge Pattern trend reversal ko signal karta hai. Rising Wedge bearish reversal aur Falling Wedge bullish reversal ke signals provide karta hai. Jab pattern complete hota hai aur breakout hota hai, to market me trend reversal ka confirmation hota hai.

                      2. **Breakout Confirmation**: Wedge Pattern ka breakout point pattern ke completion ke baad hota hai. Rising Wedge ke case mein price ke upper boundary se breakout hone par bearish signal hota hai aur Falling Wedge ke case mein lower boundary se breakout hone par bullish signal hota hai.

                      ### How to Trade Using Wedge Pattern?

                      1. **Pattern Identification**: Chart par Wedge Pattern ko identify karein. Rising Wedge aur Falling Wedge ke structure ko dekh kar pattern ki boundaries aur slope ko analyze karein.

                      2. **Breakout Confirmation**: Pattern ke boundaries se breakout ka wait karein. Rising Wedge ke case mein price ke upper side se breakout hone par selling opportunity consider karein. Falling Wedge ke case mein lower side se breakout hone par buying opportunity consider karein.

                      3. **Entry Point**: Breakout ke baad trading position enter karein. Entry point ko breakout ke close rakhein aur stop loss aur take profit levels set karein.

                      4. **Stop Loss Aur Take Profit**: Apni trades ko secure rakhne ke liye stop loss aur take profit levels ko set karein. Stop loss ko pattern ke opposite boundary ke bahar place karein aur profit targets ko recent support ya resistance levels ke mutabiq set karein.

                      ### Example

                      Agar ek currency pair $1.2000 se $1.2500 tak rise karti hai aur Rising Wedge pattern form hota hai, aur price $1.2400 se upper boundary ko breakout karti hai, to yeh bearish signal ho sakta hai aur selling opportunity ko indicate karta hai.

                      ### Conclusion

                      Wedge Pattern forex trading mein market ke potential reversals aur trend changes ko accurately forecast karne ka ek useful tool hai. Is pattern ko sahi tarike se identify karne aur breakout signals ko use karke aap effective trading decisions le sakte hain. Proper analysis aur risk management ke saath, Wedge Pattern aapki trading strategy ko enhance karne mein madadgar sabit ho sakta hai.
                       

                      اب آن لائن

                      Working...
                      X