Assalamualaikum!
Dear Friend umeed krta hon k ap sab kheriat sy hon gy our forex market mn acha kam kr rhe hon gy dosto aj ka hmara topic bhot he important h aj hm average true range indicator k bary mn discuss krien gy k ye indicator Kya hota h our is ko market mn kasy use krty hn aj main apko is k bary mn tafseel sy btaun ga.
Average True Range Indicator:
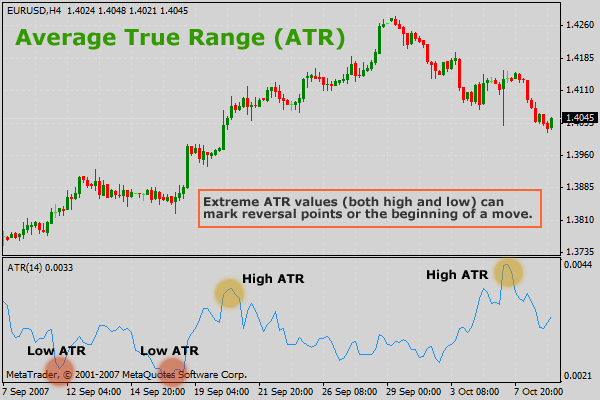
Average True Range (ATR) ek technical analysis indicator hai jo market volatility ko measure karne ke liye istemal hota hai. Ye indicator traders ko market ke expected price movement ka estimate dene mein madad karta hai. ATR ki calculation price ke daily fluctuations par mabni hoti hai.

Calculation:
ATR ka calculation daily price range par based hota hai, jo high se low tak ka difference hota hai. Isme kuch steps hote hain:
True Range (TR) Calculation:
True Range, current day ka high aur low ke beech ka maximum value hota hai, ismein previous day ka closing price bhi shamil hota hai. Formula:
TR=max(High - Low,|High - Previous Close|,|Low - Previous Close|)
Average True Range (ATR) Calculation:
ATR ko calculate karne ke liye, ek specified period ke TR ka average liya jata hai. Ye period usually 14 days ka hota hai, lekin traders ise apne requirements ke mutabiq adjust kar sakte hain.
ATR=Sum of TR for specified period/N
Yahan N specified period ko represent karta hai.
Interpretation:
Volatility Measurement:
ATR market ki volatility ko measure karta hai. Higher ATR values indicate higher volatility and vice versa. Traders use ATR to gauge how much a market typically moves in a given time frame.
Stop Loss Placement:
ATR istemal hota hai stop loss orders set karne mein. Agar market zyada volatile hai, to stop loss wider set kiya ja sakta hai taaki normal fluctuations se bacha ja sake.
Trend Confirmation:
ATR ka istemal trend confirmation mein bhi hota hai. Agar ATR ki values badh rahi hain, toh ye indicate kar sakta hai ke trend strong hai.
Entry and Exit Points:
Traders ATR ka istemal entry aur exit points decide karne mein bhi karte hain. Agar ATR kam hai, toh market mein stability hone ke chances zyada hote hain.
Example:
Agar ek stock ka ATR 2.5 hai, toh iska matlab hai ke is stock ka average daily price movement 2.5 points hai. Agar current stock price $50 hai, toh traders expect karenge ke next day tak price $47.5 se $52.5 ke beech mein ho sakta hai, based on ATR.
ATR aur Dusre Indicators:
ATR ko dusre indicators ke saath combine karke bhi use kiya jata hai. For example, agar koi trader moving averages ke saath ATR use karta hai, toh wo trend ke strength ko aur behtar taur par samajh sakta hai.
Average True Range ki Limitations:
Lagging Indicator:
ATR lagging nature ka indicator hai, yani ke iska effect current market conditions ko accurately reflect nahi karta hai.
No Directional Information:
ATR sirf volatility ko measure karta hai, isme market ka direction ya trend ka pata nahi chalta.
Adaptability:
ATR ka period adjust karna zaroori hota hai market conditions ke hisaab se, lekin ye har situation mein accurate nahi rehta.

Conclusion:
Average True Range ek useful tool hai jo traders ko market volatility ko samajhne aur manage karne mein madad karta hai. Iska istemal stop loss placement, trend confirmation, aur entry/exit points decide karne mein hota hai. Hamesha yaad rakhein ke ATR ek piece of information hai jo dusre indicators ke saath mila kar istemal karna chahiye, aur iski limitations ko bhi samajhna important hai.
Thanks for Attention
Dear Friend umeed krta hon k ap sab kheriat sy hon gy our forex market mn acha kam kr rhe hon gy dosto aj ka hmara topic bhot he important h aj hm average true range indicator k bary mn discuss krien gy k ye indicator Kya hota h our is ko market mn kasy use krty hn aj main apko is k bary mn tafseel sy btaun ga.
Average True Range Indicator:
Average True Range (ATR) ek technical analysis indicator hai jo market volatility ko measure karne ke liye istemal hota hai. Ye indicator traders ko market ke expected price movement ka estimate dene mein madad karta hai. ATR ki calculation price ke daily fluctuations par mabni hoti hai.
Calculation:
ATR ka calculation daily price range par based hota hai, jo high se low tak ka difference hota hai. Isme kuch steps hote hain:
True Range (TR) Calculation:
True Range, current day ka high aur low ke beech ka maximum value hota hai, ismein previous day ka closing price bhi shamil hota hai. Formula:
TR=max(High - Low,|High - Previous Close|,|Low - Previous Close|)
Average True Range (ATR) Calculation:
ATR ko calculate karne ke liye, ek specified period ke TR ka average liya jata hai. Ye period usually 14 days ka hota hai, lekin traders ise apne requirements ke mutabiq adjust kar sakte hain.
ATR=Sum of TR for specified period/N
Yahan N specified period ko represent karta hai.
Interpretation:
Volatility Measurement:
ATR market ki volatility ko measure karta hai. Higher ATR values indicate higher volatility and vice versa. Traders use ATR to gauge how much a market typically moves in a given time frame.
Stop Loss Placement:
ATR istemal hota hai stop loss orders set karne mein. Agar market zyada volatile hai, to stop loss wider set kiya ja sakta hai taaki normal fluctuations se bacha ja sake.
Trend Confirmation:
ATR ka istemal trend confirmation mein bhi hota hai. Agar ATR ki values badh rahi hain, toh ye indicate kar sakta hai ke trend strong hai.
Entry and Exit Points:
Traders ATR ka istemal entry aur exit points decide karne mein bhi karte hain. Agar ATR kam hai, toh market mein stability hone ke chances zyada hote hain.
Example:
Agar ek stock ka ATR 2.5 hai, toh iska matlab hai ke is stock ka average daily price movement 2.5 points hai. Agar current stock price $50 hai, toh traders expect karenge ke next day tak price $47.5 se $52.5 ke beech mein ho sakta hai, based on ATR.
ATR aur Dusre Indicators:
ATR ko dusre indicators ke saath combine karke bhi use kiya jata hai. For example, agar koi trader moving averages ke saath ATR use karta hai, toh wo trend ke strength ko aur behtar taur par samajh sakta hai.
Average True Range ki Limitations:
Lagging Indicator:
ATR lagging nature ka indicator hai, yani ke iska effect current market conditions ko accurately reflect nahi karta hai.
No Directional Information:
ATR sirf volatility ko measure karta hai, isme market ka direction ya trend ka pata nahi chalta.
Adaptability:
ATR ka period adjust karna zaroori hota hai market conditions ke hisaab se, lekin ye har situation mein accurate nahi rehta.
Conclusion:
Average True Range ek useful tool hai jo traders ko market volatility ko samajhne aur manage karne mein madad karta hai. Iska istemal stop loss placement, trend confirmation, aur entry/exit points decide karne mein hota hai. Hamesha yaad rakhein ke ATR ek piece of information hai jo dusre indicators ke saath mila kar istemal karna chahiye, aur iski limitations ko bhi samajhna important hai.
Thanks for Attention


تبصرہ
Расширенный режим Обычный режим