Assalamu Alaikum Dosto!
OHLC Chart Guide
OHLC, jo Open, High, Low, Close ka acronym hai, shuruwat mein anjaane logon ke liye cryptic jargon lag sakta hai, lekin traders ke liye ye ek bunyadi concept hai jo market dynamics ko samajhne ka chabi deta hai. OHLC ka matlab hai Open, High, Low, Close. Ye terms kaafi wazeh hain aur shayad aapko pehle se maloom hain. Open wo price hai jis par kisi asset ka trading day shuru hota hai. For example, agar aap Apple stock trade kar rahe hain, to open price batati hai ke trading day ki shuruwat me uski keemat kahan se shuru hui. Ye price uss samay ke asset ki supply aur demand ke mutabiq tay hoti hai.
High wo highest price level hai jo asset ne trading day ke doran touch kiya ho. For example, agar Apple ne din ko $100 par shuru kiya, phir $120 tak pahuncha aur phir girne laga, to us din ka high $120 hoga. Low wo lowest price point hai jo trading day ke doran touch hua. Aakhir mein, Close wo final price hai jis par asset ko din ke liye trade kiya gaya hai. Japanese candlesticks aur bar charts jaise mashhoor OHLC charts hain.
Line chart OHLC chart nahi hota kyun ke ye sirf kisi asset ki closing price ko dikhata hai. Isi tarah, point and figure charts, Kagi charts, aur renko charts bhi OHLC category mein nahi aate, kyun ke inme aksar time-based noise ko filter out kiya jata hai.
Forex Aur US OHLC Data Ke Difficulties
Jabke ye concepts seedhe lag sakte hain, lekin kuch complexities bhi hain. Forex market mein do opening aur closing prices hoti hain: ek open price jab market Monday ko shuru hoti hai aur doosri close price jab wo Friday ko weekend ke liye band hoti hai. Challenge tab paida hota hai jab forex market 24 ghante chalti hai, jiski wajah se exact open aur close prices ko nikaalna mushkil ho jata hai. Ek aur masla ye hai ke jab US-listed companies ke shares dekhe jaate hain to extended-hours trading ki wajah se bhi issue aata hai. Extended hours pre-market aur after-market trading ko shamil karte hain, jo market band hone ke baad aur uske khulne se pehle hota hai.
Traders Ke Liye OHLC Charts Ki Ahmiyat:
Traders ke liye OHLC prices ko samajhna crucial hai kyun ke ye asset ki daily trading range mein insights provide karte hain. Ye range market ki volatility ka level batane mein madad karti hai. For example, agar Apple ka open price $100 hai, high $101 hai, low $99.5 hai, aur close $100 hai, to ye dikhata hai ke stock mein kam volatility hai. Umge, agar open $100 hai, high $110 tak pahunchta hai, low $95 tak gir jata hai, aur close $115 hai, to ye dikhata hai ke company ke stock mein zyada volatility hai. Traders ke paas low ya high volatility ke doran trading karne ka apna tajaweez hota hai.
Ye teeno prices points bhi zaroori hote hain jab aap assets par indicators apply karte hain. Aksar indicators aapse ye poochenge ke aap kaunsa price istemal karna chahte hain. Jaise ke zyadatar traders closing prices istemal karte hain, kuch open prices ko bhi prefer karte hain.
OHLC Chart Explaination
OHLC chart ek classic aur versatile tool hai, jo traders ko ek jhalak mein malumat ka ek ameer tapestry deta hai. Chaliye iske seemingly cryptic abbreviation ke peeche chhupi meanings ko samajhte hain:
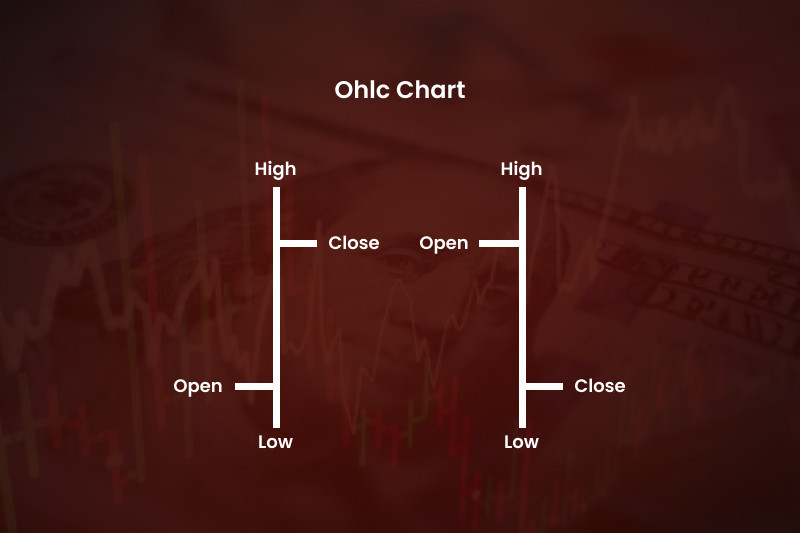
- O: Open - Ye point security ki pehli recorded price ko mark karta hai specified timeframe ke andar, chahe wo minute ho, hour ho, day ho, ya week. Isay aise samjhein jaise ki din ke market performance ka curtain uth raha hai.
- H: High - Ye timeframe ke andar pahunchi gayi highest price ko indicate karta hai. Isay aise sochein jaise ki ye din ke price action ka summit hai, market ka wo peak jahan se wo shayad neeche ja sake.
- L: Low - Ye price ko represent karta hai jo timeframe ke andar touch kiya gaya lowest point hai. Isay aise sochein jaise ki ye wo valley hai, wo dark dip jahan se ek possible rebound ho sakta hai.
- C: Close - Ye timeframe khatam hone se pehle record ki gayi final price ko signify karta hai. Isay aise samjhein jaise ki ye din ke drama ka curtain ho raha hai, ek naya chapter shuru hone se pehle ka antim point.
Ab, sochiye in chaar values ko ek grid par nachte hue, jise waqt ke khilaaf plot kiya gaya hai horizontal axis par. Vertical axis price range ko display karta hai. Jo resulting "candle" nikalta hai, wo din ke market ki kahani ko embody karta hai:
- The body: Open aur close prices ke beech ka colored rectangle aapko trend ki direction batata hai. A filled (green) body ek rise ko indicate karta hai open se close tak, jabki ek hollow (red) body ek fall ko signify karta hai.
- The wicks: Body ke upar aur niche extend hone wali patli lines high aur low points ko represent karte hain. Lambi wicks zyada price volatility ko suggest karte hain, jabki chhoti wicks tight price movement ko indicate karti hain.
- The pattern: Candles ke clusters recognizable patterns banate hain, jaise head and shoulders ya double bottom, jo potential future price movements ke baare mein hints dete hain.
OHLC charts sirf static displays nahi hain; ye traders ke liye ek dynamic visual language offer karte hain taki woh:
- Assess kar sakein market sentiment: Candles ke color aur position jaldi se reveal karte hain ke timeframe ke doran buyers ya sellers dominate kar rahe hain.
- Gauge kar sakein volatility: Wicks ki lambai aur candles ke beech ki spacing price fluctuation ke baare mein insights deti hai.
- Identify kar sakein potential trends: Candle patterns aur body sizes ko analyze karke traders developing trends ko spot kar sakte hain aur informed trading decisions le sakte hain.
- Track kar sakein price history: OHLC candles ki evolution ko samajhne se traders historical price movements aur potential support aur resistance levels ko understand kar sakte hain.
Jabki OHLC charts powerful tools hain, yaad rakhein ki ye crystal balls nahi hain. Inhe dusre technical aur fundamental analysis techniques ke saath combine karein, candle patterns ko interpret karne mein practice karein, aur market ko confidence ke saath navigate karne ke liye risk management ko priority dein taki aap informed trading decisions le sakein.
OHLC Charts Ko Interpret Aur Apply Kaise Karein
OHLC charts ko samajhna aur istemal karna seedha hai, khaas karke Japanese candlesticks istemal karte waqt, jo ke sabse mashhoor charting method hain. Japanese candlesticks OHLC data ko effectively apne structure mein encapsulate karte hain, jo inhe user-friendly banata hai.
OHLC data ko platforms jaise MT4 par access karne ke liye, aap easily ise enable kar sakte hain chart properties mein ja kar aur "Show Open-High-Low-Close" ko select karke. Ye in crucial price points ko chart ke top par dikhayega. Ya to aap marketplace mein plugins ya add-ons dhoondh sakte hain jo ye information provide karte hain. Iske alawa, aap OHLC volume aur histogram data ko apni analysis mein shaamil kar sakte hain. Ye teeno tools market movements ke bare mein valuable insights provide karte hain, jisme OHLC data chart par pink color mein highlight hota hai.
OHLC Trading Strategies
OHLC bar charts ke liye kai day trading strategies hain, jo broadly do main approaches mein categorize ki ja sakti hain: technical analysis aur price action analysis.
- Technical Analysis:
Ye strategy chart patterns ka istemal karti hai aur inhe mathematical indicators ke saath combine karke inform trading decisions banati hai. Kuch mashhoor technical indicators OHLC chart analysis ke liye hain:- Average True Range (ATR): Market volatility ko measure karta hai.
- Average Directional Movement Index (ADX): Trend ki strength ko identify karta hai.
- Relative Strength Index (RSI): Overbought ya oversold conditions ko gauge karta hai.
- Price Action Analysis:
Ye approach chart patterns ko scrutinize karke trading decisions banane ke liye istemal hota hai. Common price patterns mein include hain:- Bullish aur Bearish Flags: Temporary consolidation ko indicate karte hain before a potential breakout.
- Bullish aur Bearish Pennants: Flags ki tarah, ye patterns suggest karte hain ke price mein ek pause ho raha hai before a potential move.
- Triangle Patterns: Ascending, descending, ya symmetrical triangles jo potential breakouts ya breakdowns ko signal karte hain.
In strategies aur tools ko shaamil karke, traders OHLC charts ke saath achhe decisions le sakte hain, apni ability ko enhance kar sakte hain ke market opportunities ko capitalize karne mein.
Conclusion
OHLC charts sirf ek graph par chaar data points nahi hain; ye hain financial markets ke complex world mein khidkiyan. Jaise ke humne dekha, ye asset ki daily trading range aur market volatility mein vital insights provide karte hain, jo traders ke liye indispensable tools banate hain. Chahe aap technical analyst hon ya price action approach prefer karte hon, OHLC charts aapke trading decisions ko inform karne ke liye bohot saari malumat offer karte hain. OHLC data ko interpret aur apply karne ki mastery hasil karke, aap apni financial markets mein navigate karne aur opportunities ko pakadne ki ability ko enhance kar sakte hain. Toh, yaad rakhein ye chaar akshar - O, H, L, C - aur inhe aapki trading journey mein guide hone dein.

تبصرہ
Расширенный режим Обычный режим