Butterfly candlestick chart patterns kai hai

No announcement yet.
`
X
  • وقت
  • دکھائیں
Clear All
new posts
  • #1 Collapse

    Butterfly candlestick chart patterns kai hai
    Butterfly candlestick chart patterns kai hai

    Click image for larger version

Name:	download (29).png
Views:	74
Size:	8.5 کلوبائٹ
ID:	12806820


    Butterfly pattern typically refers to a specific harmonic pattern in technical analysis rather than a candlestick pattern. The Butterfly pattern is a part of the broader field of harmonic trading, which involves using specific price relationships between highs and lows to identify potential reversal zones in the market.

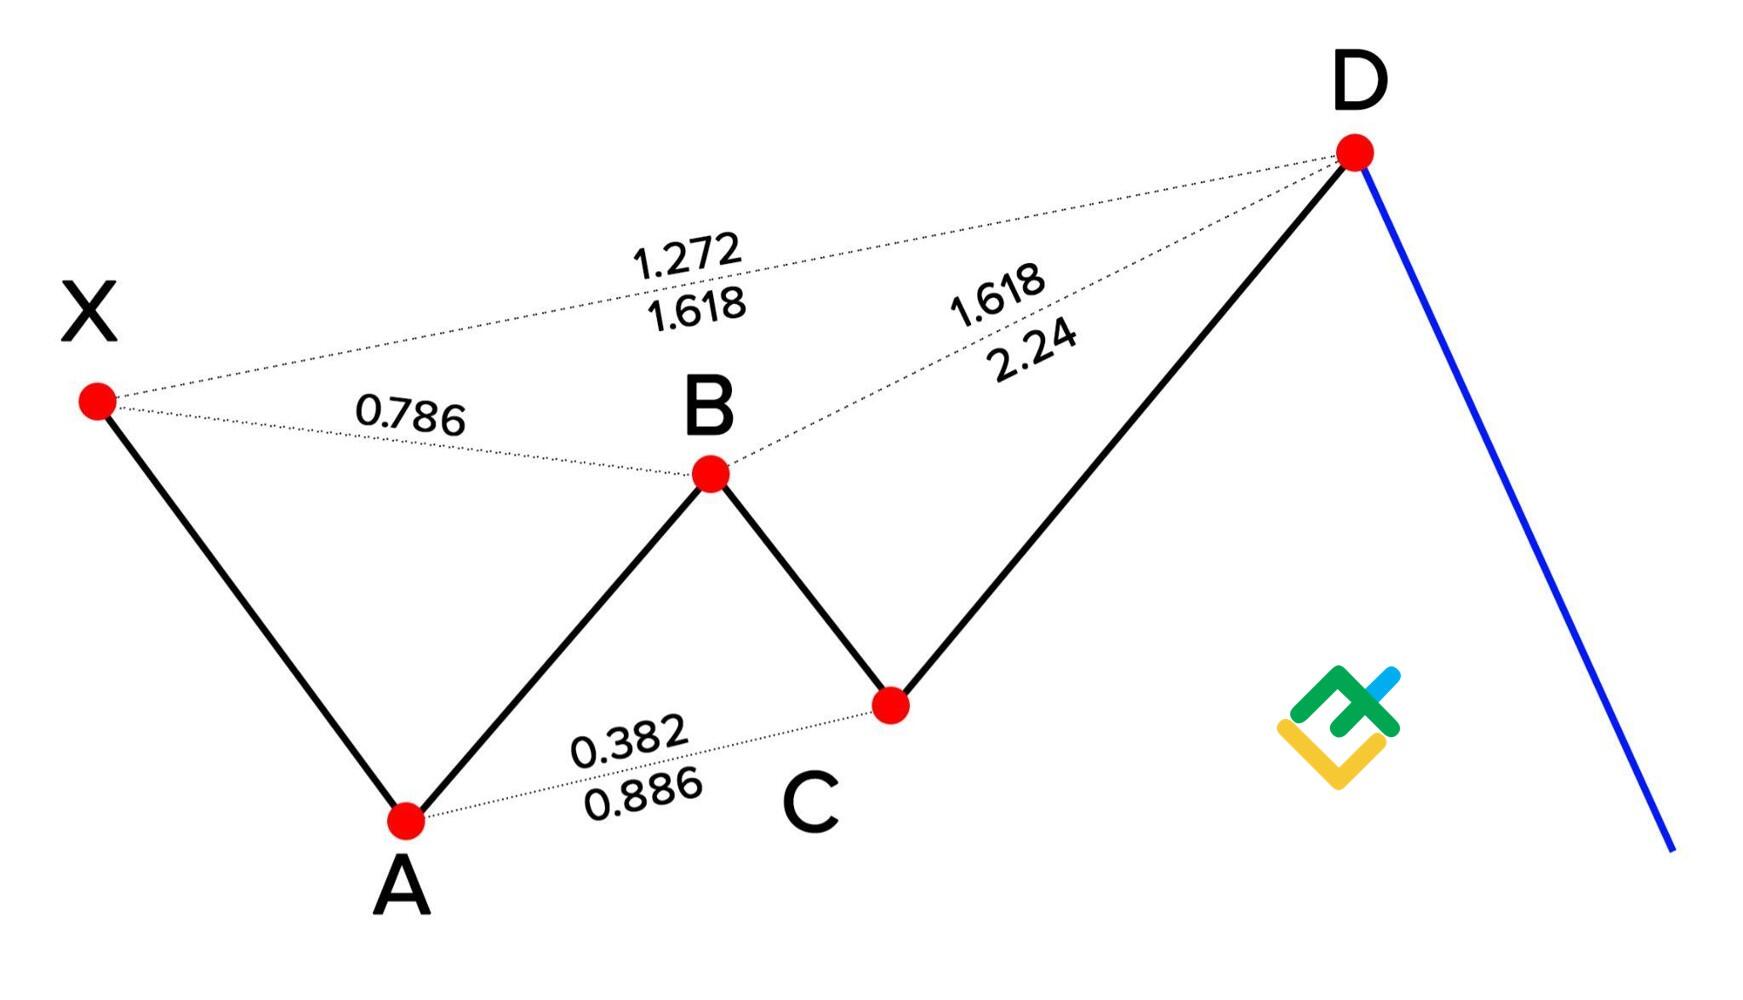
    The Butterfly pattern is characterized by the following key points:
    1. Swing Points:
      • The pattern consists of four distinct price swings or points labeled X, A, B, and C.
    2. Fibonacci Ratios:
      • The Butterfly pattern relies on Fibonacci ratios to define the relationships between these points. Specifically, the pattern involves the following ratios:
        • AB leg retraces 78.6% of the XA leg.
        • BC leg extends to 127.2% or 161.8% of the AB leg.
        • CD leg retraces 78.6% of the BC leg.
    3. Completion Point (D):
      • The completion point of the pattern is at point D. This is where the CD leg completes its retracement, and it often coincides with the 127.2% or 161.8% Fibonacci extension level.
    4. Potential Reversal Zone:
      • The area around the completion point D is considered the Potential Reversal Zone (PRZ). Traders look for additional technical confluence factors, such as support/resistance levels or other chart patterns, to strengthen the likelihood of a reversal.

    Here's a simplified breakdown:
    • XA Leg: Initial swing from X to A.
    • AB Leg: Correction of XA by 78.6%.
    • BC Leg: Extension of AB by 127.2% or 161.8%.
    • CD Leg: Correction of BC by 78.6%, completing at the 127.2% or 161.8% extension of XA.

    It's important to note that harmonic patterns, including the Butterfly pattern, require careful analysis and may not always unfold exactly as expected. Traders often use them in conjunction with other technical analysis tools and consider broader market conditions for confirmation. Additionally, these patterns are subjective, and different traders may have slightly different interpretations. Always practice good risk management when using any trading strategy or pattern.
     
  • <a href="https://www.instaforex.org/ru/?x=ruforum">InstaForex</a>
  • #2 Collapse

    Butterfly candlestick chart patterns kai hai

    Click image for larger version

Name:	download (6).jpeg
Views:	72
Size:	12.0 کلوبائٹ
ID:	12807736

    Butterfly Candlestick Pattern ek technical analysis tool hai jo price charts par dekha ja sakta hai. Ye pattern market trends aur potential reversals ko identify karne mein madad karta hai. Butterfly pattern typically harmonic patterns family ka hissa hai. Iska formation Fibonacci ratios ke istemal se hota hai.

    Butterfly Candlestick Pattern Ka Formation (بٹرفلائی کینڈلسٹک پیٹرن کا بناوٹ):
    1. Swing Points:
      • Butterfly pattern ka formation swing points par mabni hota hai, jo market mein significant highs aur lows ko represent karte hain.
    2. Fibonacci Ratios:
      • Pattern Fibonacci ratios, jese ke 0.382, 0.618, 1.27, 1.618, aur 2.618, ke istemal se banaya jata hai. Ye ratios swing points ke beech ke price relationships ko darust karte hain.
    3. ABCD Structure:
      • Butterfly pattern ka foundation ABCD structure par hota hai, jisme BC leg 0.786 Fibonacci retracement level se shuru hoti hai.
    4. Harmonic Relationships:
      • Butterfly pattern mein Fibonacci ratios ke harmonic relationships ki wajah se AB=CD hota hai. Yeh pattern market mein potential reversal ko darust karta hai.
    5. Completion at Point D:
      • Butterfly pattern ka completion point D hota hai, jahan price previous swing leg (BC) ke end (0.786 retracement level) par aakar rukta hai.

    Butterfly Candlestick Pattern Ki Tafsilaat (بٹرفلائی کینڈلسٹک پیٹرن کی تفصیلات):
    • Bullish Butterfly:
      • Bullish Butterfly pattern mein market mein bearish trend ke baad reversal ki possibility hoti hai. Pattern ka completion point D par price upward movement show karta hai.
    • Bearish Butterfly:
      • Bearish Butterfly pattern mein market mein bullish trend ke baad reversal ki possibility hoti hai. Pattern ka completion point D par price downward movement show karta hai.
    • Fibonacci Ratios Importance:
      • Butterfly pattern mein Fibonacci ratios ka istemal harmonic relationships ko darust karne ke liye hota hai. Traders Fibonacci retracement aur extension levels par tawajju dete hain.
    • Trading Strategies:
      • Traders Butterfly pattern ka istemal trend reversal points aur potential entry/exit points ko identify karne mein karte hain. Pattern ke completion ke baad, traders apne trades ko iske mutabiq plan karte hain.

    Ehtiyaat (Precautions):
    • Always confirm Butterfly pattern ke signals doosre technical indicators aur analysis tools ke saath.
    • False signals se bachne ke liye, market conditions aur overall trend ka bhi pura tajziya karein.
    • Risk management strategies ka istemal karein, including stop-loss orders ka placement.

    Butterfly Candlestick Pattern ek advanced technical tool hai, aur iske sahi tajziya aur istemal ke liye traders ko market dynamics aur Fibonacci ratios ki achhi samajh honi chahiye.


    • #3 Collapse

      Butterfly candlestick chart patterns kai hai

      Click image for larger version

Name:	download (9).png
Views:	86
Size:	4.9 کلوبائٹ
ID:	12807767


      Butterfly Candlestick Pattern, aam taur par harmonic patterns ki family mein aane wala ek technical analysis tool hai jo price charts par dekha ja sakta hai. Ye pattern market trends aur potential reversals ko identify karne mein madad karta hai. Butterfly pattern, Fibonacci ratios ke istemal se banta hai.

      Butterfly Candlestick Pattern Ka Formation (بٹرفلائی کینڈلسٹک پیٹرن کا بناوٹ):
      1. Swing Points:
        • Butterfly pattern ka formation swing points par mabni hota hai, jo market mein significant highs aur lows ko represent karte hain.
      2. Fibonacci Ratios:
        • Pattern Fibonacci ratios, jese ke 0.382, 0.618, 1.27, 1.618, aur 2.618, ke istemal se banaya jata hai. Ye ratios swing points ke beech ke price relationships ko darust karte hain.
      3. ABCD Structure:
        • Butterfly pattern ka foundation ABCD structure par hota hai, jisme BC leg 0.786 Fibonacci retracement level se shuru hoti hai.
      4. Harmonic Relationships:
        • Butterfly pattern mein Fibonacci ratios ke harmonic relationships ki wajah se AB=CD hota hai. Yeh pattern market mein potential reversal ko darust karta hai.
      5. Completion at Point D:
        • Butterfly pattern ka completion point D hota hai, jahan price previous swing leg (BC) ke end (0.786 retracement level) par aakar rukta hai.

      Butterfly Candlestick Pattern Ki Tafsilaat (بٹرفلائی کینڈلسٹک پیٹرن کی تفصیلات):
      • Bullish Butterfly:
        • Bullish Butterfly pattern mein market mein bearish trend ke baad reversal ki possibility hoti hai. Pattern ka completion point D par price upward movement show karta hai.
      • Bearish Butterfly:
        • Bearish Butterfly pattern mein market mein bullish trend ke baad reversal ki possibility hoti hai. Pattern ka completion point D par price downward movement show karta hai.
      • Fibonacci Ratios Importance:
        • Butterfly pattern mein Fibonacci ratios ka istemal harmonic relationships ko darust karne ke liye hota hai. Traders Fibonacci retracement aur extension levels par tawajju dete hain.
      • Trading Strategies:
        • Traders Butterfly pattern ka istemal trend reversal points aur potential entry/exit points ko identify karne mein karte hain. Pattern ke completion ke baad, traders apne trades ko iske mutabiq plan karte hain.

      Ehtiyaat (Precautions):
      • Always confirm Butterfly pattern ke signals doosre technical indicators aur analysis tools ke saath.
      • False signals se bachne ke liye, market conditions aur overall trend ka bhi pura tajziya karein.
      • Risk management strategies ka istemal karein, including stop-loss orders ka placement.

      Butterfly Candlestick Pattern ek advanced technical tool hai, aur iske sahi tajziya aur istemal ke liye traders ko market dynamics aur Fibonacci ratios ki achhi samajh honi chahiye.


      • #4 Collapse

        Butterfly candlestick chart patterns kai hai

        Click image for larger version

Name:	download (11).png
Views:	76
Size:	8.9 کلوبائٹ
ID:	12807780

        Butterfly Candlestick Pattern: Tafseelat:

        1. Introduction:
        • Butterfly Candlestick Pattern, ek reversal pattern hai jo market charts par dikhta hai. Ye pattern trend reversal ko indicate karta hai aur price movement ko anticipate karne mein madad karta hai.

        2. Structure:
        • Butterfly Pattern mein kuch specific candlesticks ka arrangement hota hai jo ek butterfly shape ko resemble karta hai.

        3. Formation:
        • First Leg (X to A): Downtrend ke doran pehle leg mein, price downward move karta hai (X se A).
        • Recovery (A to B): Phir se ek certain level tak recovery hoti hai (A se B).
        • Decline (B to C): Fir se price mein decline hota hai (B se C), lekin is decline mein pehle ke low se kam downward move hota hai.
        • Rally (C to D): Phir se ek rally hoti hai (C se D) aur price higher high banata hai, lekin pehle ke high se kam.

        4. Key Components:
        • Fibonacci Levels: Butterfly pattern Fibonacci retracement levels ka use karta hai, jisme XA leg ke retracement ke liye Fibonacci ratios important hote hain.

        5. Trading Strategies:
        • Entry Point: Traders entry typically tab karte hain jab D point cross hota hai aur price mein reversal hone ka indication milta hai.
        • Stop-Loss: Stop-loss orders ko set karna important hai, generally D point ke neeche.
        • Target: Fibonacci extension levels ka istemal karke target ko set kiya jata hai.

        6. Precautions:
        • Fibonacci Accuracy: Butterfly pattern ke liye Fibonacci ratios ka sahi se use karna important hai.
        • Confirmation Signals: Confirmatory signals aur doosre technical indicators ka bhi istemal karna prudent hota hai.

        7. Conclusion:
        • Butterfly Candlestick Pattern, jab sahi taur par identify hota hai aur confirmatory signals ke saath milta hai, toh ye ek potential reversal indicator ho sakta hai. Lekin prudent risk management aur market conditions ka bhi dhyan rakhna important hai. Trading decisions lene se pehle, thorough analysis aur confirmation ke bina, trade na karna chahiye.


        • #5 Collapse

          Butterfly candlestick chart patterns kai hai

          Butterfly Candlestick Pattern, ek reversal pattern hai jo market mein trend change hone ki indication deta hai. Yeh pattern traditional Japanese candlestick patterns mein se ek hai.

          Butterfly Candlestick Pattern Key Characteristics:
          1. Trend Reversal:
            • Butterfly pattern market mein prevailing trend ki reversal ko suggest karta hai. Agar uptrend ho raha hai, to Butterfly pattern downtrend ki shuruwat ko darust karta hai aur vice versa.
          2. Candlestick Arrangement:
            • Butterfly pattern ek specific arrangement of candles par depend karta hai. Ismein kuch consecutive candles ke arrangement se pattern create hota hai.
          3. Symmetry:
            • Butterfly pattern ki ek important feature hai ki iska structure symmetric hota hai, jisse traders ko reversal ki indication milti hai.

          How to Identify Butterfly Candlestick Pattern:
          1. Initial Uptrend or Downtrend:
            • Butterfly pattern ko identify karne ke liye, market mein initial uptrend ya downtrend hone chahiye.
          2. Specific Candlestick Arrangement:
            • Butterfly pattern ke liye kuch specific consecutive candles ka arrangement hota hai. Ye arrangement symmetric hota hai.
          3. Harmonic Trading:
            • Butterfly pattern harmonic trading ka hissa hai, jisme Fibonacci retracement aur extension levels ka istemal hota hai. Butterfly pattern Fibonacci levels ke madhyam se calculate kiya jata hai.
          4. ABCD Structure:
            • Butterfly pattern mein ABCD structure hota hai, jismein A to B leg, B to C leg, aur C to D leg shamil hoti hain. Ye legs Fibonacci levels ke accordance mein hoti hain.

          Trading Strategies with Butterfly Candlestick Pattern:
          1. Entry Point:
            • Traders entry point ke liye Butterfly pattern ke completion (D point) ke baad ka wait karte hain.
          2. Stop-Loss:
            • Stop-loss order ko set karna important hai taki in case of false signal, potential losses minimized ho sakein.
          3. Target:
            • Target levels ko set karna important hai. Fibonacci extension levels ka istemal Butterfly pattern ke target points tay karne mein kiya ja sakta hai.
          4. Confirmation with Other Indicators:
            • Butterfly pattern ko confirm karne ke liye, traders doosre technical indicators aur price action analysis ka bhi istemal karte hain.

          Mashwara:
          • Butterfly pattern ka istemal karne se pehle, aapko iske characteristics, identification, aur trading strategies ko samajhna important hai.
          • Risk management principles ko follow karna crucial hai har trade mein.
          • #6 Collapse

            Butterfly candlestick chart patterns:Butterfly Candlestick Pattern, aam taur par harmonic patterns ki family mein aane wala ek technical analysis tool hai jo price charts par dekha ja sakta hai. Ye pattern market trends aur potential reversals ko identify karne mein madad karta hai. Butterfly pattern, Fibonacci ratios ke istemal se banta hai.Butterfly pattern ke signals doosre technical indicators aur analysis tools ke saath.Ye pattern trend reversal ko indicate karta hai aur price movement ko anticipate karne mein madad karta haButterfly Candlestick Pattern ek advanced technical tool hai, aur iske sahi tajziya aur istemal ke liye traders ko market dynamics aur Fibonacci ratios ki achhi samajh honi chahiye.Strategies.Butterfly pattern ka istemal trend reversal points aur potential entry/exit points ko identify karne mein karte hain. Pattern ke completion ke baad, traders apne trades ko iske mutabiq plan karte hain. confirm Butterfly pattern ke signals doosre technical indicators aur analysis tools ke saath. pattern mein Fibonacci ratios ka istemal harmonic relationships ko darust karne ke liye hota hai. Traders Fibonacci retracement aur extension levels par tawajju dete pattern market mein prevailing trend ki reversal ko suggest karta hai. Agar uptrend ho raha hai, to Butterfly pattern downtrend ki shuruwat ko darust Butterfly Candlestick Pattern ek advanced technical tool hai, aur iske sahi tajziya aur istemal ke liye traders ko market dynamics aur Fibonacci ratios ki achhi samajh honi chahiye. Importance:

            analysis and may not always unfold exactly as expected. Traders often use them in conjunction with other technical analysis tools and consider broader market conditions for confirmation. Additionally, these patterns are subjective, and different traders may have slightly different interpretations. Always practice good risk management when using any trading strategy or pattern.pattern in technical analysis rather than a candlestick pattern.Conclusion:The Butterfly pattern is a part of the broader field of harmonic trading, which involves using specific price relationships between highs and lows to identify potential reversal zones in the market.Butterfly pattern ka istemal trend reversal points aur potential entry/exit points ko identify karne mein karte hain. Pattern ke completion ke baad, traders apne trades ko iske mutabiq plan karte hain.andlestick pattern. The Butterfly pattern is a part of the broader field of harmonic trading, which involves using specific price relationships between highs and lows to identify potential reversal zones in the market.
            Last edited by ; 15-01-2024, 05:16 PM.
            • #7 Collapse


              Butterfly candlestick chart patterns ko samajhna, technical analysis mein ek ahem hawala hai. Butterfly pattern ek specific tarah ka candlestick arrangement hai jo market ke trend reversal ko darust karnay mein madadgar hota hai. Yeh pattern market ke instability aur uncertainty ko dikhane mein madad karta hai.

              Butterfly pattern ka pehla step hota hai ek bearish trend ke doran ek down-swing (girawat) ka formation. Iske baad, doji candlesticks ya small-bodied candles aati hain jo indicate karte hain ke sellers aur buyers ke darmiyan barabar ka muqabla ho raha hai. Dusra step yeh hota hai ke market mein ek strong uptrend shuru hota hai, jise "B" leg kehte hain.

              Iske baad, third step mein, ek retracement hota hai aur market mein ek aur girawat aati hai, lekin pehli girawat se choti hoti hai. Is point par, traders ko dhyan rakhna chahiye ke yeh girawat kamzor hone ka possibility hai aur phir se uptrend shuru hone wala hai.

              Final step mein, market mein ek strong uptrend start hota hai, jo previous high ko cross karta hai. Yeh indicate karta hai ke market mein bullish momentum bani hui hai aur bearish trend ka reversal hua hai.

              Key notes:
              1. Butterfly pattern ko accurately identify karne ke liye, traders ko market trends aur candlestick formations par dhyan dena chahiye.
              2. Pattern ke har step par dhyan dena important hai, kyun ki ek chhota sa difference bhi overall analysis ko influence kar sakta hai.
              3. Market mein risk management ke principles ka palan karna bhi zaroori hai, kyunki har trading decision ke saath risk juda hota hai.
              4. Butterfly pattern ke saath, doosre technical indicators ka bhi istemal karna beneficial ho sakta hai.

              Overall, butterfly candlestick chart pattern traders ko market trends ke changes ko samajhne mein madad karta hai, lekin yeh sirf ek tool hai aur iska istemal prudent trading strategies ke saath karna chahiye.


              • #8 Collapse


                Butterfly candlestick chart patterns kai hai


                Click image for larger version

Name:	download (18).jpeg
Views:	87
Size:	12.0 کلوبائٹ
ID:	12807868

                Butterfly Candlestick Pattern (بٹرفلائی کینڈلسٹک پیٹرن):

                Butterfly candlestick pattern ek reversal pattern hai, jo market mein trend change hone ke possibility ko indicate karta hai. Yeh pattern typically downtrend ke baad aata hai aur bullish reversal ko suggest karta hai.

                Butterfly Candlestick Pattern ke Key Characteristics (خصوصیات):
                1. Formation (بنیاد):
                  • Butterfly pattern mein 4 candles shamil hote hain. Pehle do candles downtrend ko represent karte hain, phir third candle ek strong downtrend candle hoti hai, aur akhir mein fourth candle ek bullish reversal candle hoti hai.
                2. Equal Lows (برابر نچلا):
                  • Pehle do candles ke low prices nearly equal hote hain, indicating a support level. Third candle mein ek sharp decline hota hai, lekin new low create nahi hota.
                3. Extended Range (توسیع شدہ رینج):
                  • Third candle ka range typically pehle do candles ke range se extend hota hai, indicating increased volatility.
                4. Bullish Reversal Candle (بلش ریورسل کینڈل):
                  • Fourth candle ek bullish reversal candle hoti hai, jo pehle ke candles ke losses ko recover karke upar move karti hai.

                Butterfly Candlestick Pattern Trading Strategy (ٹریڈنگ سٹریٹیجی):

                Butterfly pattern ko trade karne ke liye traders ye steps follow karte hain:
                1. Identification (پہچان):
                  • Traders pehle butterfly pattern ko identify karte hain. Iske liye pehle do candles ke equal lows aur third candle ka extended range dekha jata hai.
                2. Confirmation (تصدیق):
                  • Traders wait for confirmation before making trading decisions. Confirmation aksar fourth candle ke bullish reversal ke baad hoti hai.
                3. Entry and Stop-Loss (داخلہ اور اسٹاپ لاس):
                  • Agar confirmation mil gaya hai, to traders long positions le sakte hain. Stop-loss orders ko set karna important hai, taki unexpected market movements se protect kiya ja sake.
                4. Target (ٹارگٹ):
                  • Target price ko set karne ke liye, traders previous resistance levels ya swing highs ka istemal karte hain.
                5. Volume Analysis (حجم تجزیہ):
                  • Volume analysis bhi important hai. Agar fourth candle ke bullish move ke samay volume increase hota hai, toh ye bullish reversal ko aur confirm karta hai.

                احتیاط:
                • Har pattern ki tarah, Butterfly pattern bhi 100% accurate nahi hota, aur is par pura bharosa karke hi trading decisions nahi lena chahiye. Always use additional technical analysis tools and risk management strategies for comprehensive trading decisions.


                • #9 Collapse

                  Butterfly candlestick chart patterns kai hai

                  Click image for larger version

Name:	download (22).jpeg
Views:	59
Size:	13.8 کلوبائٹ
ID:	12807910


                  Butterfly Candlestick Pattern:

                  1. Tafseelat:
                  • Butterfly Candlestick Pattern ek reversal pattern hai jo market charts par dikhai deta hai. Ye pattern bearish ya bullish trend ke reversal ko indicate karta hai.

                  2. Key Characteristics:
                  • Structure: Butterfly pattern ek specific candlestick arrangement ko represent karta hai jismein kuch candles ke highs aur lows specific proportions mein hote hain.
                  • Symmetry: Is pattern ka ek important feature symmetry hai, jiska matlab hai ke pattern ka ek hissa doosre ke saath similar hota hai.

                  3. Formation:
                  • Step 1: Pehle, ek strong trend hota hai, bearish ya bullish.
                  • Step 2: Phir, market mein retracement hota hai aur price specific Fibonacci levels tak pahunchta hai.
                  • Step 3: Butterfly pattern ka main characteristic ek specific sequence of candles hai jismein highs aur lows Fibonacci levels ke close hote hain.

                  4. Interpretation:
                  • Reversal Signal: Butterfly pattern bearish ya bullish trend ke exhaustion aur reversal ko indicate karta hai.
                  • Fibonacci Levels: Pattern ke highs aur lows Fibonacci retracement levels par focus karte hain.

                  5. Trading Strategies:
                  • Confirmation Signals: Butterfly pattern ko trade karne se pehle confirmatory signals ki zarurat hoti hai, jese ke doosre technical indicators, volume analysis, ya trend lines.
                  • Entry Point: Traders entry point tab choose karte hain jab market butterfly pattern ke according move karta hai.

                  6. Precautions:
                  • False Signals: Butterfly pattern ka istemal karte waqt false signals se bachne ke liye confirmatory factors ka istemal karna important hai.
                  • Risk Management: Risk management strategies ka istemal karna prudent hota hai taki unforeseen market movements se bacha ja sake.

                  7. Example:
                  • Agar ek stock ka price pehle bullish trend mein tha, phir ek retracement ke baad specific Fibonacci levels tak pahuncha, aur phir ek specific sequence of candles dikhta hai jismein highs aur lows Fibonacci levels ke close hote hain, toh ye ek butterfly pattern ho sakta hai.

                  8. Conclusion:
                  • Butterfly Candlestick Pattern ek reversal signal provide karta hai, lekin prudent trading ke liye confirmatory signals aur risk management ka istemal karna zaroori hai. Market conditions, overall trend, aur doosre factors ko bhi madde nazar rakhte hue is pattern ko analyze karna chahiye.


                  • #10 Collapse

                    Butterfly candlestick chart patterns kai hai

                    Click image for larger version

Name:	download (3).jpeg
Views:	61
Size:	13.8 کلوبائٹ
ID:	12807933


                    Butterfly Candlestick Pattern
                    1. Kya Hai:
                    • Butterfly candlestick pattern ek reversal pattern hai jo market charts par dikhai deta hai.
                    • Is pattern mein price ka ek specific arrangement hota hai jo indicate karta hai ke current trend mein reversal hone ke chances hain.

                    2. Formation:
                    • Butterfly pattern market mein high volatility ke doraan aata hai.
                    • Pattern ke formation mein kuch consecutive candles ka role hota hai jinke highs aur lows ka specific arrangement hota hai.
                    • Butterfly pattern ka central candle doji candle hota hai, jismein open aur close price barabar hoti hai.
                    • Doji candle ke dono taraf do long candles hote hain jinmein highs aur lows ka arrangement ek specific sequence mein hota hai.

                    3. Butterfly Pattern Ki Tafseelat:
                    • Doji Candle:
                      • Butterfly pattern ka key component ek doji candle hota hai. Yeh indicate karta hai ke market mein indecision hai aur buyers aur sellers ke darmiyan tawun hai.
                    • Consecutive Candles:
                      • Doji candle ke dono taraf consecutive candles hote hain jinke highs aur lows specific sequence mein arrange hote hain.
                      • In consecutive candles ke arrangement se ek butterfly shape ban jata hai.

                    4. Trading Strategy:
                    • Butterfly pattern ko trade karte waqt, traders ko confirmatory signals ka wait karna chahiye.
                    • Confirmatory signals mein volume analysis aur doosre technical indicators ka istemal shamil ho sakta hai.
                    • Entry point, stop-loss, aur take-profit levels ko set karna important hai.

                    5. Caveats (Ehtiyaat):
                    • Butterfly pattern har samay sahi signals nahi deta, isliye confirmatory tools ke saath istemal karna important hai.
                    • False signals se bachne ke liye cautious approach rakhein.

                    Conclusion (Mukhtasar): Butterfly candlestick pattern ek reversal signal hai jo traders ko market trends mein hone wale changes ke liye taiyar karta hai. Is pattern ko samajhna aur sahi taur par interpret karna traders ke liye important hai taki unhe profitable trading opportunities ka pata chale.
                    • #11 Collapse

                      Butterfly candlestick chart patterns kai hai

                      Click image for larger version

Name:	download (2).png
Views:	55
Size:	6.8 کلوبائٹ
ID:	12807942


                      Butterfly Candlestick Pattern:

                      "Butterfly" ek uncommon candlestick pattern hai jo market trends ke reversal ko indicate karta hai. Yeh pattern market ke dynamic nature ko samajhne mein madad karta hai. Is pattern ka formation kuch steps mein hota hai:

                      Formation:
                      1. Downward Move:
                        • Pehle market mein ek downtrend hota hai, jismein prices neeche ja rahe hote hain.
                      2. Initial Decline:
                        • Downtrend ke baad, ek sharp decline hota hai, jismein prices aur neeche jaate hain.
                      3. Recovery and Uptrend:
                        • Uske baad, prices mein ek sudden reversal hota hai, aur market mein uptrend shuru ho jata hai.
                      4. Second Decline:
                        • Uptrend ke baad, phir se ek decline hota hai, lekin yeh decline pehle se kam hota hai.
                      5. Final Uptrend:
                        • Dusre decline ke baad, market mein ek final uptrend hota hai, jise butterfly pattern complete hota hai.

                      Characteristics:
                      • Butterfly pattern ke chart par dekha jaye toh woh ek shape banata hai jo butterfly ki wings ya phir M ya W ke shape ki tarah hoti hai.
                      • Butterfly pattern mein retracement levels important hote hain. Fibonacci retracement levels ka istemal karke traders is pattern ko identify karte hain.
                      • Butterfly pattern market mein trend reversal ko suggest karta hai, lekin hamesha yaad rahe ke ek pattern par bharosa karne se pehle doosre technical indicators ka bhi istemal karna zaroori hai.

                      Trading Strategies:
                      1. Entry Point:
                        • Traders entry point tab tay karte hain jab butterfly pattern complete hota hai aur retracement levels ke saath match hota hai.
                      2. Stop Loss:
                        • Stop loss order ko traders support level ke neeche set karte hain, taki agar pattern galat ho aur price neeche jaata hai toh nuksan se bacha ja sake.
                      3. Take Profit:
                        • Take profit order ko traders apne risk-reward ratio ke mutabiq set karte hain.

                      Thawabit-e-Dimaagh:
                      • Butterfly pattern ke identification mein Fibonacci retracement levels ka istemal karna important hai.
                      • Hamesha market analysis ko confirm karne ke liye doosre technical indicators ka bhi istemal karen, aur pattern par pura bharosa na karen.


                      • #12 Collapse

                        Butterfly candlestick chart patterns kai hai

                        Click image for larger version

Name:	33.jpg
Views:	50
Size:	169.2 کلوبائٹ
ID:	12807958


                        Butterfly candlestick chart patterns ek technical analysis ka hissa hai, jise stock market ya financial markets mein trading aur investments ke liye istemal kiya jata hai. Butterfly patterns ko candlesticks ki madad se chart par represent kia jata hai, aur inka maqsad market ki trend mein possible tabdili ko darust karna hota hai.


                        Butterfly candlestick pattern ka naam is liye hai kyunki iski appearance ek butterfly ki tarah hoti hai. Ye pattern aam taur par reversal patterns mein istemal hota hai, jo ke trend mein badalav ki possibility ko darust karte hain. Yeh pattern doosre technical analysis tools aur indicators ke sath istemal hota hai takay traders ko sahi aur mawafiq trading decisions karnay mein madad milay.


                        Bullish Butterfly Pattern: Bullish butterfly pattern ka pehla hissa hota hai ek strong downtrend. Phir ek minor retracement hota hai, jo ke pehle downward move ko follow karta hai. Dusre strong downward move ke baad, jo ke pehle move ke low ko paar karta hai, phir ek aur minor retracement hota hai. Iske baad, pattern ek strong upward move ke sath complete hota hai, jo ke pehle retracement ke high ko paar karta hai.


                        Bearish Butterfly Pattern: Bearish butterfly pattern bhi ek reversal pattern hai, lekin isme trend downward hota hai. Is pattern mein pehle ek strong uptrend hota hai, phir ek minor retracement hota hai, dobara ek strong upward move hota hai jo pehle move ke high ko paar karta hai, phir ek aur minor retracement hota hai. Pattern ek strong downward move ke sath complete hota hai, jo ke pehle retracement ke low ko paar karta hai.


                        Butterfly candlestick pattern ke istemal mein, traders ko confirmation signals ki talash hoti hai. Yeh signals doosre technical indicators, moving averages, ya price action ke sath mil kar traders ko market ke future direction ke bare mein behtareen andaza dene mein madad karte hain.


                        Is tarah ke patterns ka tajziya aur uski sahi samajh ke liye, traders ko market ke mawafiq tools aur analysis ki zarurat hoti hai. Har trading decision se pehle, risk management aur stop-loss orders ka bhi khayal rakhna zaroori hai, taake nuksan se bacha ja sake.
                        • #13 Collapse

                          Butterfly candlestick chart patterns kai hai

                          Click image for larger version

Name:	8_butterfly_GBPUSD.jpg
Views:	85
Size:	64.1 کلوبائٹ
ID:	12807962


                          Butterfly Candlestick Pattern

                          1. Kya Hai:
                          • Butterfly Candlestick Pattern ek reversal pattern hai jo market charts par dikhai deta hai.
                          • Is pattern mein price ka specific arrangement hota hai jo indicate karta hai ke current trend mein reversal hone ke chances hain.

                          2. Formation:
                          • Butterfly pattern ka formation kuch consecutive candles se hota hai.
                          • Pattern mein kuch specific highs aur lows ka arrangement hota hai.
                          • Butterfly pattern ka central candle ek doji candle hota hai jismein open aur close price barabar hoti hai.
                          • Doji candle ke dono taraf do long candles hote hain jinmein highs aur lows ka arrangement ek specific sequence mein hota hai.

                          3. Butterfly Pattern Ki Tafseelat:
                          • Doji Candle:
                            • Butterfly pattern ka key component ek doji candle hota hai. Yeh indicate karta hai ke market mein indecision hai aur buyers aur sellers ke darmiyan tawun hai.
                          • Consecutive Candles:
                            • Doji candle ke dono taraf consecutive candles hote hain jinke highs aur lows specific sequence mein arrange hote hain.
                            • In consecutive candles ke arrangement se ek butterfly shape ban jata hai.

                          4. Trading Strategy:
                          • Butterfly pattern ko trade karte waqt, traders ko confirmatory signals ka wait karna chahiye.
                          • Confirmatory signals mein volume analysis aur doosre technical indicators ka istemal shamil ho sakta hai.
                          • Entry point, stop-loss, aur take-profit levels ko set karna important hai.

                          5. Caveats (Ehtiyaat):
                          • Butterfly pattern har samay sahi signals nahi deta, isliye confirmatory tools ke saath istemal karna important hai.
                          • False signals se bachne ke liye, doosre technical analysis tools ka istemal bhi kiya jana chahiye.

                          6. Conclusion (Mukhtasar): Butterfly Candlestick Pattern ek reversal signal hai jo traders ko market trends mein hone wale changes ke liye taiyar karta hai. Is pattern ko samajhna aur sahi taur par interpret karna traders ke liye important hai taki unhe profitable trading opportunities ka pata chale.
                          • <a href="https://www.instaforex.org/ru/?x=ruforum">InstaForex</a>
                          • #14 Collapse

                            Butterfly candlestick chart patterns kai hai


                            Butterfly candlestick chart pattern ek technical analysis ka tajaweez hai jo tijaratmandon ko kisi mali aset ki keemat mein mukhalif mawadat ke aas paas hone wale moamlat ko pehchanne mein madad karta hai, jaise ke forex market mein. Ye aik harmonic pattern hai jo Fibonacci levels par mabni hota hai aur jab sahi taur par banta hai, to ye moammalat mein mukhalif mawadat ke maqami nuqtaat ko zahir kar sakta hai.

                            Yahan Butterfly pattern ke kuch ahem pehluat hain:
                            1. X-A Leg: Ye pehla harkat hota hai, jisme ke keemat aik rukh mein chali jati hai (upar ya neeche).
                            2. A-B Leg: Ye pehli harkat ki ek punaridhar hoti hai, jo aksar 38.2% ya 50% Fibonacci level par hoti hai.
                            3. B-C Leg: Retracement ke baad, keemat apne asal rukh mein wapas chali jati hai, jo ke aksar X-A leg ke 78.6% Fibonacci level par hoti hai.
                            4. C-D Leg: Akhiri harkat bhi ek retracement hoti hai, jo ke aksar X-A leg ke 78.6% Fibonacci level par hoti hai, aur is se pattern mukammal hojata hai.

                            Butterfly pattern ko pehchanne ke liye, tijaratmand ratio ko dekhte hain jo is pattern ke alag hisson ke darmiyan hoti hain. Sab se ahem ratio C-D leg ki completion ka hota hai, jo ke aksar X-A leg ke 78.6% Fibonacci level par hota hai.


                            Yaad rakhein ke harmonic patterns, jese ke Butterfly, mukhalif mawadat ke signals farahem kar sakte hain, lekin ye kisi bhi surat mein bhi yaqeeni nahi hotay aur tijaratmand isay doosri technical analysis tools aur indicators ke saath istemal karte hain takay isay tasdeeq milay. Iske ilawa, kamiyabi ke liye ehtiyaat aur market ke mawafiq mahol ko samajhna bhi zaroori hai.


                            Aham hai ke technical analysis ke patterns ki kamyabi asarat par mabni hoti hai, aur tijaratmandon ko inko istemal karne se pehle zyada malumat aur mehnat hasil karna chahiye.

                            اب آن لائن

                            Working...
                            X