Assalamu Alaikum Dosto!


Aik forex trader analyst k leye k market main trading shoro karne se pehle candles k bare main janna ya zarori malomat rakhna bohut aham hai. Forex trading me Candlestick chart aik aham technique hai, q k ye qeematen parhne k leye estemal hote hen. Forex trading main analyst apni marzee k mutabiq candlestick k peroid ya duration ko on, off, high, low kar sakta hai. Candlestick charts ko inferadi tawar par estemal nahi karrna chaheye, bullkeh is ko dosre indicators jaise; RSI, MACD, Eliot Wave, Stochastic waghera k sath ekhata karke estemal karna chaheye, jo analysis ko mazzeed darrust aur kaar ammad banna detee hai.
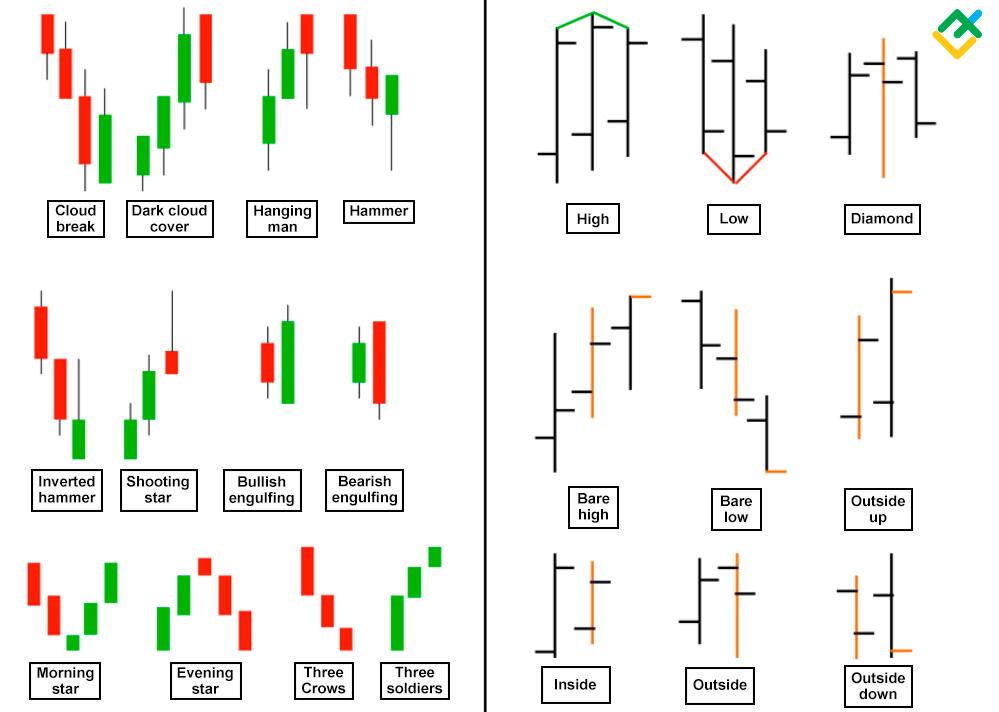
Forex Trading me teen kisam ki chart pattern istemal hoti hai, aik bar graph, dosra line graph aur last pe ya third one jo hai wo hai candle stick pattern. In sab me sab se ziada analysis istemal hone wala pattern candle stick pattern hai. Candle stick pattern me maximum analysis aur asani se samajh a jane ki waja se ye pattern sanb se best chart pattern hai.
Forex trading me candle sticks ka istemal bohut zarori hota hai aur hamen lazmi candle stick ka bare me information honi chaheye. Candle stick hi k zarye se hum forex trading me technical analysis karte hen aur aik pairki movement ka candle stick ki madad se hi hum forex trading me asal position ko malom karte hen. Forex trading bihyt hi risky buisiness hai. Is buisiness me hamare pass knowledge, experience aur trading skills ka hona bohut ziada zarori hota hai. Aur ye knowledge hamare analysis me aham role play karta hai. Forex trading me jitne bhi candle stick analysis k leye istemal hote hen wo sare k sare isi me hi maojood hote hen.
Forex trading me kabhi bhi hum dosre graphs pe chart ko sahi tarah se samajh nahi pa sakte hen sewaye candle stick pattern kay. Forex trading me koshash karen k analysis learn karen us k bad candle stick k mukhtalif qisam ki formation dekhen aur koshash karen k behtareen kaam k bad hi trading ka aghaz karen. Candle stick pe analysis k bad hi hum achi trading kar sakte hen.
Forex trading k analysis main estemal honi wali aik single candle main prices k hawalle se bohut ziadda aham malloomat hoti hen, jo k aam tawar par humen dosre charts jaise line ya bar charts main dasteyab nahi hote. Aik sigle candlestick jo information humen deti hen wo darrjazzel hai;
Candlesticks ka timeframe k sath barra khas link hota hai. Timeframes darrasal candles ki aik makhsos waqat hota hai, jis k dowran price us aik hi candles me up down harkat karti hai. Aik candlestick ka time one minute, five minutes, fifteen minutes, thirty minutes, one hour, four hour, one day, one week aur one month tak ho saktee hai. Jittna aik candle ka time frame ziada hoga utna hi wo ziadda informative hogi. Yanee one minute aur five minutes k candles k muqabbelle main four hourly ya one day k timeframes wali candles ziadda fayedar hotti hai.
Candlestick
Aik forex trader analyst k leye k market main trading shoro karne se pehle candles k bare main janna ya zarori malomat rakhna bohut aham hai. Forex trading me Candlestick chart aik aham technique hai, q k ye qeematen parhne k leye estemal hote hen. Forex trading main analyst apni marzee k mutabiq candlestick k peroid ya duration ko on, off, high, low kar sakta hai. Candlestick charts ko inferadi tawar par estemal nahi karrna chaheye, bullkeh is ko dosre indicators jaise; RSI, MACD, Eliot Wave, Stochastic waghera k sath ekhata karke estemal karna chaheye, jo analysis ko mazzeed darrust aur kaar ammad banna detee hai.
Forex Trading me teen kisam ki chart pattern istemal hoti hai, aik bar graph, dosra line graph aur last pe ya third one jo hai wo hai candle stick pattern. In sab me sab se ziada analysis istemal hone wala pattern candle stick pattern hai. Candle stick pattern me maximum analysis aur asani se samajh a jane ki waja se ye pattern sanb se best chart pattern hai.
Forex trading me candle sticks ka istemal bohut zarori hota hai aur hamen lazmi candle stick ka bare me information honi chaheye. Candle stick hi k zarye se hum forex trading me technical analysis karte hen aur aik pairki movement ka candle stick ki madad se hi hum forex trading me asal position ko malom karte hen. Forex trading bihyt hi risky buisiness hai. Is buisiness me hamare pass knowledge, experience aur trading skills ka hona bohut ziada zarori hota hai. Aur ye knowledge hamare analysis me aham role play karta hai. Forex trading me jitne bhi candle stick analysis k leye istemal hote hen wo sare k sare isi me hi maojood hote hen.
Forex trading me kabhi bhi hum dosre graphs pe chart ko sahi tarah se samajh nahi pa sakte hen sewaye candle stick pattern kay. Forex trading me koshash karen k analysis learn karen us k bad candle stick k mukhtalif qisam ki formation dekhen aur koshash karen k behtareen kaam k bad hi trading ka aghaz karen. Candle stick pe analysis k bad hi hum achi trading kar sakte hen.
Candlestick ki Information
Forex trading k analysis main estemal honi wali aik single candle main prices k hawalle se bohut ziadda aham malloomat hoti hen, jo k aam tawar par humen dosre charts jaise line ya bar charts main dasteyab nahi hote. Aik sigle candlestick jo information humen deti hen wo darrjazzel hai;
- High Price:
Candle k upside par selected time period durran sab se highest point ko high price kaha jata hai. Ye candle ki body bhi ho saktee hai aur candle ki wick ya shadow bhi. - Low Price:
Candle k downside par selected time period durran sab se lower point ko low price kaha jata hai. Ye bhi candle ki body bhi ho saktee hai aur candle ki wick ya shadow bhi. - Open Price:
Open price se murrad selected timeframe main candle ka wo hisa hota hai, jahan se candle ka aghaaz hota hai. - Close Price:
Close price kisi bhi timeframe ka end point hota hai, jis k baad nayya timeframe shorro hota hai. - Candle Body :
Open aur close price k darrmmeyan area candlestick ki body ya real body kehlati hai. Ye real body up aur down dono sematoo main ho sakti hai.- Green Body: Agar candle ki selected timeframe main closing price opening price se high ya ziadda hai to ye candle green ya white (candle ki by default color) color ki body banati hai. Green candles banne ka mattlab hai k stocks ki price uptrend main ja rahi hai, aur ye aik qessam ki musbat tabdeelee hoti hai.
- Red Body: Aggar candle ki selected timeframe main closing price opening price se low ya kam hai to ye candle red ya black (candle ki by default color) color ki body banati hai. Red candles green k barr akas price k downtrend ki nishandahi aur prices k manffee rawayye ko zahir karti hai.
- Wick or Shadow :
Wick ya shodow aik bareek line hoti hai, jo k candles me opening aur closing price k up ya down side pe bannti hai. Candles k body ki tarah wick bohut impotant malomat rakhti hai, aur baaz daffa to ye as a indicator bhi kaam karrti hai. Candle k up side pe upper shadow ya wick jab k down side pe lower shadow ya wick banta hai. Kuch candles main to body bulkul hoti hi nahi hai, yanee un candles main open aur close aik hi price pe hote hen, un candles ko doji candles kaha jata hai.
Candlestick aur Timeframes
Candlesticks ka timeframe k sath barra khas link hota hai. Timeframes darrasal candles ki aik makhsos waqat hota hai, jis k dowran price us aik hi candles me up down harkat karti hai. Aik candlestick ka time one minute, five minutes, fifteen minutes, thirty minutes, one hour, four hour, one day, one week aur one month tak ho saktee hai. Jittna aik candle ka time frame ziada hoga utna hi wo ziadda informative hogi. Yanee one minute aur five minutes k candles k muqabbelle main four hourly ya one day k timeframes wali candles ziadda fayedar hotti hai.
تبصرہ
Расширенный режим Обычный режим