Japanese Candlestick

No announcement yet.
`
X
  • وقت
  • دکھائیں
Clear All
new posts
  • #1 Collapse

    Japanese Candlestick
    What is Japanese Candlestick


    Introduction


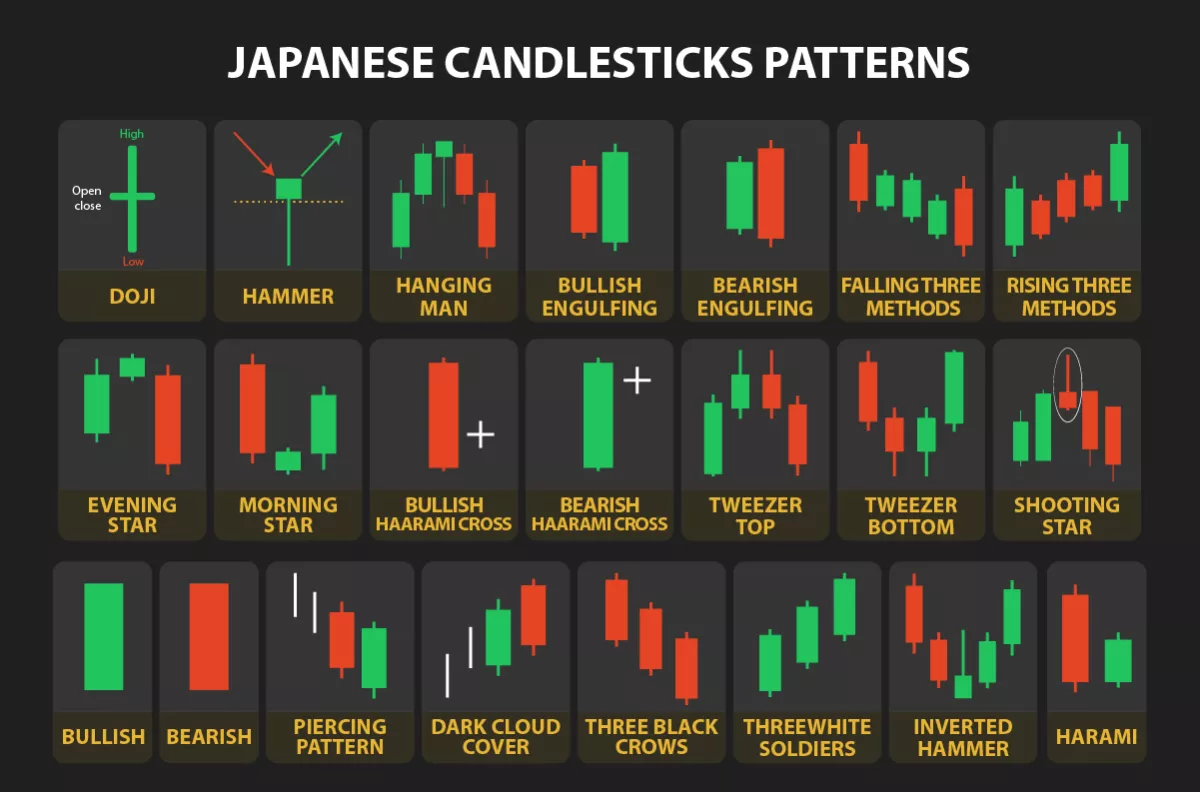
    Japanese Candlestick Patterns, Forex aur Stock Market mein istemal hotay hain taake traders ko market ki harkat samajhne mein madad mile. Yeh patterns candlesticks ke shapes aur formations ko analyze karke market trends ko predict karne mein madad karte hain.


    1.


    Doji ek aisa pattern hai jisme opening aur closing price aik dosre ke bohot qareeb hoti hain. Yeh market mein uncertainty ko darust karti hai aur traders ko indicate karta hai ke market mein reversal hone ke chances hain.


    2.


    Hammer ek bullish reversal pattern hai, jisme ek chhoti si candle body hoti hai aur lambi lower shadow hoti hai. Yeh market mein bearish trend ko indicate karta hai, lekin phir market mein buyers ka aana isko reversal signal banata hai.


    3


    Shooting Star ek bearish reversal pattern hai, jisme ek lambi upper shadow hoti hai aur chhoti si candle body hoti hai. Yeh market mein bullish trend ko indicate karta hai, lekin phir market mein sellers ka aana isko reversal signal banata hai.


    4.


    Bullish Engulfing ek strong bullish reversal signal hai, jisme ek small bearish candle ke baad aata hai aur next candle usse badi bullish candle hoti hai. Yeh market mein bearish trend ko indicate karta hai, lekin phir strong buying ka signal deta hai.


    5.


    Bearish Engulfing ek strong bearish reversal signal hai, jisme ek small bullish candle ke baad aata hai aur next candle usse badi bearish candle hoti hai. Yeh market mein bullish trend ko indicate karta hai, lekin phir strong selling ka signal deta hai.


    6.


    Morning Star ek bullish reversal pattern hai, jisme ek downtrend ke baad ek small body wali candle aati hai, phir ek Doji aur phir ek bullish candle. Yeh market mein bearish trend ko indicate karta hai, lekin phir strong buying ka signal deta hai.


    7.


    Evening Star ek bearish reversal pattern hai, jisme ek uptrend ke baad ek small body wali candle aati hai, phir ek Doji aur phir ek bearish candle. Yeh market mein bullish trend ko indicate karta hai, lekin phir strong selling ka signal deta hai.

    In patterns ko samajh kar traders market trends ko better analyze kar sakte hain aur apne trading strategies ko improve kar sakte hain.

  • <a href="https://www.instaforex.org/ru/?x=ruforum">InstaForex</a>
  • #2 Collapse

    Japanese Candlestick, ya Japnai Sheeshi, ek popular technical analysis tool hai jo stocks, commodities, currencies, aur anya financial instruments ke price movements ka visual representation provide karta hai. Yeh ek bahut hi effective aur prachin tarika hai market trends aur reversals ko samajhne ka.
    Sheeshi ka istemal pehli bar 18th century mein Japan mein rice trading ke doran hua tha. Har ek candlestick ek specific time period ko represent karta hai, jise hum bolte hain "timeframe". Har candlestick ek rectangle shape ka hota hai jise "body" kehte hain, aur iske dono ends ko "wicks" ya "shadows" kehte hain.

    Har candlestick ke body ka color market movement ko darust taur par dikhata hai. Agar candle ka body upar ki taraf hai, toh iska matlab hai ki price badh rahi hai, jabki agar niche ki taraf hai, toh price gir rahi hai. Is tareeke se, traders ko ek quick visual indication mil jata hai ke market bullish ya bearish hai


    Click image for larger version

Name:	download (20).png
Views:	43
Size:	4.3 کلوبائٹ
ID:	12806124

    Kuch common Japanese candlestick patterns hain jo traders ke liye important hote hain. Ek example hai "Doji", jo ek aisa pattern hai jisme opening aur closing price barabar hoti hai. Yeh market mein uncertainty ko darust taur par dikhata hai aur future price movement ke liye hint deta hai.

    "Doji" ke alawa, kuch aur popular candlestick patterns hain jaise "Hammer", "Shooting Star", aur "Engulfing". In patterns ki madad se traders market ke potential reversals ko anticipate kar sakte hain.

    Japanese candlesticks ke istemal se, traders ko not only current price trends ka pata chalta hai, balki unhe future trends ka bhi andaza lagane mein madad milti hai. Iske alawa, candlestick analysis volatility aur market psychology ko bhi samajhne mein madad karta hai.

    Yeh technique beginner traders ke liye bhi acchi hai, kyun ki isme complex mathematical calculations ki zarurat nahi hoti hai. Iske visual nature ki wajah se, koi bhi trader aasani se price patterns ko dekhkar decisions le sakta hai.

    Final words mein, Japanese candlesticks ka istemal karke traders apne trading strategies ko refine kar sakte hain aur market movements ko samajhne mein mahir ho sakte hain. Yeh ek powerful tool hai jo market analysis mein ek holistic approach provide karta hai aur traders ko confident decisions lene mein madad karta hai
    • #3 Collapse

      Assalamu Alaikum Dosto!
      Japanese Candlesticks History


      Forex trading ka sabse popular charting technique Japanese Candlestick hai. Candlestick charting technique ko 18th century me Japan me develop kiya gaya tha. Munehisa Homma ek Japanese rice trader tha jinhone candlestick charting technique ko develop kiya tha. Homma ne ek unique tareeke se rice prices ko track kiya tha aur usne unki movement ko visualize karne ke liye candles ka use kiya tha.
      Homma ke candlestick patterns me do categories thi: continuation patterns aur reversal patterns. Continuation patterns me Homma ne ek uptrend ya downtrend ke beech ke small movements ko analyze kiya tha aur uske baad future movement ka prediction kiya tha. Reversal patterns me, Homma ne trend ki change ke baare me prediction kiya tha.
      Candlestick charting technique ko baad me Steve Nison ne Western traders ke liye popular kiya. Nison ne Japanese Candlestick patterns ke baare me ek book likhi aur use Western traders ko introduce kiya. Uske baad se candlestick charting technique ne Western world me bhi apna naam bana liya.
      Japanese Candlestick charting technique ka use traders apni trading decisions ko improve karne ke liye karte hai. Candlestick charts me, traders ko price movement ko samajhne me help milta hai aur wo apni trading strategies ko improve kar sakte hai. Candlestick charts me, har ek candlestick ka body bullish ya bearish hota hai aur iski size price movement ko represent karta hai. Candlestick me upper shadow aur lower shadow bhi hota hai jo support aur resistance level ko represent karte hai.

      Click image for larger version  Name:	main-qimg-5cce373e7933b96c0c76c5ed559cd660.jpeg Views:	0 Size:	67.2 KB ID:	12836427
      Japanese Candlesticks ki Characteristics


      Japanese Candlestick charting technique, traders ke liye ek useful technical analysis tool hai jo price movement ko analyze karne me help karta hai. Candlestick charts me, har ek candlestick ka body bullish ya bearish hota hai aur iski size price movement ko represent karta hai. Candlestick me upper shadow aur lower shadow bhi hota hai jo support aur resistance level ko represent karte hai. Is article me, Japanese Candlestick charting technique ke mukhtalif components jaise body, shadow, open, close, high aur low ki tafseel di gayi hai.
      • Candlestick ka Body:
        Candlestick ka body us candlestick ka part hota hai jo open aur close price ke beech me hota hai. Agar candlestick ka body bullish hai to iska matlab hai ki closing price opening price se upar gaya hai. Agar candlestick ka body bearish hai to iska matlab hai ki closing price opening price se neeche gaya hai.
      • Bullish Candlestick:
        Agar candlestick ka body lamba aur white hai to iska matlab hai ki buyers dominant the aur price increase hua hai. Is tarah ke candlesticks ko Bullish candlesticks kaha jata hai.
      • Bearish Candlestick:
        Agar candlestick ka body lamba aur black hai to iska matlab hai ki sellers dominant the aur price decrease hua hai. Is tarah ke candlesticks ko Bearish candlesticks kaha jata hai.
      • Candlestick ka Shadow:
        Candlestick ka shadow us candlestick ka part hota hai jo body ke upar aur neeche ki taraf extend hota hai. Shadow ko upper shadow aur lower shadow me divide kiya jata hai. Upper shadow high price aur body ke upar ki jagah ke beech me hota hai. Lower shadow low price aur body ke neeche ki jagah ke beech me hota hai.
      • Candlestick ka Open price:
        Candlestick ka open price wo price hota hai jo market me pehle trade hua tha jab candlestick shuru hua tha. Agar candlestick ka open price candlestick ke body ke upar hota hai to iska matlab hai ki buyers dominant hai aur price increase hone wala hai. Agar candlestick ka open price candlestick ke body ke neeche hota hai to iska matlab hai ki sellers dominant hai aur price decrease hone wala hai.
      • Candlestick ka Close price:
        Candlestick ka close price wo price hota hai jo market me last trade hua tha jab candlestick khatam hua tha. Agar candlestick ka close price candlestick ke body ke upar hota hai to iska matlab hai ki buyers dominant hai aur price increase hone wala hai. Agar candlestick ka close price candlestick ke body ke neeche hota hai to iska matlab hai ki sellers dominant hai aur price decrease hone wala hai.
      • Candlestick ka High price:
        Candlestick ka high price wo price hota hai jo candlestick ke time period me maximum trade hua tha. High price ka use support aur resistance level ko identify karne me kiya jata hai.
      • Candlestick ka Low price:
        Candlestick ka low price wo price hota hai jo candlestick ke time period me minimum trade hua tha. Low price ka use support aur resistance level ko identify karne me kiya jata hai.


      Japanese Candlestick charting technique me har ek candlestick ka body bullish ya bearish hota hai aur iski size price movement ko represent karta hai. Candlestick me upper shadow aur lower shadow bhi hota hai jo support aur resistance level ko represent karte hai. Candlestick ka open price wo price hota hai jo market me pehle trade hua tha jab candlestick shuru hua tha aur candlestick ka close price wo price hota hai jo market me last trade hua tha jab candlestick khatam hua tha. Candlestick ka high price wo price hota hai jo candlestick ke time period me maximum trade hua tha aur candlestick ka low price wo price hota hai jo candlestick ke time period me minimum trade hua tha.
      Japanese Candlestick charting technique ke mukhtalif components ke sahi tarike se samajhna traders ke liye bahut important hai kyunki yeh unhe market ke movement ka direction batane me help karte hai. Agar aap candlestick charting technique ko sahi tarike se samajhna chahte hai to aapko har ek component ke sahi interpretation ke sath unhe use karna hoga. Candlestick charts ko analyze karne ka yeh tarika aaj bhi traders ke liye bahut useful hai aur iska use karke woh apni trading decisions ko improve kar sakte hai.
      Japanese Candlesticks k Dosre Charting Pattern se Differences


      Japanese candlestick charting technique ko use karke traders market trend ke direction, reversal points aur price movement ko samajh sakte hain. Iske alawa, traders ko market me apne trades ki entry aur exit points ko bhi samajhne me help milti hai. Candlestick charts ka use karne ka ek aur fayda ye hai ki ye charts traders ko market me trade karne ke liye useful information provide karte hain.
      Lekin, candlestick charts ke alawa bhi kai tarah ke charts market analysis me use kiye jaate hain. Inme se kuch popular charting techniques hai Line charts, Bar charts aur Heikin-Ashi charts. Har charting technique apne tarike se traders ko market me useful information provide karta hai.
      1. Line Chart Se Difference:

        Line chart ek simple chart hai jo market price ko aik line me show karta hai. Ye charting technique traders ke liye useful hai jab unhe market ki basic trend samajhna hai. Line chart traders ko market ki price ki trend ko samajhne me help karta hai aur unhe sahi direction me trading decisions lene me help karta hai.
      2. Bar Chart Se Difference:

        Bar chart candlestick charts se kuch had tak similar hota hai. Is charting technique me market ke trend ke liye ek vertical line use ki jaati hai. Line ka upar wala point market ke high price ko represent karta hai aur line ke neeche wala point market ke low price ko represent karta hai. Bar chart traders ko market ke trend ko samajhne aur price movement ke liye useful information provide karta hai.
      3. Heikin-Ashi Chart Se Difference:

        Heikin-Ashi chart bhi candlestick charts ke sath similar hota hai. Is charting technique me bhi traders ko market ke trend ke direction, reversal points aur price movement ko samajhne me help milti hai. Lekin is charting technique me candlestick charts ki tarah ek candlestick ka body aur uske upper aur lower shadows nahi hote hai. Is charting technique me candlesticks ke body ke place par price movement ke bars hoti hai jo traders ko price movement ke trend ko samajhne me help karte hai.


      Sabhi charting techniques ke alag alag fayde aur limitations hote hain. Candlestick charts ke alag alag candlestick patterns traders ko market ke trend ke direction aur reversal points ke bare me useful information provide karte hai. Line charts market ki basic trend ko samajhne ke liye useful hai. Bar charts traders ko market ke price movement ke bare me useful information provide karta hai aur Heikin-Ashi charts candlestick charts ke sath similar hota hai lekin isme candlesticks ki jagah bars use kiye jaate hain.
      In sabhi charting techniques ko use karke traders apni trading decisions ko improve kar sakte hai. Har charting technique ke sahi tarike se samajhne se traders ko market me sahi trading decisions lene me help milti hai.
      • #4 Collapse


        Click image for larger version

Name:	download (19).png
Views:	29
Size:	2.1 کلوبائٹ
ID:	12836552


        Japanese Candlestick

        Japanese candlesticks, yaadgar banay hain jo Japani ryakay hain aur munafa ya nuksan ki jhalak dete hain. Inhe 17th century mein honay wale munafa karyon ki takhleeqiya nishaniyan manaya jata hai. Japanese candlesticks ka istemal kar ke, traders aur investors maamooli tor par prices ke patterns aur trends ko samajh sakte hain.

        Har Japanese candlestick ek mukhtalif hota hai aur do hisson se bana hota hai: sharafat (body) aur shaakh (wicks). Sharafat ek diye ki badan ki tarah hota hai aur yeh opening aur closing prices ke darmiyan ka farq darust karta hai. Agar opening price closing price se zyada hoti hai, to sharafat amuman safaid ya halka rang mein hoti hai aur yeh bull market ko darust karti hai. Jab closing price opening price se zyada hoti hai, to sharafat amuman siyaah ya gehra rang mein hoti hai aur yeh bear market ko darust karti hai.

        Shaakh ya choti candle ki oonchaai aur neeche ka hissa darust karta hai. Yeh woh sarayat hain jo price ke oonchaai aur neeche ka darust karte hain. Agar shaakh lambi hai, to yeh dikhata hai ke trading session mein zyada tawajju di gayi aur price mein zyada tabdiliyan aayi hain. Agar shaakh choti hai, to yeh dikhata hai ke trading session mein kam tawajju di gayi aur price mein kam tabdiliyan aayi hain.

        Japanese candlesticks ek bohot hi qadeem aur samaji alaamati system hain jo traders ko market trends aur potential price movements ka andaza lagane mein madad karte hain. Inka istemal kar ke, traders aksar trading signals ko samajhte hain jo unhe munafa kamane mein madad dete hain.

        Chand aham Japanese candlestick patterns

        Doji

        Ye pattern dikhata hai ke opening aur closing prices ek doosre ke qareeb hain aur iska matlab hai ke market indecision ka shikaar hai.

        Hammer

        Ye bullish reversal pattern hota hai jo price ke neeche girne ke baad nazar aata hai. Ye dikhata hai ke sellers thak chuke hain aur buyers control mein aagaye hain.

        Shooting Star

        Ye bearish reversal pattern hota hai jo price ke oonchaai par nazar aata hai. Ye dikhata hai ke market ke upar pressure hai aur price neeche ja sakta hai.


        Engulfing

        Ye bullish ya bearish reversal pattern hota hai jo do candlesticks se bana hota hai. Jab doosri candle pehli candle ko puri tarah se cover karti hai, to ye engulfing pattern banata hai.

        In chand alaamati patterns ke saath saath, traders ko mukhtalif Japanese candlestick formations aur unke combinations ke saath kaam karna chahiye. Yeh unhe market trends aur potential price movements ko samajhne mein madad karte hain aur unhe trading decisions lene mein madad karte hain.

        Overall, Japanese candlesticks ek powerful tool hain jo traders aur investors ko market analysis mein madad karte hain aur unhe trading signals provide karte hain. Iski sahi samajh aur istemal se, traders apne trading strategies ko behtar bana sakte hain aur munafa kamane mein kamiyab ho sakte hain
        • #5 Collapse

          japanese candlestick

          Click image for larger version

Name:	download (15).jpeg
Views:	35
Size:	27.0 کلوبائٹ
ID:	12836578


          1. Ta'aruf (Introduction):


          Japanese Candlesticks, ek technical analysis tool hai jo market movements ko represent karne mein istemal hota hai. Yeh method Japan se aaya hai aur 18th century mein rice trading market mein develop hua tha.
          2. Candlesticks Ki Paidaish (Origin of Candlesticks):
          • Japanese Candlesticks ka istemal asal mein rice market ke liye kiya gaya tha. Munafai aur nuksan ko visual form mein represent karne ke liye candlestick patterns ko develop kiya gaya.
          • Munafai hone par white color aur nuksan hone par black color ka istemal hota tha.
          3. Munafai-Nuksan (Profit and Loss):
          • Har candlestick ek specific time period (jese ke 1 day) ko represent karta hai.
          • Opening price, closing price, high aur low prices har candlestick mein shamil hoti hain.
          • Bullish candlesticks (white) ko munafai aur bearish candlesticks (black) ko nuksan represent karte hain.
          4. Mashhoor Candlestick Patterns (Famous Candlestick Patterns):
          • Doji: Jab opening price aur closing price barabar hoti hai, toh doji form hota hai, indicating market indecision.
          • Hammer aur Hanging Man: Ek lambi lower shadow ke saath, chhota body wala candlestick pattern hai jo trend reversal ko indicate karta hai.
          • Engulfing Pattern: Jab ek candlestick doosre candlestick ko poori tarah se cover karta hai, toh engulfing pattern form hota hai, indicating trend reversal.
          5. Candlestick Patterns Ka Istemal (Usage of Candlestick Patterns):
          • Candlestick patterns ka istemal market trends aur potential reversals ko predict karne ke liye hota hai.
          • Traders in patterns ka istemal karke entry aur exit points tay karte hain.
          6. Conclusion (Ikhtitam):


          Japanese Candlesticks ka tareekh lamba aur mazboot hai, aur aaj kal ye ek popular technical analysis tool hai. Traders worldwide inka istemal karte hain market movements ko samajhne aur trading decisions lene ke liye.

          Yeh guide humein batati hai ke Japanese Candlesticks kya hote hain, inki tareekh kya hai, aur kaise traders inka istemal karke market trends ko samajh kar behtar trading decisions le sakte hain.


          • #6 Collapse


            JAPANESE CANDLESTICK PATTERN DEFINITION

            Japanese candlestick Ek technical analysis ka tools hai Jise traders security ki price ki movement ko chart and analysis karne ke liye istemal Karte Hain homma Ne Aisi candles stick developed ki Jo Fark ko zahar karne ke liye different colors ka istemal karte hue price ki Move ki nature ko graphic ke Taur per zahar karti hai traders price action ke pattern ki short term deduction ki buniyad per decision karne ke liye candles stick istemal Karte Hain vah Har time ke price action Ke Piche suply and demand ki image represent provides Karte Hain Har candles stick mein Ek center portion Shamil Hai


            JAPANESE CANDLESTICK vs. BAR CHART

            Jo trade ki jaane wali security ke open and close hone Ke Darmiyan distance zahar karta hai Jis areas ko body Kaha jata hai upri shadow trading period Ke liye Low Ke Darmiyan price ka distance hai trading ki jaane wali security ki closing price is baat ka determine Karti Hai Ki candles bullish se hai ya bearish ka hai real body am Taur per white Hota Hai Agar candlestick open Se zyada price price close Ho Jaati Hai Aisi Surat Mein closing price real body ke sabse upar Waqia hoti hai candles stick ab body ke white and black color ko color Jaise red green blue color se Badal Deti Hai


            JAPANSE CANDLESTICK KI TYPE

            Electronic trading plate form istemal Karte time traders Colors mein se Choos kar sakte hain Japani candlestick aur bar chart donon traders ko ek Jaisi maloomat provides Karte Hain aur iski three types hain doji gravestone doji Dragonfly doji hain candlest stick chart per body ke upar and niche ka Part Shadow ke naam se Jana jata hai candlestick body ki lambai and Shadow donon price action ke important indicator hai candles ki Kuchh example Shamil Hai Dragonfly do ji ek upri Trend ke Shadow ka signals deta hai Rs ki identify bottom line Se Ki Jaati Hai
            • #7 Collapse

              japanese candlestick

              Click image for larger version

Name:	download (5).png
Views:	30
Size:	3.7 کلوبائٹ
ID:	12836634


              Japanese Candlestick, forex trading aur financial markets mein istemal hone wala ek charting technique hai. Yeh ek visual representation provide karta hai market ke price movements ka. Chaliye isey Roman Urdu mein samajhte hain:

              Japanese Candlestick (Japaneesi Mombati):

              Japanese Candlestick ek tarah ka chart hai jisme har ek time period (jaise ke ek din, ek ghanta, ya ek hafta) ke during huye price movements ko darust karne ke liye candles ka istemal hota hai. Har ek candlestick chart ek specific time period ko represent karta hai, aur har candlestick ke andar do hisse hote hain: body (jism) aur shadows (shadows yaani ki upper aur lower wicks).

              Candlestick ka Tareeqa:
              1. Body (Jism): Candlestick ka mota hissa body kehlata hai aur yeh opening price aur closing price ke darmiyan ka area ko darust karta hai.
              2. Shadows (Wicks): Candlestick ke upper aur lower sides par jo patli lines hoti hain, unhe shadows ya wicks kehte hain. Yeh upper wick highest price aur lower wick lowest price ko darust karte hain.

              Candlestick Colors:

              Candlesticks ko do tarah ke colors mein dikhaya jata hai:
              • Bullish Candlestick (Bullish Mombati): Agar closing price opening price se zyada hai, to candlestick usually green ya white color mein hoti hai, aur isay bullish candlestick kehte hain. Yeh indicate karta hai ke market mein buyers zyada active hain aur prices upar ja sakti hain.
              • Bearish Candlestick (Bearish Mombati): Agar closing price opening price se kam hai, to candlestick usually red ya black color mein hoti hai, aur isay bearish candlestick kehte hain. Yeh indicate karta hai ke market mein sellers zyada active hain aur prices neeche ja sakti hain.

              Candlestick Patterns:

              Japanese Candlestick ka istemal market trends, reversals, aur price movements ke patterns ko identify karne mein hota hai. Kuch aise patterns hote hain jo traders ko future price movements ka andaza lagane mein madad karte hain. Jaise ke "Doji," "Hammer," "Engulfing," aur "Morning Star" wagaira.

              Candlestick charts traders ko market ke mood ko samajhne mein madad karte hain aur unhe trading decisions lene mein help karte hain. Yeh ek popular aur effective charting technique hai jo traders ke darmiyan istemal hota hai.


              • #8 Collapse

                japanese candlestick

                Click image for larger version

Name:	images.png
Views:	26
Size:	4.1 کلوبائٹ
ID:	12836642


                Japanese Candlesticks, financial markets mein price action ko visualize karne ke liye ek powerful tool hai. Har candlestick ek specific time period ko represent karta hai aur isme chaar mukhtalif prices shamil hoti hain: open (shuruwat), close (band), high (zyada), aur low (kam). Yeh candlesticks patterns banate hain jinhe traders market trends aur reversals ko samajhne ke liye istemal karte hain.
                1. Candlestick Structure:
                  • Har candlestick ek rectangle ke tarah hota hai jise body kehte hain, jiska ek line upper side par hota hai (upper shadow) aur ek line lower side par hota hai (lower shadow).
                  • Agar close price open price se zyada hoti hai, to candlestick bullish hota hai aur body ko usually white ya green color mein represent kiya jata hai.
                  • Agar close price open price se kam hoti hai, to candlestick bearish hota hai aur body ko usually black ya red color mein represent kiya jata hai.
                2. Candlestick Patterns:
                  • Doji: Jab open aur close prices barabar hote hain, to ye pattern ban jata hai. Ye indecision ko darust karti hai aur future price movement ke liye signal ho sakti hai.
                  • Hammer aur Hanging Man: Ye patterns ek lambi lower shadow ke saath hote hain aur indicate karte hain ke market mein reversal hone ke chances hain.
                  • Shooting Star: Ye pattern ek lambi upper shadow ke saath hota hai aur indicate karta hai ke market mein bearish reversal hone ke chances hain.
                3. Candlestick Combinations:
                  • Traders mukhtalif candlestick patterns ki combinations dekhte hain jaise ke Bullish Engulfing (jab ek bullish candlestick ek bearish candlestick ko completely engulf karta hai) ya Bearish Harami (jab ek large bullish candle ke baad ek small bearish candle aata hai).
                4. Technical Analysis:
                  • Japanese Candlesticks, technical analysis ke ek integral hissa hain. Traders inhe use karte hain market trends, reversals, aur entry/exit points ko identify karne ke liye.

                Candlestick analysis ek art hai jo experience aur market understanding par adharit hai. Traders ko is technique ko acche se samajhne ke liye practice aur observation ki zarurat hoti hai.


                • #9 Collapse


                  Japanese Candlestick: Ek Qadeem Aur Maqbool Tijarti Barometer

                  Tijarat ke duniya mein, Japanese candlestick charts ek qadeem lekin mufeed tareeqa hai jisay traders istemal karte hain taake woh market trends aur price movements ka andaza laga sakein. Ye tareeqa Japan se aaya hai aur aam tor par forex, stocks, aur commodities trading mein istemal hota hai.

                  Japanese candlesticks ko dekh kar insaan ko ek mukhtasir tareeqa milta hai market ki movement ko samajhne ka. Har candlestick ek time period ko represent karta hai, jese ke ek din, ek hafte, ya ek ghante ka time frame. Har candlestick ek rectangle ko yaad dilaata hai jise hum body kehte hain, aur iske ooper aur neeche chhote se line ko shadow ya wick kehte hain.

                  Har candlestick chart mein do rang hote hain: ek hai bullish candlesticks aur doosra hai bearish candlesticks. Agar market price uptrend mein hai to bullish candlesticks dekha jaata hai jo ke green ya white color mein hotay hain. Jab ke agar market price downtrend mein hai to bearish candlesticks dekha jaata hai jo ke red ya black color mein hotay hain.

                  Japanese candlesticks ki zyada se zyada ahmiyat yeh hoti hai ke woh traders ko immediate price action ka andaza dete hain. Agar aap dekh rahe hain ke market mein kis tarah ka movement ho raha hai, ya phir kis tarah ka trend ban raha hai, to candlestick charts apko wahi bata sakte hain.

                  Kuch common candlestick patterns hain jo traders istemal karte hain apni trading decisions ke liye. For example, ek bullish engulfing pattern jab ek chhote candlestick ko ek bara bullish candle engulf karta hai, ye ek uptrend ka signal ho sakta hai. Ek doosra popular pattern hai doji, jo ke aik chhota sa candlestick hai jiska open aur close price aapas mein barabar hota hai. Ye indecision ko dikhata hai market mein aur ek reversal ke qareeb hone ka signal ho sakta hai.

                  Japanese candlestick charts ke istemal mein ahmiyat yeh bhi hai ke yeh traders ko entry aur exit points ka idea dete hain. Agar aap ek trend ki shuruaat ya phir uski khatmaat ka andaza lagana chahte hain, candlestick charts apko usmein madad kar sakte hain.

                  Magar yaad rahe, Japanese candlestick charts ke istemal mein bhi kuch limitations hain. Ye sirf ek tool hain jo ke dusri analysis techniques ke saath istemal kiya jaata hai, aur kabhi-kabhi false signals bhi de sakte hain. Isliye, traders ko candlestick patterns ko samajhna aur dusri indicators ke saath mila kar istemal karna chahiye.

                  Overall, Japanese candlestick charts ek powerful tool hain jo ke traders ko market trends aur price movements ke baare mein jald aur sahi andaza lagane mein madad karta hai. Inka istemal kar ke traders apni trading strategies ko mazeed behtar bana sakte hain aur tijarat mein kamiyabi haasil kar sakte hain.

                  • <a href="https://www.instaforex.org/ru/?x=ruforum">InstaForex</a>
                  • #10 Collapse

                    ### Japanese Candlestick
                    Japanese candlestick charting aik aisa technique hai jo traders ko market ki price movements ko samajhne aur analyze karne mein madad deti hai. Ye technique pehli dafa 17th century mein Japan mein develop hui thi, aur isay ab trading ke har hisse mein istemal kiya jata hai. Japanese candlesticks na sirf price ka level darshate hain, balki market ke mood aur sentiment ko bhi zahir karte hain.

                    Candlestick ki basic structure teen aham elements par mabni hoti hai: body, upper shadow, aur lower shadow. Body wo hissa hai jo opening aur closing price ke beech ka farq darshata hai. Agar closing price opening price se zyada hai, to body ka rang aksar green ya white hota hai, jo bullish trend ko darshata hai. Agar closing price opening price se kam hai, to body ka rang red ya black hota hai, jo bearish trend ko dikhata hai.

                    Upper shadow wo line hai jo body ke upar hoti hai aur highest price ko darshata hai, jabke lower shadow wo line hai jo body ke neeche hoti hai aur lowest price ko darshata hai. In shadows ki length market ki volatility ko darshati hai. Agar upper shadow lamba hai, to ye dikhata hai ke buyers ne price ko upar le jane ki koshish ki, lekin sellers ne unhe rok diya. Lower shadow agar lamba hai, to ye buyers ki strength ko dikhata hai.

                    Japanese candlestick patterns ka istemal market ki trends ko samajhne aur future price movements ka andaza lagane ke liye hota hai. Kuch mashhoor patterns mein Doji, Hammer, Engulfing, aur Harami shamil hain. Har pattern ka apna unique meaning hota hai, jo traders ko market ke sentiment aur possible reversals ka andaza lagane mein madad karta hai.

                    Is technique ka aik aur faida ye hai ke ye visual representation provide karti hai, jo charts ko samajhne ko asan banata hai. Traders is data ko dekh kar quickly decisions le sakte hain, jaise entry ya exit points identify karna.

                    Aakhir mein, Japanese candlestick charting ek valuable tool hai jo traders ko market ki dynamics ko samajhne aur apne trading strategies ko behtar karne mein madad deta hai. Isay seekhna aur istemal karna trading ki duniya mein aik mustahkam foundation banata hai, jo successful trading ke liye zaroori hai.

                    اب آن لائن

                    Working...
                    X