What is Leading & Lagging in Forex Trading.?

No announcement yet.
`
X
  • وقت
  • دکھائیں
Clear All
new posts
  • #1 Collapse

    What is Leading & Lagging in Forex Trading.?


    Forex trading mein "leading" aur "lagging"

    do mukhtalif types ke indicators hote hain, jo market trends ko analyze karne mein aur future price movements ko predict karne mein madad karte hain.
    1. Leading Indicators (Peshgoi Karne Wale Indicators): Leading indicators, jise peshgoi karne wale indicators bhi kaha jata hai, wo indicators hote hain jo current market conditions ko analyze karke future price movements ki prediction karne ka kaam karte hain. Ye indicators traders ko market ke potential changes ke bare mein pehle hi signal dete hain. Kuch common leading indicators hain:
      • Relative Strength Index (RSI): RSI market mein overbought ya oversold conditions ko indicate karta hai, jisse traders future price reversals ka pata laga sakte hain.
      • Stochastic Oscillator: Stochastic oscillator bhi overbought ya oversold conditions ko measure karta hai, aur traders ko market ke momentum ke changes ke bare mein peshgoi deta hai.
      • Moving Averages: Moving averages bhi ek leading indicator hai jo market trends ko smooth karta hai aur traders ko trend reversals ke signals deta hai.Click image for larger version

Name:	leading-vs-lagging-indicators_body_EURUSDleadingvslagging.png.full.png
Views:	59
Size:	23.4 کلوبائٹ
ID:	12804914

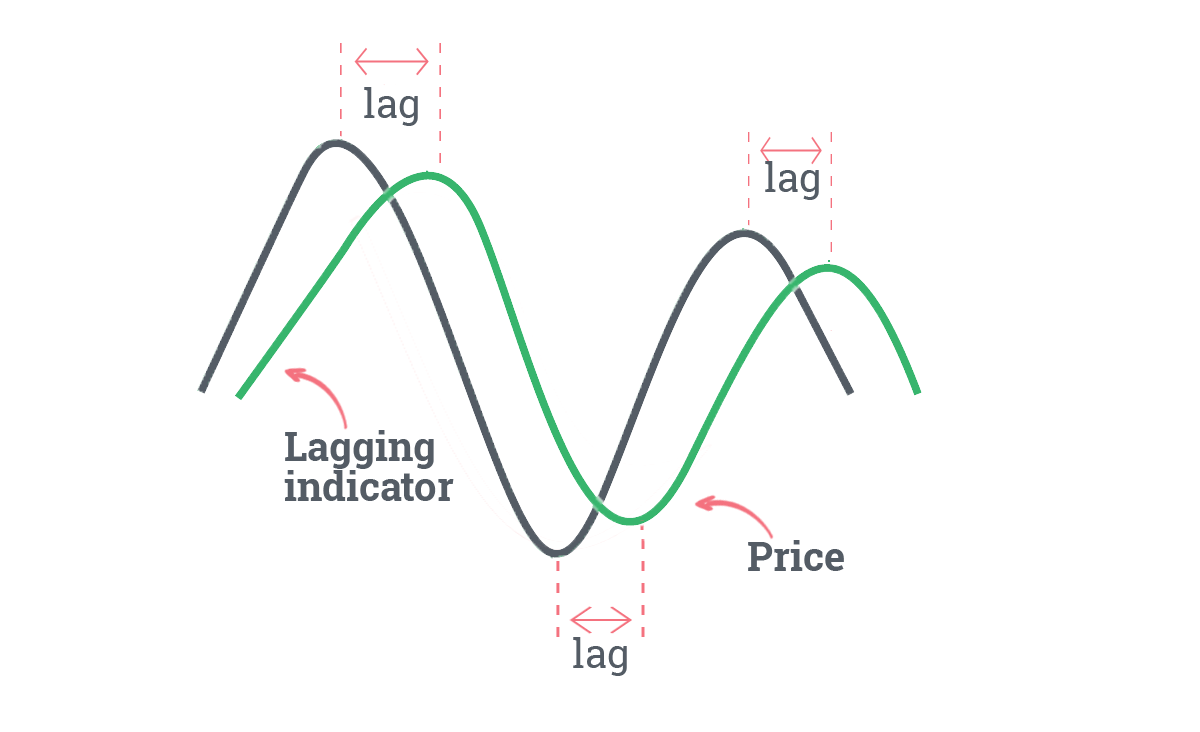
      Leading indicators ka istemal traders ko market mein hone wale changes se advance mein inform karne mein madad karta hai, lekin inki accuracy mein kabhi-kabhi uncertainty hoti hai.
    2. Lagging Indicators (Hatif Indicators): Lagging indicators, jise hatif indicators bhi kaha jata hai, wo indicators hote hain jo current market conditions ko reflect karte hain aur inki values market ke movements ke baad aati hain. Ye indicators price trends ko confirm karne mein aur already occurring trends ko identify karne mein madad karte hain. Kuch common lagging indicators hain:
      • Moving Averages (Simple and Exponential): Moving averages, jab lagging indicators ki baat hoti hai, toh inka istemal trend confirmation ke liye hota hai.
      • Bollinger Bands: Bollinger Bands volatility aur price levels ko measure karta hai, aur inka istemal lagging trends ko identify karne mein hota hai.
      • Ichimoku Cloud: Ichimoku Cloud lagging indicator hai jo support, resistance, aur trend direction ko visualize karta hai.

      Lagging indicators traders ko current market conditions ke mutabiq trend ka pata lagane mein madad karte hain. Inki limitation ye hoti hai ke ye future movements ko predict karne mein thoda time lete hain, kyun ki inki values current market data ke peechhe rehti hain.

    Dono types ke indicators ka sahi taur par istemal karke traders apni trading strategies ko develop karte hain. Hamesha yaad rahe ke kisi bhi indicator ka istemal karne se pehle thorough research karna zaroori hai aur ek overall trading plan ke saath inka istemal karna chahiye.

  • <a href="https://www.instaforex.org/ru/?x=ruforum">InstaForex</a>
  • #2 Collapse


    Forex trading mein, "leading" aur "lagging"

    terms hote hain jo market indicators aur signals ke characteristics ko describe karne mein istemal hote hain.

    Leading Indicators: Leading indicators, market ke future movements ke barabar mein agah karne ka kaam karte hain. Yeh indicators market trends ya reversals ke pehle hi signals provide karte hain, lekin inki accuracy mei uncertainty rehti hai. Kuch leading indicators mein shamil hote hain:
    1. Relative Strength Index (RSI): RSI market mein overbought ya oversold conditions ko pehchanne mein madad karta hai, jisse traders future price reversals anticipate kar sakte hain.
    2. Stochastic Oscillator: Yeh bhi overbought aur oversold conditions ko darust karta hai, aur price trends ke reversals ko predict karne mein help karta hai.
    3. Moving Averages: Certain types of moving averages, jaise ki exponential moving averages (EMA), traders ko market trends ke direction aur momentum ka pata lagane mein madad karte hain.
    Click image for larger version

Name:	Capture.PNG
Views:	56
Size:	271.0 کلوبائٹ
ID:	12804976
    Lagging Indicators: Lagging indicators, market movements ko confirm karne mein aur trend ke peeche jaane mein madad karte hain. In indicators ka istemal karke traders past price data ke basis par decisions lete hain. Kuch lagging indicators mein shamil hote hain:
    1. Moving Averages (Simple Moving Average - SMA): SMA lagging indicator bhi hota hai, kyun ki yeh past price data par adharit hota hai aur current price trends ko confirm karta hai.
    2. Bollinger Bands: Yeh bands volatility aur price range ko darust karte hain, lekin inka istemal karke traders current market conditions ka pata lagate hain.
    3. Ichimoku Cloud: Ichimoku lagging indicator hai, jo past price data aur future price trends ko analyze karta hai.

    Leading aur lagging indicators ka sahi mix ka istemal traders ke trading strategies par depend karta hai. Kuch traders prefer karte hain ki unke paas leading indicators ho taki woh future movements ko predict kar sakein, jabki doosre traders lagging indicators ka istemal karte hain taki unhe confirmations mil sakein. Har trader apne risk tolerance, trading style, aur market conditions ke hisab se apne indicators ko chunta hai.

    • #3 Collapse


      Leading aur Lagging in Forex Trading (Forex Tijarat Mein Pesh Goad aur Dabe Huye Asarat):

      Forex trading mein, leading aur lagging terms hote hain jo market trends aur indicators ke taalluqat ko describe karte hain. In dono concepts ka samajhna traders ke liye ahem hai, taake woh sahi waqt par sahi trading decisions le sakein.

      Leading Indicators (Pesh Goad Asarat):

      Leading indicators wo hote hain jo market ke future movements ko pehle hi indicate karte hain. Yeh asarat market ke aane wale changes ke pesh-khwab hote hain aur traders ko future ke possible trends ya price movements ke baare mein agah karte hain. Kuch leading indicators mein shaamil hote hain:
      1. Momentum Indicators: Jaise ke Relative Strength Index (RSI) aur Stochastic Oscillator, jo market mein momentum ko measure karte hain.
      2. Oscillators: Jaise ke Moving Average Convergence Divergence (MACD), jo ke market trend changes ko advance mein dikhane mein madad karte hain.
      3. Volume Analysis: Trading volume ko analyze kar ke future price movements ke possibilities ko samajhne mein madad karte hain.

      Leading indicators ka istemal traders ko future ke price movements ke bare mein pehle hi malumat dete hain, lekin inki accuracy mein kabhi-kabhi masail aajate hain. Kyunki market mein kai factors shamil hote hain, leading indicators hamesha sahi nahi hote.

      Lagging Indicators (Dabe Huye Asarat):

      Lagging indicators, ya trend-following indicators, wo hote hain jo market ke past movements ko reflect karte hain. Yeh asarat thorey der baad market ke actual changes ko darust taur par dikhate hain. Kuch lagging indicators mein shaamil hote hain:
      1. Moving Averages: Simple Moving Averages (SMA) aur Exponential Moving Averages (EMA) lagging indicators hote hain jo past prices ki average values ko dekhte hain.
      2. Bollinger Bands: Yeh bands lagging indicators hote hain jo volatility aur price range ko represent karte hain.
      3. Parabolic SAR: Is lagging indicator ka istemal trend ke direction ko samajhne ke liye kiya jata hai.

      Lagging indicators ka istemal kar ke traders past performance ko analyze karke future ki trends aur movements ko predict karne ki koshish karte hain. In indicators ka faida ye hai ke unki information zyadatar reliable hoti hai, lekin woh information thorey der baad milti hai.

      Conclusion:

      Leading aur lagging indicators dono hi forex trading mein ahem role ada karte hain. Traders ko chahiye ke woh in indicators ka sahi taur par istemal karain aur unke limitations ko samajh kar apne trading decisions ko improve karein. Is tarah se, unhe market movements ko samajhne aur sahi waqt par entry aur exit points tay karne mein madad milegi.

      • #4 Collapse


        Leading aur Lagging Indicators in Forex Trading:

        Forex trading mein, leading aur lagging indicators dono technical analysis tools hote hain jo traders ko market trends aur potential entry/exit points ke liye madad karte hain. In dono ka istemal market ka direction samajhne mein aur trading strategies banane mein hota hai.

        Leading Indicators:

        Leading indicators un tools ko refer karte hain jo market ke future movements ko predict karne mein madad karte hain. Yeh indicators market ke momentum aur trend changes ko pehle se hi show karte hain, isliye inhe "leading" kaha jata hai. Kuch popular leading indicators mein shaamil hain:
        1. Relative Strength Index (RSI): RSI market mein overbought ya oversold conditions ko indicate karta hai, jo future price reversals ka sign ho sakta hai.
        2. Stochastic Oscillator: Stochastic market mein momentum ko measure karta hai aur overbought ya oversold conditions ko identify karta hai.
        3. Moving Averages: Moving averages bhi leading indicators hote hain jo market trends ko smooth karke dikhate hain. Golden cross aur death cross jaise signals future price movements ko indicate kar sakte hain.
        4. MACD (Moving Average Convergence Divergence): MACD bhi momentum aur trend changes ko identify karta hai.
        Click image for larger version

Name:	ADE8C26B-86CC-4F77-87E7-E6D7EEFCE56F.jpeg
Views:	52
Size:	180.8 کلوبائٹ
ID:	12805074
        Leading indicators ke istemal se traders try karte hain ki future price movements ko pehle se anticipate kar sakein, lekin yeh kabhi-kabhi false signals bhi generate kar sakte hain.

        Lagging Indicators:

        Lagging indicators opposite hote hain; yeh past price movements ko reflect karte hain aur market ke current state ko describe karte hain. Inhe "lagging" isliye kaha jata hai kyunki yeh current trend ya reversal ko indicate karne mein thoda sa deri karte hain. Kuch lagging indicators mein shaamil hain:
        1. Moving Averages (Simple aur Exponential): While moving averages bhi leading indicators hote hain, lekin unka istemal lagging trend ko confirm karne mein bhi hota hai.
        2. Bollinger Bands: Bollinger Bands current price volatility ko measure karte hain aur potential trend reversals ko indicate kar sakte hain.
        3. Parabolic SAR (Stop and Reverse): Parabolic SAR price ke movement ke saath move karta hai aur trend changes ko identify karta hai.

        Lagging indicators ka istemal current market conditions aur trends ko confirm karne ke liye hota hai. Yeh indicators help karte hain ki traders sahi samay par enter aur exit karein.

        Conclusion:

        Leading aur lagging indicators dono ka istemal ek saath kiya ja sakta hai, taki traders ko market ke different aspects ka sahi analysis ho sake. Har indicator ka apna ek role hota hai, aur traders ko apne risk tolerance ke hisab se inka istemal karna chahiye.

        • #5 Collapse

          What is Leading & Lagging in Forex Trading.?

          Click image for larger version

Name:	download (11).jpg
Views:	53
Size:	9.0 کلوبائٹ
ID:	12805092
          Leading and lagging indicators are terms commonly used in the field of forex trading to describe different types of technical analysis tools. These indicators are essential for traders to analyze and interpret market trends, make informed decisions, and devise effective trading strategies. In the context of forex trading, leading and lagging indicators serve distinct purposes and provide valuable insights into the market's behavior.

          Leading Indicators (Peshgoi Indicators):

          Leading indicators are tools that attempt to forecast future price movements in the forex market. They provide early signals about potential changes in the direction of the market before they actually occur. Traders use leading indicators to gain a predictive edge and make timely decisions to enter or exit positions. These indicators are considered proactive in nature, as they attempt to anticipate market trends.

          One commonly used leading indicator is the Moving Average Convergence Divergence (MACD). MACD is calculated by subtracting the 26-period Exponential Moving Average (EMA) from the 12-period EMA. The resulting value is then plotted on a chart, along with a signal line (usually a 9-period EMA). Traders interpret the MACD line crossing above or below the signal line as a potential signal of a trend reversal.

          Another leading indicator is the Relative Strength Index (RSI), which measures the speed and change of price movements. RSI values range from 0 to 100, and a reading above 70 typically suggests that an asset may be overbought, signaling a potential reversal. Conversely, an RSI reading below 30 may indicate that an asset is oversold, suggesting a potential upward reversal.

          While leading indicators can provide valuable insights into potential trend reversals, it's important for traders to exercise caution. False signals are not uncommon, and relying solely on leading indicators without considering other factors may lead to suboptimal trading decisions.

          Lagging Indicators (Dairi Indicators):

          Lagging indicators, as the name suggests, follow price movements and provide confirmation of a trend after it has already begun. These indicators are reactive and are often used to confirm the validity of a trend rather than predict its future direction. Lagging indicators are also known as trend-following indicators.

          One of the most widely used lagging indicators is the Simple Moving Average (SMA). The SMA calculates the average price of an asset over a specified period, providing a smoothed trend line. Traders often use the crossover of different SMA periods to confirm the beginning or continuation of a trend. For example, a golden cross, where a shorter-term SMA crosses above a longer-term SMA, may indicate the start of an upward trend.

          The Moving Average Convergence Divergence (MACD), which was mentioned earlier as a leading indicator, also has a lagging component. The MACD histogram, derived from the MACD line and signal line, represents the difference between the two. Traders often look at the MACD histogram to confirm the strength of a trend.

          Lagging indicators are particularly useful for identifying the momentum and sustainability of a trend. However, by their nature, they may not provide signals as early as leading indicators. Traders who rely on lagging indicators often combine them with leading indicators and other analysis tools for a more comprehensive view of the market.

          Choosing the Right Mix:

          Effective forex trading often involves using a combination of leading and lagging indicators, along with other forms of technical and fundamental analysis. Traders need to strike a balance between gaining early signals and confirming the validity of those signals to make well-informed decisions.

          It's essential for traders to understand the strengths and limitations of each type of indicator and consider the broader market context. Economic indicators, news events, and geopolitical developments can also influence currency prices and should be taken into account when developing a trading strategy.

          Successful traders often use a holistic approach, incorporating multiple indicators and analysis methods to build a robust trading strategy. Additionally, risk management practices, such as setting stop-loss orders and maintaining a disciplined approach to position sizing, are crucial for long-term success in the forex market.

          In conclusion, leading and lagging indicators play vital roles in forex trading by providing insights into market trends and potential reversal points. While leading indicators aim to forecast future price movements, lagging indicators confirm the direction of a trend after it has begun. Traders must carefully select and combine these indicators, considering their strengths and weaknesses, to develop effective trading strategies. Additionally, staying informed about economic and geopolitical factors that impact currency markets is essential for making well-rounded trading decisions.


          • #6 Collapse

            -:Forex me Leading & Lagging:-

            Forex trading mein "leading" aur "lagging" indicators do alag tarah ke technical analysis tools hain jo traders ko market movements ka insight dene mein madad karte hain.


            -:Forex me Leading & Lagging K Indicators:-
            1. Leading Indicators:
              • Leading indicators attempt to predict future price movements before they actually occur. These indicators are considered to provide early signals of potential trend reversals or continuations.
              • Examples of leading indicators include oscillators like the Relative Strength Index (RSI), Stochastic Oscillator, and Moving Average Convergence Divergence (MACD).
              • Leading indicators are popular among traders who want to identify potential turning points in the market and take positions before the actual price movement occurs.
            2. Lagging Indicators:
              • Lagging indicators, on the other hand, follow price movements and provide confirmation of a trend after it has already started. They are also known as "momentum" indicators.
              • Examples of lagging indicators include moving averages, Bollinger Bands, and the Average True Range (ATR).
              • Lagging indicators are often used to confirm the strength of an existing trend or to identify potential reversal points after a trend has been established.
            It's important to note that no single indicator can guarantee success in trading, and traders often use a combination of leading and lagging indicators along with other analysis techniques to make informed decisions. Additionally, market conditions can change, and what works in one situation may not work in another, so traders should always be adaptable and consider multiple factors when making trading decisions.

            -:Forex me Leading & Lagging K Indicator Forex K Context me:-

            Leading Indicators:
            1. Relative Strength Index (RSI): Haal ki price changes ki miqdar ko napta hai taki overbought ya oversold conditions ka pata lag sake, jisse potential reversals ka pata chalta hai.
            2. Stochastic Oscillator: Overbought ya oversold conditions ko identify karta hai, jab ek currency pair ki closing price ko uske specific period ke price range ke sath mukabla karta hai.
            3. Moving Average Convergence Divergence (MACD): Do moving averages se bana hota hai, jo ek trend ki strength, direction, momentum, aur duration ko identify karne mein madad karta hai.

            Lagging Indicators:
            1. Moving Averages: Simple Moving Averages (SMA) aur Exponential Moving Averages (EMA) aam taur par istemal hote hain price data ko smooth karne aur trends ko identify karne ke liye.
            2. Bollinger Bands: Ek middle band hota hai jo ek SMA hota hai, aur upper/lower bands standard deviations ko represent karte hain, jisse volatility aur potential reversal points ka pata chalta hai.
            3. Average True Range (ATR): Market volatility ko measure karta hai, high aur low prices ke darmiyan ke range ko consider karke, jisse potential trend changes ka pata chalta hai.

            Gaur Karne Wale Points:
            • Confirmation: Traders aksar lagging indicators ka istemal leading indicators ke signals ko confirm karne ke liye karte hain, trading decisions lene se pehle.
            • Timeframes: Indicator ka asar timeframe par depend karta hai. Kuch indicators short-term trading ke liye behtar kaam karte hain, jabki doosre lambe-term trends ke liye zyada suitable hote hain.
            • Risk Management: Koi bhi indicator 100% safalta nahi guarantee karta, is liye risk management bahut zaroori hai. Traders ko indicators ke saath sahi risk-reward ratios aur stop-loss orders ka istemal karna chahiye.
            • Market Conditions: Alag-alag market conditions mein alag indicators behtar kaam kar sakte hain. Traders ko ye dekhkar apne strategies ko adjust karna chahiye ke market range-bound hai, trend kar raha hai, ya zyada volatility hai.
            • Technical aur Fundamental Analysis: Technical indicators ke saath fundamental analysis ko combine karna market ke comprehensive view ko provide karta hai.
            • #7 Collapse

              What is Leading & Lagging in Forex Trading
              Click image for larger version

Name:	leading-vs-lagging-indicators_body_EURUSDleadingvslagging.png.full.png
Views:	52
Size:	23.4 کلوبائٹ
ID:	12805141
              Forex trading mein "leading" aur "lagging" terms technical analysis mein istemal hoti hain, jo ke market trends ko analyze karne ke liye istemal hoti hain. Yeh terms market indicators ko describe karne ke liye istemal hote hain.

              Leading Indicators (Peshgoi Indicators):

              Leading indicators woh indicators hote hain jo market trends ko predict karne mein madad karte hain. Yeh traders ko future price movements ke bare mein peshgoi (forecast) karne mein madad karte hain.
              Examples include oscillators like the Relative Strength Index (RSI), Moving Average Convergence Divergence (MACD), and Stochastic Oscillator. In Roman Urdu, inhe "peshgoi indicators" ya "aguwaaiyati asharaat" kehte hain.
              Lagging Indicators (Hatte Hue Indicators):

              Lagging indicators woh indicators hote hain jo market trends ko confirm karne mein istemal hote hain. Yeh indicators market ke peechay (lag) rehte hain, is liye inhe confirmatory indicators bhi kaha jata hai.
              Examples include moving averages and trend lines. In Roman Urdu, inhe "hatte hue indicators" ya "muwafiq asharaat" kehte hain.
              Forex traders in indicators ka istemal kar ke market analysis karte hain, taki woh trading decisions behtar tor par le saken. Leading indicators se traders ko pata chalta hai ke market kis direction mein ja sakti hai, jabke lagging indicators confirm karte hain ke trend mein kisi badalawat ka pata chal raha hai.

              Yeh zaroori hai ke traders in indicators ko sahi tarah se samajhain aur unka istemal achi tarah se karein, kyunki sirf indicators par poora bharosa kar ke trading karna risky ho sakta hai. Market conditions ka bhi dhyan rakhna important hai.
              • #8 Collapse

                Leading aur Lagging Indicators, technical analysis mein istemal hone wale do mukhtalif tareeqon ko darust karte hain jinse market trends ka pata lagaya ja sakta hai, in kay kuch characteristics aur details yeh hain,

                1. Leading Indicator:

                Leading indicator, future price movements ko predict karne mein madad karta hai. Ye trend reversals ko pehle se indicate karta hai,

                2. Lagging Indicator:

                Lagging indicator, price movements ke peechay reh jata hai aur market trends ko confirm karta hai. Ye past price data ko istemal karta hai,

                3. Leading Indicator Ki Tafseelat:

                Leading indicators mein kuch popular tools hain jaise ke RSI (Relative Strength Index), Stochastic Oscillator, aur MACD (Moving Average Convergence Divergence). In indicators ki madad se traders future trends ko anticipate kar sakte hain,

                4. Lagging Indicator Ki Tafseelat:

                Lagging indicators mein moving averages, Bollinger Bands, aur MACD bhi shamil hain. Ye tools price movements ko analyze karte hain jo pehle se ho chuke hain,

                Click image for larger version

Name:	images(9).jpg
Views:	52
Size:	23.1 کلوبائٹ
ID:	12805157

                5. Application mein Farq:

                Leading indicators future trends ko pehle se indicate karte hain, jab ke lagging indicators past trends ko confirm karte hain. Leading indicators proactive approach dete hain, jab ke lagging indicators reactive hote hain,

                6. Market Volatility ka Impact:

                Leading indicators market volatility ko measure karte hain aur zyadatar volatile markets mein kaam karte hain. Lagging indicators stable markets mein zyada reliable ho sakte hain,

                7. Multiple Indicators ka Istemal:

                Aksar traders ek sath leading aur lagging indicators ka istemal karte hain taki unhe ek comprehensive view mil sake. Isse false signals ka khatra kam hota hai aur market trends ka sahi andaza lagaya ja sakta hai,

                8. Conclusion:

                Leading aur lagging indicators dono hi technical analysis mein ahem hai aur traders ko market trends ko samajhne mein madad karte hain. Har indicator ka apna ek role hai aur inka sahi istemal karke traders apne trading strategies ko refine kar sakte hain. Lekin, hamesha dhyan rahe ke koi bhi indicator 100% accurate nahi hota aur market mein risk ka hona ek natural element hai. Isliye, har trading decision ko dhyan se lena aur proper risk management ka istemal karna zaruri hai.

                ​​​​​
                • #9 Collapse

                  What is Leading & Lagging in Forex Trading.?
                  Click image for larger version

Name:	download (61).png
Views:	50
Size:	7.5 کلوبائٹ
ID:	12805187
                  Leading aur Lagging indicators forex trading mein istemal hone wale do mukhtalif qisam ke tajaweez hain jo market ke halat aur trend ki pehchan mein madad karte hain. In indicators ka istemal traders ko future price movements ke bare mein malumat hasil karne mein madad karta hai. Yeh indicators market analysis ke liye istemal hotay hain aur traders ko trading decisions mein rehnumai detay hain.

                  Leading Indicators:

                  Leading indicators wo hote hain jo market ke future movements ko pehle se hi indicate karte hain. Yeh indicators market ke agay hone wale changes ko advance mein dikhate hain, lekin inn ki guarantee nahi hoti ke future mein bhi wahi hoga jo in indicators ne suggest kiya hai. In indicators mein shamil hote hain:
                  1. Relative Strength Index (RSI): RSI market mein mojood securities ki strength aur weakness ko measure karta hai. Is indicator ki madad se traders ye samajh sakte hain ke kisi currency pair ya anya trading instrument mein kitna momentum hai. RSI values 0 se 100 ke darmiyan hoti hain, jahan 70 se upar ki values overbought conditions ko darust karti hain aur 30 se nichle values oversold conditions ko indicate karti hain.
                  2. Stochastic Oscillator: Stochastic Oscillator bhi market mein momentum ko measure karta hai. Yeh indicator overbought aur oversold conditions ko bhi dikhata hai. Jaise RSI, isme bhi values 0 se 100 ke darmiyan hoti hain. Overbought conditions ko indicate karne ke liye 80 ke upper aur oversold conditions ko dikhane ke liye 20 ke neeche ki values ka istemal hota hai.
                  3. Moving Averages: Moving averages market trends ko analyze karne ke liye istemal hoti hain. Ye indicator market ke historical data par mabni hoti hai aur current prices ko uss data ke sath compare karti hai. Simple Moving Average (SMA) aur Exponential Moving Average (EMA) do mukhtalif types ki moving averages hain, jo market trends ko samajhne mein madad karte hain.

                  Lagging Indicators:

                  Lagging indicators wo hote hain jo market ke past movements ko reflect karte hain. Yeh indicators market ke trends ko confirm karne mein madad karte hain, lekin ye market ke agay hone wale changes ko advance mein bataane mein kam mufeed hote hain. Lagging indicators mein shamil hote hain:
                  1. Moving Averages (Again): Moving averages ko lagging indicators ki category mein bhi shamil kiya ja sakta hai, kyun ki ye past prices par mabni hoti hain. Jab ye indicator current prices ke sath match karte hain, to iska yeh matlab hai ke trend abhi tak jari hai.
                  2. Bollinger Bands: Bollinger Bands volatility aur price levels ko measure karne ke liye istemal hoti hain. Ye lagging indicator market ke volatility ko darust karti hai aur traders ko ye batati hai ke market overbought ya oversold hai ya phir stable hai.
                  3. Moving Average Convergence Divergence (MACD): MACD bhi lagging indicator hai jo market ke momentum ko measure karta hai. Isme moving averages ka istemal hota hai jisse ye market ke trends ko confirm karte hain. MACD ka positive aur negative values traders ko market ke direction ke bare mein malumat dete hain.

                  Leading aur Lagging indicators dono apne apne taur par ahem hote hain aur traders inko mila kar market analysis mein istemal karte hain. Leading indicators future movements ko predict karne mein madad karte hain jabke lagging indicators trends ko confirm karne mein madad karte hain. Traders ko chahiye ke in indicators ko samajh kar, market conditions ko sahi tarah se analyze karein aur trading decisions lein.


                  • #10 Collapse


                    Leading aur Lagging in Forex Trading:

                    Forex trading mein "leading" aur "lagging" do terms hain jo market trends aur price movements ko describe karne ke liye istemal hote hain. Yeh dono concepts traders ko market analysis mein madadgar sabit ho sakte hain.

                    Leading Indicators (Pesh Goadar):

                    Leading indicators wo hote hain jo market ki future movements ko predict karne mein madad karte hain. In indicators ki madad se traders try karte hain future trend changes ko pehle se identify karna. Kuch common leading indicators mein shamil hote hain:
                    1. Stochastic Oscillator: Price ki current position ko compare karke overbought ya oversold conditions ko show karta hai, jo future price movements ka hint deta hai.
                    2. Relative Strength Index (RSI): Market mein mojood buying aur selling pressure ko measure karta hai, aur overbought ya oversold levels ko display karta hai.
                    3. Moving Averages: Different time periods ke average prices ko track karke, moving averages future trends ko forecast karne mein madad karte hain.
                    Click image for larger version

Name:	f-1-1024x736.png
Views:	44
Size:	64.7 کلوبائٹ
ID:	12805571
                    Leading indicators ka istemal karke traders try karte hain ki future price movements ko pehle se anticipate karein, lekin inki accuracy mein hamesha kuch uncertainty hoti hai.

                    Lagging Indicators (Lambe Ho Jane Wale Goadar):

                    Lagging indicators, ya trend-following indicators, wo hote hain jo market ke peechay ja kar existing trends ko confirm karte hain. Yeh indicators price movements ko reflect karte hain jo pehle ho chuke hote hain. Kuch common lagging indicators mein shamil hote hain:
                    1. Moving Averages (Simple ya Exponential): In indicators ki madad se traders recent price movements ko track karte hain aur current trend ko identify karte hain.
                    2. Bollinger Bands: Price volatility ko measure karke, Bollinger Bands market trend ke strength aur direction ko show karte hain.
                    3. MACD (Moving Average Convergence Divergence): Short-term aur long-term moving averages ke convergence aur divergence ko track karke, MACD trend changes ko identify karta hai.

                    Lagging indicators ki khasiyat hai ke yeh market trends ko confirm karte hain, lekin inka drawback yeh hai ke yeh thoda late response dete hain kyunki yeh already hui movements ko reflect karte hain.

                    Ikhtitami Raay:

                    Leading aur lagging indicators ka sahi istemal karke traders apne trading strategies ko improve kar sakte hain. Hamesha yaad rahe ke koi bhi indicator 100% guarantee nahi deta, is liye risk management ka bhi khayal rakhein aur doosre market factors ko bhi consider karein.

                    • #11 Collapse

                      Forex market mein, leading aur lagging indicators market trends ka analysis karte hain, trading decisions banane mein madadgar hote hain, aur effective trading strategies develop karne mein ahem hote hain.

                      Leading Indicators
                      Leading indicators wo tools ya signals hote hain jo potential future price movements ka andaza dete hain. Inhe leading is liye kaha jata hai kyunki ye aksar actual price movements se pehle direction change karte hain, jo ke trends ko forecast karne ke liye ahem hote hain. Traders leading indicators ka istemal karte hain market shifts ko anticipate karne aur uske mutabiq positions lenay mein. Niche kuch aam leading indicators ke examples hain:
                      1. Relative Strength Index RSI: RSI ek momentum oscillator hai jo price movements ki tezi aur tabdeeli ko napta hai. Ye 0 se 100 tak ka range hota hai aur overbought ya oversold conditions ko identify karne mein madadgar hota hai. Traders aksar RSI aur price movements ke darmiyan farq ko dekhte hain taake reversals ko predict kar sakein.
                      2. Stochastic Oscillator: RSI ke jaisa, stochastic oscillator bhi overbought aur oversold conditions ko identify karne mein madad karta hai. Ismein do lines hoti hain, %K aur %D, aur traders crossovers aur divergences ko use karte hain taake price reversals ko predict kar sakein.
                      3. Moving Averages: Moving averages jese ke Simple Moving Average SMA ya Exponential Moving Average EMA, trend-following indicators hote hain jo price fluctuations ko smooth out karne mein madad karte hain. Traders different moving averages ke crossovers ko dekhte hain taake potential trend changes ko identify kar sakein.
                      4. MACD Moving Average Convergence Divergence: MACD ek versatile indicator hai jo moving averages ko combine karke trend momentum changes ko identify karta hai. Traders MACD ke crossovers aur divergences ko analyze karte hain taake price movements ko anticipate kar sakein.
                      5. Bollinger Bands: Bollinger Bands ek moving average aam tor par SMA aur upper/lower bands se mil kar bante hain jo volatility levels ko represent karte hain. Traders Bollinger Bands ka istemal overbought ya oversold conditions aur potential breakouts ko identify karne mein karte hain.
                      6. Volume Indicators: Volume indicators jese ke On-Balance Volume OBV ya Chaikin Money Flow CMF trading volume ko measure karne ke liye hote hain taake market ki strength ko assess kiya ja sake. Barhne wala volume aksar price movements se pehle ata hai, jisse ye leading indicators hote hain.


                      Lagging Indicators
                      Lagging indicators, dusri taraf, wo tools ya signals hote hain jo price movements ko follow karte hain aur trends ko confirm karte hain jo pehle se shuru ho chuke hote hain. Inhe "lagging" is liye kaha jata hai kyunki inke signals price movements ke baad aate hain, jo ke existing trends ki strength ko validate karne ke liye kaam aate hain. Traders lagging indicators ka istemal trend confirmation ke liye karte hain. Niche kuch aam lagging indicators ke examples hain:
                      1. Moving Average Convergence Divergence MACD Signal Line: Jabki MACD khud ek leading indicator hai, uska signal line MACD ka EMA ek lagging indicator hai jo MACD histogram ke signals ko confirm karta hai.
                      2. Moving Averages Support/Resistance ke Tor Par: Jabki moving averages certain contexts mein leading indicators ho sakte hain, unhe aksar lagging indicators ke tor par istemal kiya jata hai jab traders dynamic support ya resistance levels ko analyze karte hain.
                      3. Parabolic SAR Stop and Reverse: Parabolic SAR ek trend-following indicator hai jo stop-loss levels provide karta hai. Ye price movements ko follow karta hai aur jab trend reverse hota hai to flip ho jata hai, jo ke trend confirmation ke liye lagging indicator hai.
                      4. Ichimoku Cloud: Ichimoku Cloud multiple components jese ke Kumo, Tenkan-sen, aur Kijun-sen se mil kar banta hai jo support/resistance levels aur trend direction ke bare mein information provide karte hain. Traders cloud ke signals ka istemal karte hain taake trends ko confirm kar sakein.
                      5. ADX Average Directional Index: ADX trend ki strength ko measure karta hai lekin direction ko indicate nahi karta. Traders ADX ko aur indicators ke sath use karte hain taake confirm kar sakein ke trend strong hai ya weakening hai.
                      6. Volume Weighted Average Price VWAP: VWAP trading volume ke sath weighted average price calculate karta hai. Ye traders ke liye useful hai taake asset ka fair value assess kiya ja sake aur ye dekha ja sake ke current price is average se upar ya neeche hai.
                      Use Leading and Lagging Indicators
                      Traders apni technical analysis mein leading aur lagging indicators ka combination use karte hain taake informed trading decisions le sakein. Yahan kuch tareeqe hain jinhe traders typically in indicators ka istemal karte hain:
                      1. Trends Confirmation: Lagging indicators trends ko confirm karne ke liye valuable hote hain jo leading indicators dwara identify kiye gaye hote hain. For example, agar RSI divergence ek potential reversal suggest karta hai, to traders MACD signal line se confirmations ka wait karte hain.
                      2. Entry and Exit Points: Leading indicators entry points ko identify karne ke liye use hote hain, jabki lagging indicators exit points ko determine karne ya trends ki continuation ko validate karne mein madadgar hote hain. Traders aksar RSI leading aur moving averages lagging ka combination use karte hain apne trades ko effectively time karne ke liye.
                      3. Risk Management: Lagging indicators jese support/resistance levels jo moving averages ya trendlines se identify kiye jate hain, risk management aur stop-loss/take-profit levels set karne mein ahem role play karte hain. Ye traders ko risk manage karne aur apna capital protect karne mein madad karte hain.
                      4. Trend Strength Assessment: Leading indicators jese volume-based indicators masalan OBV, CMF trend ki strength ko signal karte hain, jabki lagging indicators jese ADX trend ki strength ko confirm karte hain. Ye information trend-following strategies ke liye vital hoti hai.
                      5. Market Reversals: Leading indicators aksar market reversals ko anticipate karne ke liye istemal hote hain, jabki lagging indicators in reversals ko confirm karte hain. Traders potential reversals ko spot karne ke liye Stochastic Oscillator leading aur Parabolic SAR lagging ka combination istemal karte hain.
                      6. Divergence Analysis: Leading indicators jese RSI ya MACD commonly divergence analysis ke liye istemal hote hain, jahan price movements aur indicator readings ke darmiyan farq ko signals potential trend changes ke liye dekha jata hai. Lagging indicators ye divergence signals ko confirm karte hain.


                      Leading aur lagging indicators Forex trading mein complementary roles play karte hain. Leading indicators future price movements ko anticipate karne aur potential trading opportunities ko identify karne mein madadgar hote hain, jabki lagging indicators trends ko confirm karte hain, signals ko validate karte hain, aur risk management mein madad karte hain. Traders aksar in indicators ka combination apni technical analysis mein use karte hain taake well-informed trading decisions le sakein aur Forex market ke complexities ko effectively navigate kar sakein.
                      Believe in yourself and your abilities. When you fight for your dreams, you can achieve anything.
                      • #12 Collapse

                        **Leading Aur Lagging Indicators Forex Trading Mein Kya Hote Hain?**
                        Forex trading mein indicators ka use market analysis ko enhance karne aur trading decisions ko improve karne ke liye hota hai. Indicators do main categories mein divide kiye ja sakte hain: leading aur lagging. Dono types ke indicators market trends aur price movements ko predict karne mein madad karte hain, lekin inka approach aur functionality alag hota hai. Yahan leading aur lagging indicators ke features aur unke use karne ka tareeqa detail mein explain kiya gaya hai:

                        1. **Leading Indicators**:
                        - **Definition**: Leading indicators wo tools hain jo market ke future movements ko predict karne ki koshish karte hain. Yeh indicators price movements ke pehle signals provide karte hain aur trend reversals ko anticipate karne mein madad karte hain.
                        - **Characteristics**: Leading indicators generally market ke turning points aur potential trend changes ko identify karne mein madad karte hain. Yeh indicators aapko early signals dete hain jisse aap trade positions ko timely adjust kar sakte hain.
                        - **Examples**:
                        - **Relative Strength Index (RSI)**: RSI ek momentum oscillator hai jo market ke overbought aur oversold conditions ko measure karta hai. Yeh market ke potential reversal points ko predict karne mein madad karta hai.
                        - **Stochastic Oscillator**: Stochastic oscillator market ke overbought aur oversold levels ko identify karta hai aur potential trend reversals ko signal karta hai.

                        2. **Lagging Indicators**:
                        - **Definition**: Lagging indicators wo tools hain jo market trends aur price movements ko confirm karne ke liye use kiye jate hain. Yeh indicators price changes ke baad signals provide karte hain aur trends ko confirm karne mein madad karte hain.
                        - **Characteristics**: Lagging indicators generally trend-following hote hain aur market trends ko confirm karne ke liye use kiye jate hain. Yeh indicators market ke current state ko accurately reflect karte hain aur trends ke continuation ko validate karte hain.
                        - **Examples**:
                        - **Moving Averages (MA)**: Moving Averages price trends ko smooth karte hain aur trend direction ko identify karte hain. Simple Moving Average (SMA) aur Exponential Moving Average (EMA) lagging indicators hain jo market trends ko confirm karte hain.
                        - **Moving Average Convergence Divergence (MACD)**: MACD ek trend-following aur momentum indicator hai jo moving averages ke beech ke difference ko calculate karta hai. MACD line aur signal line ke crossovers trend changes ko confirm karte hain.

                        3. **Leading Aur Lagging Indicators Ka Use**:
                        - **Combination**: Effective trading strategies mein leading aur lagging indicators ka combination use kiya jata hai. Leading indicators early signals provide karte hain, jabke lagging indicators trends ko confirm karte hain. Is combination se traders ko zyada accurate aur reliable trading signals milte hain.
                        - **Confirmation Aur Timing**: Leading indicators ko trade entry points ke liye use kiya jata hai, jabke lagging indicators trade confirmation aur trend continuation ko validate karne ke liye use kiye jate hain. Yeh approach market ki movements aur price trends ko accurately analyze karne mein madad karti hai.

                        4. **Risk Management**:
                        - **Stop-Loss Aur Take-Profit**: Leading aur lagging indicators ka use karte waqt stop-loss aur take-profit orders ko set karna zaroori hai. Yeh risk management tools aapko losses ko limit karne aur profits ko secure karne mein madad karte hain.

                        Leading aur lagging indicators Forex trading mein critical roles play karte hain. Inka effective use market trends ko accurately analyze karne aur trading decisions ko optimize karne mein madad karta hai. Indicators ke combination aur unke signals ko samajh kar, aap trading strategies ko enhance kar sakte hain aur market movements ka behtar faida utha sakte hain.
                        • #13 Collapse

                          **What is Leading & Lagging in Forex Trading?**
                          Forex trading mein, leading aur lagging indicators do mukhtalif tareeqay hain jinhain traders apni trading strategy bananay mein istemal karte hain. Yeh indicators market ki movement ko predict karne mein madad karte hain, lekin inka istemal aur samajhna zaroori hai taake trading mein behtareen results hasil kiye ja sakein.

                          **Leading Indicators**

                          Leading indicators woh hote hain jo market ki future movement ko pehlay se indicate karte hain. Yeh indicators aapko waqt se pehlay signal dete hain ke market mein kis taraf ki movement hone wali hai. Iska matlab yeh hai ke agar aap in indicators ka sahi istemal karein, to aap market ki trend shift hone se pehlay hi apni position le sakte hain.

                          Misal ke taur par, RSI (Relative Strength Index) aur Stochastic Oscillator leading indicators hain. Yeh indicators overbought aur oversold conditions ko identify karte hain, jo ke market mein reversal ka signal de sakte hain. Yeh traders ko market mein entry ya exit ke liye waqt se pehlay madad faraham karte hain.

                          **Lagging Indicators**

                          Lagging indicators un indicators ko kehte hain jo market ki movement ke baad signal dete hain. Inka kaam yeh hota hai ke market ki trend ko confirm karen, magar yeh us waqt signal dete hain jab trend already set ho chuka hota hai. Yeh indicators un traders ke liye mufeed hain jo confirmation ke baad market mein entry ya exit karna chahte hain.

                          Misal ke taur par, Moving Averages aur MACD (Moving Average Convergence Divergence) lagging indicators hain. Yeh indicators past price data ko analyse karte hain aur trend ki direction ko confirm karte hain. Yeh traders ko trend ki stability ka pata lagane mein madad karte hain, lekin inka signal thora dair se aata hai.

                          **Leading vs Lagging Indicators**

                          Leading aur lagging indicators ka apni apni ahmiyat hai. Leading indicators jaldi signal dete hain, magar yeh kabhi kabhi false signals bhi de sakte hain. Lagging indicators market trend ko confirm karte hain, lekin inka signal thora dair se aata hai. Is liye, bohat se traders in dono indicators ko combine karke apni strategy banate hain taake unko market mein sahi direction ka pata chal sake.

                          **Conclusion**

                          Forex trading mein leading aur lagging indicators ko samajhna aur unka sahi istemal karna zaroori hai. Yeh aapko market ki future movements ka andaza lagane mein madad karte hain, aur agar aap inka sahi istemal karen, to aap apni trading strategy ko behtareen bana sakte hain. Har trader ko apni trading style ke mutabiq in indicators ko use karna chahiye taake maximum profit hasil kiya ja sake.
                          • <a href="https://www.instaforex.org/ru/?x=ruforum">InstaForex</a>
                          • #14 Collapse

                            karne wale indicators bhi kaha jata hai, wo indicators hote hain jo current market conditions ko analyze karke future price movements ki prediction karne ka kaam karte hain. Ye indicators traders ko market ke potential changes ke bare mein pehle hi signal dete hain. Kuch common leading indicators hain:Definition**: Leading indicators wo tools hain jo market ke future movements ko predict karne ki koshish karte hain. Yeh indicators price movements ke pehle signals provide karte hain aur trend reversals ko anticipate karne mein madad karte hain.
                            - **Characteristics**: Leading indicators generally market ke turning points aur potential trend changes ko identify karne mein madad karte hain. Yeh indicators aapko early signals dete hain jisse aap trade positions ko timely adjust kar sakte hain.
                            - **Examples**:
                            - **Relative Strength Index (RSI)**: RSI ek momentum oscillator hai jo market ke overbought aur oversold conditions ko measure karta hai. Yeh market ke potential reversal points ko predict karne mein madad karta hai.
                            - **Stochastic Oscillator**: Stochastic oscillator market ke overbought aur oversold levels ko identify karta hai aur potential trend reversals ko signal karta hai.

                            2. **Lagging Indicators**:
                            - **Definition**: Lagging indicators wo tools hain jo market trends aur price movements ko confirm karne ke liye use kiye jate hain. Yeh indicators price changes ke baad signals provide karte hain aur trends ko confirm karne mein madad karte hain.
                            - **Characteristics**: Lagging indicators generally trend-following hote hain aur market trends ko confirm karne ke liye use kiye jate hain. Yeh indicators market ke current state ko accurately reflect karte hain aur trends ke continuation ko validate karte hain.
                            - **Examples**:Lagging indicators, dusri taraf, wo tools ya signals hote hain jo price movements ko follow karte hain aur trends ko confirm karte hain jo pehle se shuru ho chuke hote hain. Inhe "lagging" is liye kaha jata hai kyunki inke signals price movements ke baad aate hain, jo ke existing trends ki strength ko validate karne ke liye kaam aate hain. Traders lagging indicators ka istemal trend confirmation ke liye karte hain. Niche kuch aam lagging indicators ke examples hain:
                            1. Moving Average Convergence Divergence MACD Signal Line: Jabki MACD khud ek leading indicator hai, uska signal line MACD ka EMA ek lagging indicator hai jo MACD histogram ke signals ko confirm karta hai.
                            2. Moving Averages Support/Resistance ke Tor Par: Jabki moving averages certain contexts mein leading indicators ho sakte hain, unhe aksar lagging indicators ke tor par istemal kiya jata hai jab traders dynamic support ya resistance levels ko analyze karte hain.
                            3. Parabolic SAR Stop and Reverse: Parabolic SAR ek trend-following indicator hai jo stop-loss levels provide karta hai. Ye price movements ko follow karta hai aur jab trend reverse hota hai to flip ho jata hai, jo ke trend confirmation ke liye lagging indicator hai.
                            4. Ichimoku Cloud: Ichimoku Cloud multiple components jese ke Kumo, Tenkan-sen, aur Kijun-sen se mil kar banta hai jo support/resistance levels aur trend direction ke bare mein information provide karte hain. Traders cloud ke signals ka istemal karte hain taake trends ko confirm kar sakein.
                            5. ADX Average Directional Index: ADX trend ki strength ko measure karta hai lekin direction ko indicate nahi karta. Traders ADX ko aur indicators ke sath use karte hain taake confirm kar sakein ke trend strong hai ya weakening hai.
                            6. Volume Weighted Average Price VWAP: VWAP trading volume ke sath weighted average price calculate karta hai. Ye traders ke liye useful hai taake asset ka fair value assess kiya ja sake aur ye dekha ja sake ke current price is average se upar ya neeche hai.
                            Use Leading and Lagging Indicators
                            Traders apni technical analysis mein leading aur lagging indicators ka combination use karte hain taake informed trading decisions le sakein. Yahan kuch tareeqe hain jinhe traders typically in indicators ka istemal karte hain:
                            1. Trends Confirmation: Lagging indicators trends ko confirm karne ke liye valuable hote hain jo leading indicators dwara identify kiye gaye hote hain. For example, agar RSI divergence ek potential reversal suggest karta hai, to traders MACD signal line se confirmations ka wait karte hain.
                            2. Entry and Exit Points: Leading indicators entry points ko identify karne ke liye use hote hain, jabki lagging indicators exit points ko determine karne ya trends ki continuation ko validate karne mein madadgar hote hain. Traders aksar RSI leading aur moving averages lagging ka combination use karte hain apne trades ko effectively time karne ke liye.
                            3. Risk Management: Lagging indicators jese support/resistance levels jo moving averages ya trendlines se identify kiye jate hain, risk management aur stop-loss/take-profit levels set karne mein ahem role play karte hain. Ye traders ko risk manage karne aur apna capital protect karne mein madad karte hain.
                            4. Trend Strength Assessment: Leading indicators jese volume-based indicators masalan OBV, CMF trend ki strength ko signal karte hain, jabki lagging indicators jese ADX trend ki strength ko confirm karte hain. Ye information trend-following strategies ke liye vital hoti hai.
                            5. Market Reversals: Leading indicators aksar market reversals ko anticipate karne ke liye istemal hote hain, jabki lagging indicators in reversals ko confirm karte hain. Traders potential reversals ko spot karne ke liye Stochastic Oscillator leading aur Parabolic SAR lagging ka combination istemal karte hain.
                            6. Divergence Analysis: Leading indicators jese RSI ya MACD commonly divergence analysis ke liye istemal hote hain, jahan price movements aur indicator readings ke darmiyan farq ko signals potential trend changes ke liye dekha jata hai. Lagging indicators ye divergence signals ko confirm
                            - **Moving Averages (MA)**: Moving Averages price trends ko smooth karte hain aur trend direction ko identify karte hain. Simple Moving Average (SMA) aur Exponential Moving Average (EMA) lagging indicators hain jo market trends ko confirm karte hain.
                            - **Moving Average Convergence Divergence (MACD)**: MACD ek trend-following aur momentum indicator hai jo moving averages ke beech ke difference ko calculate karta hai. MACD line aur signal line ke crossovers trend changes ko confirm karte hain.

                            3. **Leading Aur Lagging Indicators Ka Use**:
                            - **Combination**: Effective trading strategies mein leading aur lagging indicators ka combination use kiya jata hai. Leading indicators early signals provide karte hain, jabke lagging indicators trends ko confirm karte hain. Is combination se traders ko zyada accurate aur reliable trading signals milte hain.
                            - **Confirmation Aur Timing**: Leading indicators ko trade entry points ke liye use kiya jata hai, jabke lagging indicators trade confirmation aur trend continuation ko validate karne ke liye use kiye jate hain. Yeh approach market ki movements aur price trends ko accurately analyze karne mein madad karti hai.
                            • Relative Strength Index (RSI): RSI market mein overbought ya oversold conditions ko indicate karta hai, jisse traders future price reversals ka pata laga sakte hain.
                            • Stochastic Oscillator: Stochastic oscillator bhi overbought ya oversold conditions ko measure karta hai, aur traders ko market ke momentum ke changes ke bare mein peshgoi deta hai.
                            • Moving Averages: Moving averages bhi ek leading indicator hai jo market trends ko smooth karta hai aur traders ko trend reversals ke signals deta hai.
                              Leading indicators woh hote hain jo market ki future movement ko pehlay se indicate karte hain. Yeh indicators aapko waqt se pehlay signal dete hain ke market mein kis taraf ki movement hone wali hai. Iska matlab yeh hai ke agar aap in indicators ka sahi istemal karein, to aap market ki trend shift hone se pehlay hi apni position le sakte hain.

                              Misal ke taur par, RSI (Relative Strength Index) aur Stochastic Oscillator leading indicators hain. Yeh indicators overbought aur oversold conditions ko identify karte hain, jo ke market mein reversal ka signal de sakte hain. Yeh traders ko market mein entry ya exit ke liye waqt se pehlay madad faraham karte hain.

                              **Lagging Indicators**

                              Lagging indicators un indicators ko kehte hain jo market ki movement ke baad signal dete hain. Inka kaam yeh hota hai ke market ki trend ko confirm karen, magar yeh us waqt signal dete hain jab trend already set ho chuka hota hai. Yeh indicators un traders ke liye mufeed hain jo confirmation ke baad market mein entry ya exit karna chahte hain.

                              Misal ke taur par, Moving Averages aur MACD (Moving Average Convergence Divergence) lagging indicators hain. Yeh indicators past price data ko analyse karte hain aur trend ki direction ko confirm karte hain. Yeh traders ko trend ki stability ka pata lagane mein madad karte hain, lekin inka signal thora dair se aata hai.

                              **Leading vs Lagging Indicators**

                              Leading aur lagging indicators ka apni apni ahmiyat hai. Leading indicators jaldi signal dete hain, magar yeh kabhi kabhi false signals bhi de sakte hain. Lagging indicators market trend ko confirm karte hain, lekin inka signal thora dair se aata hai. Is liye, bohat se traders in dono indicators ko combine karke apni strategy banate h

                            اب آن لائن

                            Working...
                            X