What is Pivot Point in Forex Trading?
X
  • وقت
  • دکھائیں
Clear All
new posts
  • #1 Collapse

    What is Pivot Point in Forex Trading?
    Assalmualikum aj is thread me apko me Pakistan Forex trading ke ak bhot he important topic pivot point ke bare me btao ga or me umeed karta ho ke jo information me apse share kro ga wo apke knowledge me zaror izafa kare ge.

    What is Pivot Point?
    Trading strategy turning point ek technical analysis ka tareeqa hai jo market trends and potential reversals ko samajhne mein madadgar hota hai. Darmian market strategy traders as trend and support/resistance levels determine karne mein istemal hoti hai.

    Reason to Use;
    Pivot points market analysis ke liye use refinement of hote hain key price levels. In ko points calculate karne ke liye, high, low, aur closing prices of previous day ka average nikala jata he .

    Tareeqa step by step:
    Wo following steps jo is method me use hote ge wo ye he ;

    Pivot point calculation:
    Previous day ka high, low, aur closing price with pivot point ko calculate karein. Formula: Pivot Point=High+Low+Close3 Pivot Point=3High+Low+Close​

    Support aur resistance levels:
    Pivot point to the wheel, aapko supports aur levels of milenge resistance. In ko levels to calculate karne ke liye, aap more formulas istemal kar sakte hain.

    Trend Analysis:
    Agar current price pivot point se ooper hai, toh yeh bull trend ko indicate kar sakta hai. Jabki agar current price pivot point se neeche hai, toh yeh bearish trend ko darust karti hai.

    Business decisions:
    Pivot points ke istemal se aap trading decisions banate waqt support aur resistance levels ko madde nazar rakhte hain. For example, agar price pivot point se neeche ja rahi hai aur support level ko touch karti hai, toh yeh potential entry point ho sakta hai.

    Stop Loss and Take Profit levels:
    Pivot points ka istemal stop loss aur take profit levels tay karte waqt bhi hota hai. Support rakhay gaye order resistance levels to potential loss traders with bacha sakte hain.

    Multiple time frames:
    Different timeframes par pivot point ko dekhein taake aapko clear picture mile.
    Confirmation with additional indicators:
    Pivot points ko dusre technical indicators ke sath milake istemal karein for confirmation.
    Ka Dhyan Rakhein Market Conditions:
    Market conditions aur news ko madde nazar rakhein, kyunki yeh bhi pivot points par asar daal sakti hain.

    Ikhtitam (conclusion):
    Pivot trading strategy, market analysis and all round approach hai. Is strategy ko samajhne aur istemal karne ke liye practice aur discipline ki zarurat hoti hai. Hamesha market conditions ko dhyan mein rakhein aur apne business decisions ko well informed tareeqe se lein.
  • <a href="https://www.instaforex.org/ru/?x=ruforum">InstaForex</a>
  • #2 Collapse

    Assalamu Alaikum Dosto!

    Forex Pivot Points


    Pivot points ek popular technical analysis tool hain jo traders dwara market ke overall trend ko alag alag time frames mein determine karne ke liye istemal hoti hai. Ye potential support aur resistance levels ka pata lagane ke liye reference points ke roop mein kaam karte hain, jisse traders informed decisions lete hain ke trade mein kab dakhil ho ya niklein. Is article mein, hum pivot points ki tareef, inke calculation ke formulas, aur inka trading mein kaise effectively istemal karna hai, ke bare mein ghoor karenge.

    Pivot point mukhtalif time frames ke intraday high, low, aur closing prices ka average hota hai jo pichle trading day se liya gaya hota hai. Ye indicator ke liye buniyadi roop se kaam karta hai aur doosre support aur resistance levels ko project karne ke liye istemal hota hai. Ye levels wo areas ko darust karte hain jahan price ka sentiment badal sakta hai ya trends reverse ho sakte hain. Traders in levels ke relative price movements par tezi se nazar rakhte hain taake market dynamics ka andaza lagakar unki trading decisions le saken.

    Click image for larger version

Name:	images (102).png
Views:	57
Size:	21.1 کلوبائٹ
ID:	12843436

    Pivot points ka calculation karna kuch simple formulas mein hota hai. Pivot point ko determine karne ke liye sabse zyada istemal hone wala formula ye hota hai:

    Pivot Point (PP) = (High + Low + Close) / 3

    Jab pivot point calculate ho jata hai, to additional support aur resistance levels ko neeche diye gaye formulas istemal karke nikala ja sakta hai:

    First Support Level (S1) = (2 x PP) - High
    Second Support Level (S2) = PP - (High - Low)
    First Resistance Level (R1) = (2 x PP) - Low
    Second Resistance Level (R2) = PP + (High - Low)

    Ye support aur resistance levels traders ko potential price movements ke baare mein valuable insights provide karte hain. Agar price pivot point ke upar trade kar rahi hai, to ye ek bullish sentiment ko suggest karta hai, jabki pivot point ke niche trade kar rahi hai to ye bearish sentiment ko indicate karta hai.

    Pivot points din ke traders ke liye khaas taur par upyogi hote hain, kyunke ye unhe trading strategies banane ke liye quick-reference tools provide karte hain. Unlike moving averages ya oscillators, pivot points din bhar static rehte hain, jisse traders price movements ko pehle se hi anumaan laga sakein. For example, agar price pivot point ke neeche girti hai, to traders shuruaati session mein short karne ka vichar kar sakte hain. Ulta, agar price pivot point ke upar hai, to wo kharidne ke avasar dekh sakte hain. Pivot points se derive kiye gaye support levels (S1, S2) aur resistance levels (R1, R2) trades ke liye target prices ke roop mein sath hi stop-loss levels ke roop mein bhi istemal kiya ja sakta hai.

    Traders adhiktar pivot points ko doosre trend indicators ke saath combine karte hain apne trading decisions ko enhance karne ke liye. Jab ek pivot point significant moving average jaise ki 50-period ya 200-period MA, ya Fibonacci extension level ke saath milta hai, to ye support ya resistance level ko majboot karta hai, jisse ye decision-making ke liye adhik reliable ban jata hai.

    Jabki pivot points wide istemal kiye jate hain aur prabhavi ho sakte hain, lekin unka bhi kuch had tak rok hai. Ye calculations simple formulas par based hote hain aur external factors ko account nahi karte hain jo price movements ko influence kar sakte hain. Ye guarantee nahi hai ki price ruk jayegi, ulta hoga, ya pivot points ke dwara projected kiye gaye levels tak pahunchegi. Traders ko pivot points ko ek comprehensive trading plan ka hissa samajhna chahiye jo multiple indicators aur risk management strategies ko shaamil karta hai.

    Pivot points ke mukable mein, Fibonacci retracements ya extensions ek aur aam taur par istemal kiya jane wala tool hain support aur resistance levels ko identify karne ke liye. Fibonacci levels ek series of numbers par based hote hain jahan har number do pehle numbers ka sum hota hai. Traders Fibonacci retracement aur extension levels ko chart par do significant price points ko jod kar draw kar sakte hain. Ye levels specific percentages par price range select karne par draw kiye jate hain. Pivot points ke mukable mein, Fibonacci levels fixed numbers par based nahi hote hain aur potential price levels ko analyze karne mein adhik flexibility provide karte hain.

    Summary mein, pivot points traders ke liye zaroori tools hain market trends aur potential reversals ko determine karne ke liye. Ye support aur resistance ke reference levels offer karte hain, entry, stop-loss, aur profit-taking points ke liye decision-making mein madad karte hain. Traders ko pivot points ko doosre indicators ke saath combine karna aur unhe ek comprehensive trading strategy ka hissa banakar istemal karna chahiye. Jabki pivot points ki kuch limitations hain, lekin ye traders ke beech popular hain unki sadgi aur intra-day trading ke liye quick-reference tools ke roop mein effectiveness ke liye.

    Pivot Points Types

    Pivot Points: Intra-Day Trading ke liye Ek Quick-Reference Tool

    Pivot points wo quick-reference tools hain jo traders intra-day trading mein istemal karte hain tak ke unhe short-term price movements ke doran benchmarks aur perspective de sakein. Ye points market mein potential support aur resistance levels ko identify karne ke liye istemal kiye jate hain, jo traders ko trading ke bare mein adhik informed decisions lene mein madad karte hain.

    Pivot points ek stock market index ya individual security ke high, low, aur close price levels par based hote hain pichle din ya haftay ke liye. Traders in levels ko simple factors se high, low, aur close prices se multiply karke support aur resistance levels set karne ke liye istemal karte hain.

    Ye factors bahut simple ho sakte hain, jaise ki 2x ya 3x, ya wo Fibonacci numbers par based ho sakte hain. Fibonacci numbers ek series of numbers hote hain jahan har number do pehle numbers ka sum hota hai. For example, kuch Fibonacci numbers ke pehle numbers 0, 1, 1, 2, 3, 5, 8, 13, 21 hote h

    ain. Traders jo Fibonacci numbers ka istemal pivot points calculate karne ke liye karte hain, wo potential support aur resistance levels determine karne ke liye factors jaise ki 0.382, 0.618, aur 1.618 ka istemal karte hain.

    Pivot points pehle floor traders ke dwara istemal kiye jaate the, jo unhe ek piece of scratch paper par manually calculate karte the. Kyunki pivot points itne simple calculate kiye ja sakte hain, isliye ye aaj bhi traders ke beech ek popular tool hain.

    Kai alag alag types ke pivot points hote hain, jaise traditional pivot points, Woodie's pivot points, Camarilla pivot points, aur Fibonacci pivot points. Har type ka pivot point potential support aur resistance levels calculate karne ke liye thoda alag formula istemal karta hai.
    • Traditional Pivot Points

      Traditional pivot points sabse commonly used type ke pivot point hote hain. Traditional pivot points calculate karne ke liye, traders pehle pivot point ko calculate karte hain. Pivot point bas pichle din ke high, low, aur close prices ka average hota hai. Traders fir potential support aur resistance levels ko pivot point ko simple factors se multiply karke calculate karte hain.

      For example, agar pivot point 100 hai aur pichle din ke high, low, aur close prices 105, 95, aur 98 hain, to ek trader potential support aur resistance levels ko niche diye gaye tarah calculate kar sakta hai:

      Pehla support level: 98 - (100 - 95) = 93
      Dusra support level: 95 - (100 - 95) = 90
      Teesra support level: 90 - (100 - 95) = 85
      Pehla resistance level: 105 + (100 - 98) = 107
      Dusra resistance level: 107 + (100 - 98) = 109
      Teesra resistance level: 109 + (100 - 98) = 111
    • Woodie's Pivot Points

      Woodie's pivot points traditional pivot points ki tarah hote hain, lekin ye pichle din ke close price par zyada weightage dete hain. Woodie's pivot points calculate karne ke liye, traders pehle pivot point ko calculate karte hain jo high, low, aur close prices ka average hota hai. Traders fir potential support aur resistance levels ko pivot point ko simple factors se multiply karke calculate karte hain aur ek certain amount ko pichle din ke close price ke basis par add ya subtract karte hain.
    • Camarilla Pivot Points

      Camarilla pivot points ek aur tarah ka pivot point hai jo pichle din ke close price par zyada weightage deta hai. Camarilla pivot points calculate karne ke liye, traders pehle pivot point ko calculate karte hain jo high, low, aur close prices ka average hota hai. Traders fir potential support aur resistance levels ko calculate karte hain ek series ke formulae ke basis par jo pichle din ke range aur close price ko account mein lete hain.


    Trading

    Pivot points traders ke darmiyan bohot mashhoor hain, ye trend, mumkinah reversal ko nigah mein laane aur potential support aur resistance levels ko pehchanne ke liye istemal kiye jate hain. Ye ek achi jaani jaane wali tool hai jo khaas tor par naye traders ke liye dilchaspi ka sabab banti hai, kyun ke isme shaamil mathematical formulas ki sadgi hoti hai.

    Click image for larger version

Name:	pivot-point-bounce-strategy.jpg
Views:	55
Size:	59.1 کلوبائٹ
ID:	12843437

    Pehle, pivot point calculations ko daily, haftawarana aur mahina warana timeframes par istemal kiya jata tha. Aaj kal, naye technology ka matlab hai ke hum pivot points ko chhote timeframes par bhi calculate kar sakte hain.

    Pivot points pehle muddat ke open, close, high aur low prices ka istemal karte hain taake haal ki muddat ke rukh aur future support aur resistance levels ko calculate kiya ja sake.

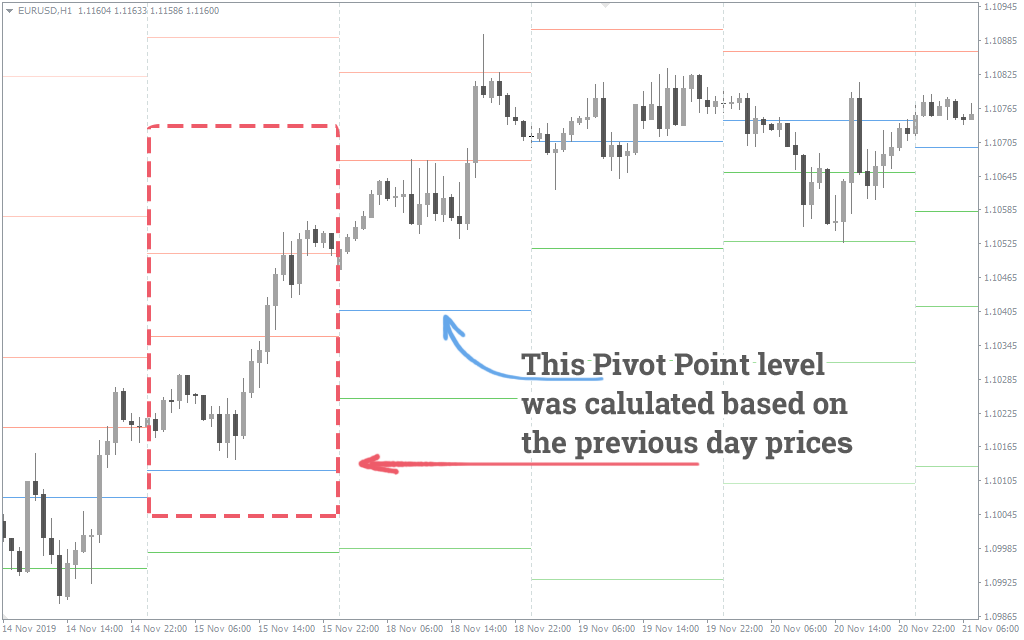
    Ye concept kehta hai, jab prices define kiye gaye pivot point ke upar hoti hain, to market bullish rukh mein hai aur zyada tar upar ki taraf jaane ki sambhavna hoti hai, aur ulta agar prices pivot point ke neeche chali jati hain, to market bearish hoti hai aur prices zyada tar niche ki taraf jaane ki sambhavna hoti hai.

    Long positions jo pivot point ke upar open hoti hain, wo potentially resistance (R1 - resistance level 1) se mil sakti hain, jo day-traders ke liye potential munafa lock karne ka mauka kholta hai. Ek mazboot upar ki aur surge jo R1 ke upar hoti hai, potentially aur munafa ke mauke ko khol sakta hai zyada high resistance levels (R2 aur R3) par. Ek suraksha stop-loss pivot point ke neeche recommend kiya jata hai tak ke achanak volatility ke case mein nuksan se bacha ja sake.

    Usi tarah, short positions jo pivot point ke neeche open hoti hain, wo potentially support (S1 - support level 1) se mil sakti hain, day traders ke liye potential munafa lock karne ka rasta kholta hai. Ek mazboot niche ki surge jo S1 ke neeche hoti hai, potentially aur munafa ke mauke ko khol sakta hai niche ke support levels (S2 aur S3) par. Ek suraksha stop-loss pivot point ke upar recommend kiya jata hai zyada nuksan se bachne ke liye, achanak volatility ke case mein.

    Sideways movements pivot point aur R1 ke darmiyan confined hoti hain, jo range traders ke liye potential buying aur selling opportunities hoti hain, jab prices pivot point se bounce karte hain aur R1 se vapas laut aate hain.

    Agar breakout R1 ke upar hota hai, to prices potentially R2 ki taraf ja sakti hain, aur pivot point support ke roop mein kaam karega aur ulta bhi. Agar breakout pivot point ke neeche hota hai, to prices potentially S1 ki taraf ja sakti hain aur pivot point resistance ke roop mein kaam karega.

    Additionally, agar prices pivot point ke neeche hain to wo S1 par support se mil sakti hain aur pivot point ki taraf bounce back ho sakti hain.

    Jab prices pivot point aur S1 ke darmiyan confined hote hain, jise range kehte hain, to potential trading opportunities ho sakti hain buyers ke liye jab prices S1 se bounce karte hain aur sellers ke liye jab prices pivot point se bounce back karte hain.

    Conclusion

    Pivot points forex trading mein aaj bhi sabse valuable tools mein se kuch hain kyun ke ye market ke rukh ka simple tareeke se samajhne ka ek asaan tareeqa dete hain. Jab prices pivot point ke upar hoti hain, to markets bullish hoti hain aur jab prices pivot point ke neeche hoti hain, to markets bearish hoti hain.

    Ye tool traders ko aasani se potential support aur resistance levels calculate karne ki anumati deta hai, jahan prices shayad ruk jayein phir se sideways trading jaari rahe, ya ek range ke upar ya neeche toot jayein taeed ya maang ke asar par depend karte hue.

    Halaanki, jaise ki kisi bhi technical analysis tool ke saath, apni trading strategy ko behtar potential dene ke liye, pivot points ko doosre indicators/oscillators aur candlestick reversal patterns ke saath combine kiya jana chahiye.

    Sab techniques, DeMark formula ke alawa, pehle muddat ke high, low aur close prices ka istemal karte hain pivot point ko calculate karne ke liye. DeMark formula ek pivot point calculation mein istemal hone wale teen formulas mein se ek ko define karne ke liye open aur close price ke darmiyan ke rishte ka istemal karta hai. Iske alawa, Camarilla pivot point calculation mein muddat ke open price ka istemal hota hai. Pivot point calculation techniques pivot point level, support aur resistance, aur har pivot point level ke darmiyan ki doori mein assign kiye gaye weights mein farq karte hain.


    • #3 Collapse

      What is Pivot Point in Forex Trading?

      Click image for larger version

Name:	PivotPoint.png
Views:	64
Size:	55.9 کلوبائٹ
ID:	12843441

      Pivot Point in Forex Trading: Forex Trading Mein Mukhtasar Tafseel

      I. Introduction (تعاریف)

      Pivot Point forex trading mein aik ahem concept hai jo traders ko market trends aur price movements ka analysis karne mein madad deta hai. Is article mein, hum pivot point ke tareef, uske calculation method, istemal ka tareeqa, aur iske fawaid aur nuqsanat ke baare mein tafseel se guftagu karenge.

      II. Pivot Point Ki Tareef (پیٹرن کی شناخت)

      Pivot Point ek technical indicator hai jo traders ko market ke potential turning points ka pata lagane mein madad deta hai. Ye point market ke previous day's high, low aur close prices se calculate kiya jata hai.

      III. Pivot Point Ka Calculation (حساب و شُمار)

      Pivot Point ka calculation 3 steps par mabni hota hai:
      1. Pivot Point (P): Pivot Point calculate kiya jata hai previous day's high, low aur close prices ka average use karke.
      2. Support Levels (S1, S2, S3): Support levels pivot point ke nichay ke price levels hote hain jo market mein downward movement ki indication dete hain. In levels ko calculate karne ke liye pivot point se previous day's high aur low ka difference subtract kiya jata hai.
      3. Resistance Levels (R1, R2, R3): Resistance levels pivot point ke upar ke price levels hote hain jo market mein upward movement ki indication dete hain. In levels ko calculate karne ke liye pivot point se previous day's high aur low ka difference add kiya jata hai.

      IV. Pivot Point Ka Istemal (استعمال)
      1. Potential Turning Points Ka Pata Lagana (ممکنہ موڑ کا پتہ لگانا): Pivot Point traders ko market ke potential turning points ka pata lagane mein madad deta hai. Agar price pivot point ke around move karta hai, to ye indicate karta hai ke market mein potential reversal ho sakta hai.
      2. Support Aur Resistance Levels Ka Pata Lagana (سپورٹ اور ریزسٹنس لیولز کا پتہ لگانا): Pivot Point support aur resistance levels provide karta hai jo traders ko entry aur exit points ka tay karte waqt madad deta hai.

      V. Pivot Point Ke Fawaid (فوائد)
      1. Turning Points Ka Pata Lagana (موڑ کا پتہ لگانا): Pivot Point market ke potential turning points ka pata lagane mein madadgar hota hai, jo traders ko sahi trading decisions lene mein madad deta hai.
      2. Support Aur Resistance Levels Ka Pata Lagana (سپورٹ اور ریزسٹنس لیولز کا پتہ لگانا): Pivot Point support aur resistance levels provide karta hai jo traders ko entry aur exit points ka tay karte waqt madad deta hai.

      VI. Pivot Point Ke Nuqsanat (نقصانات)
      1. False Signals (غلط اشارات): Kabhi kabhi pivot point false signals bhi de sakta hai, jahan price movements ke against indicator ka signal milta hai.
      2. Market Volatility (بازار کی حالت): Market volatility ki wajah se pivot point ke levels change ho sakte hain, jis se traders ko confusion ho sakta hai.

      VII. Conclusion (اختتام)

      Pivot Point forex trading mein market trends aur price movements ka analysis karne ka ahem concept hai. Lekin, iska istemal karne se pehle, traders ko proper analysis aur confirmatory indicators ka istemal karna chahiye. Is tarah se, wo sahi trading decisions le sakte hain aur apne trading performance ko behtar bana sakte hain.
      • #4 Collapse

        Pivot Point Indicator in Forex Trading
        Pivot Point Indicator (Introduction)

        Assalam o Alekum Dear Friends and Fellows Pivot Point Forex trading me ek technical analysis indicator hy jo traders istemal karty hein taake woh market ke potential support aur resistance levels ko samajh sake, khaas kar ek diye gaye time frame ke liye. Ye market trends ko samajhny aur trading decisions banane me madad karta hy.Pivot Point ka calculation previous day's high, low, aur close prices se hota hy. Iske alawa, iske saath saath, additional support aur resistance levels ko bhi calculate kiya jata hy. Ye levels traders ko batate hein ke market kis direction me ja sakta hy aur kahan price me reversal ho sakta hy.Traders pivot points ko samajhte hein aur inka istemal karty hein takey woh entry aur exit points decide kar sakein. Agar price pivot point se upar hy, toh ye indicate karta hy ke market bullish ho sakta hy, aur agar price pivot point se neechy hy, toh ye bearish trend ko darust kar sakta hy.

        Click image for larger version

Name:	1.png
Views:	70
Size:	5.0 کلوبائٹ
ID:	12843448
        Pivot Point Trading Strategies

        Dear Fellows Forex market main pivot point ko istemal karny ka ek moasar tareeqa resistance levels par sell karna aur support levels par ferokht karna hy. Iss k elawa aap resistance level k upper aur support level k nechay stop loss set kar sakty hen. Jab bhi prices support levels ko touch karti hy to traders k leye ek achih opportunity hoti hy k wo market main buy ki entry karen, jab k resistance level par market main sell ki entry ki jati hy.Trend confirmation k leye pivot point ko dosre reliable indicator ya money flue index indicator k sath bhi istemal kia ja sakta hy. Misal k tawar par agar jab prices pivot point k resistance level ko touch karti hy aur prices RSI indicator par bhi overbought position par hon, to yahan par sell ka signal peda hoga, jab k buy k signal k leye pivot point ka support zone ya level main hona chaheye jab k RSI indicator main prices ka oversold position par honna chaheye.

        Click image for larger version

Name:	2.png
Views:	50
Size:	8.0 کلوبائٹ
ID:	12843449
        Levels Of Pivot Points


        Pivot Point (PP):
        Pivot Point market ka central point hota hy. Agar current price Pivot Point ke upper hy, toh yeh indicate karta hy ke market bullish trend me hy, jabke agar current price Pivot Point ke lower hy, toh yeh bearish trend ko darust karta hy.

        Support Levels (S1, S2, S3):
        Support levels Pivot Point ke neechy tay kiye jaty hein. S1, S2, aur S3, inme se har ek level Pivot Point ke lower hota hy aur traders isay market me expected downward movement ke liye dekhty hein.

        Resistance Levels (R1, R2, R3):
        Resistance levels Pivot Point ke upar tay kiye jaty hein. R1, R2, aur R3, inme se har ek level Pivot Point ke upper hota hy aur traders isay market me expected upward movement ke liye dekhty hein.

        • #5 Collapse

          What is pivot point in forex trading?

          Click image for larger version

Name:	e.png
Views:	59
Size:	110.9 کلوبائٹ
ID:	12843496


          Forex trading ek aisa jadoo hai jisme investors aur traders duniya bhar ke currencies ke market mein hissa lete hain, umummiyat se maloom hota hai ke yeh bohot tezi se badalne wala hai. Is chakkar mein rehte hue, traders ko apne faislay mein madad karne ke liye kuch tools aur techniques ka istemal karna zaroori hai. Ek aham concept jiska istemal traders apne strategies banane mein karte hain, woh hai "Pivot Point."

          Pivot Point Kya Hai? (Tajaweez):

          Pivot Point ek technical analysis ka hissa hai jise forex traders apne trading decisions mein istemal karte hain. Yeh ek mathematically calculated point hai jo market ke previous day ke high, low aur close prices par mabni hota hai. Is point ka maqsad market ke potential reversals aur trend changes ko identify karna hai.

          Pivot Point Calculation (Hisab-o-Taqseem):

          Pivot Point ki calculation kuch asoolon par mabni hoti hai. Aam taur par, Pivot Point calculate karne ke liye market ke previous day ke high, low aur close prices ko add, subtract aur divide kiya jata hai. Iske baad, traders additional support aur resistance levels tay karte hain jinhe Pivot Point ke aas-paas place karte hain.

          Pivot Point Aur Uske Types (Nawishta):

          Pivot Point ek base point hota hai, uske aas-paas banaye jane wale levels ko traders support aur resistance levels ke taur par istemal karte hain. Isme kuch mukhtalif types hain, jese ke Classical Pivot Points, Fibonacci Pivot Points, aur Camarilla Pivot Points. Har type apne tariqay se calculate kiye jate hain aur traders apni needs ke mutabiq inme se kisi bhi type ko choose kar sakte hain.

          Pivot Point Ka Istemal Trading Mein (Amal):

          Pivot Point ka istemal traders ke liye ahem hota hai kyun ke iske through woh market ke trend changes, reversals, aur price movements ko anticipate kar sakte hain. Agar market Pivot Point ke aas-paas se guzarti hai, toh yeh ek potential entry ya exit point ban sakta hai. Iske alawa, agar prices Pivot Point ko break karte hain, toh yeh ek strong signal provide karta hai ke market mein kuch significant hone wala hai.

          Pivot Point Aur Risk Management (Dafa):

          Pivot Point traders ko not only market trends ka ilm dene ke liye istemal hota hai, balki yeh bhi unhe risk management mein madad karta hai. Agar koi trader Pivot Point ko sahi taur par samajh leta hai, toh woh apne stop-loss aur take-profit levels ko behtar taur par set kar sakte hain, jisse unka risk control mein rehta hai.

          Conclusion (Khatima):

          Pivot Point forex trading mein ek ahem tool hai jo traders ko market ke dynamics samajhne mein madad karta hai. Iski calculation aur istemal se traders apne strategies ko refine karke apni trading performance ko behtar bana sakte hain. Hamesha yaad rahe ke market mein risk hota hai, isliye har trading decision ko dhyan se lena chahiye aur proper risk management ka istemal karna chahiye.
          • #6 Collapse

            Pivot Point Indicator in Forex Trading.
            Pivot Point Indicator (Introduction)


            Assalam o Alekum Dear Friends and Fellows Pivot Point Forex trading me ek technical analysis indicator hy jo traders istemal karty hein taake woh market ke potential support aur resistance levels ko samajh sake, khaas kar ek diye gaye time frame ke liye. Ye market trends ko samajhny aur trading decisions banane me madad karta hy.Pivot Point ka calculation previous day's high, low, aur close prices se hota hy. Iske alawa, iske saath saath, additional support aur resistance levels ko bhi calculate kiya jata hy. Ye levels traders ko batate hein ke market kis direction me ja sakta hy aur kahan price me reversal ho sakta hy.Traders pivot points ko samajhte hein aur inka istemal karty hein takey woh entry aur exit points decide kar sakein. Agar price pivot point se upar hy, toh ye indicate karta hy ke market bullish ho sakta hy, aur agar price pivot point se neechy hy, toh ye bearish trend ko darust kar sakta hy.

            Trading strategy with pivot point indicators.


            Dear Fellows Forex market main pivot point ko istemal karny ka ek moasar tareeqa resistance levels par sell karna aur support levels par ferokht karna hy. Iss k elawa aap resistance level k upper aur support level k nechay stop loss set kar sakty hen. Jab bhi prices support levels ko touch karti hy to traders k leye ek achih opportunity hoti hy k wo market main buy ki entry karen, jab k resistance level par market main sell ki entry ki jati hy.Trend confirmation k leye pivot point ko dosre reliable indicator ya money flue index indicator k sath bhi istemal kia ja sakta hy. Misal k tawar par agar jab prices pivot point k resistance level ko touch karti hy aur prices RSI indicator par bhi overbought position par hon, to yahan par sell ka signal peda hoga, jab k buy k signal k leye pivot point ka support zone ya level main hona chaheye jab k RSI indicator main prices ka oversold position par honna chaheye.


            Levels Of Pivot Points.


            Pivot Point (PP):
            Pivot Point market ka central point hota hy. Agar current price Pivot Point ke upper hy, toh yeh indicate karta hy ke market bullish trend me hy, jabke agar current price Pivot Point ke lower hy, toh yeh bearish trend ko darust karta hy.

            Support Levels (S1, S2, S3):
            Support levels Pivot Point ke neechy tay kiye jaty hein. S1, S2, aur S3, inme se har ek level Pivot Point ke lower hota hy aur traders isay market me expected downward movement ke liye dekhty hein.

            Resistance Levels (R1, R2, R3):
            Resistance levels Pivot Point ke upar tay kiye jaty hein. R1, R2, aur R3, inme se har ek level Pivot Point ke upper hota hy aur traders isay market me expected upward movement ke liye dekhty hein.
            • #7 Collapse


              Forex Trading Mein Pivot Point Kya Hai:

              Forex trading mein safar shuru karne walay logon ke liye, chart analysis aur technical indicators ko samajhna ahem hota hai. In mein se ek ahem technical tool jo traders istemal karte hain, wo hai "Pivot Point". Aaj hum is mukhtasar article mein samjhein ge ke Pivot Point kya hai aur kaise yeh Forex trading mein istemal hota hai.

              Pivot Point Kya Hai?

              Pivot Point ek technical indicator hai jo traders ko market ka trend aur price movement samajhne mein madad karta hai. Yeh calculation based indicator hai jo previous trading session ke high, low aur close prices par tay kiya jata hai. Iska maqsad current trading session ke liye potential support aur resistance levels tay karna hota hai.

              Pivot Point Calculation:

              Pivot Point aur iske associated support aur resistance levels ko calculate karne ke liye, traders kuch simple formulas istemal karte hain. Yahan hum ek basic formula de rahe hain:

              Pivot Point (PP) = (High + Low + Close) / 3

              Is formula mein:
              • High = Previous trading session ka highest price
              • Low = Previous trading session ka lowest price
              • Close = Previous trading session ka closing price

              Pivot Point ke alawa, kuch traders aur indicators doosre support aur resistance levels bhi tay karte hain jaise ke R1 (Resistance 1), R2 (Resistance 2), S1 (Support 1), aur S2 (Support 2). In levels ko bhi Pivot Point ke formulas se calculate kiya jata hai.

              Pivot Point Ka Istemal:

              Forex trading mein Pivot Point ka istemal kuch mukhtalif tareeqon se hota hai:
              1. Trend Aur Price Reversals: Pivot Point levels ko dekhte hue, traders market ke trend aur price reversals ka andaza lagate hain. Agar price Pivot Point ke upar hai, to yeh bullish signal ho sakta hai, jabke agar price Pivot Point ke neeche hai, to yeh bearish signal ho sakta hai.
              2. Support Aur Resistance: Pivot Point aur uske levels traders ko potential support aur resistance zones ka pata lagane mein madad karte hain. Traders in levels ko istemal kar ke stop loss aur target levels tay karte hain.
              3. Trading Strategies: Kuch traders Pivot Point levels ko apni trading strategies mein shamil karte hain. Jaise ke, agar price Pivot Point ke upar hai, to woh long positions enter kar sakte hain aur agar price Pivot Point ke neeche hai, to woh short positions enter kar sakte hain.

              Ikhtitami Alfaz:

              Pivot Point ek ahem technical indicator hai jo Forex traders ko market analysis mein madad deta hai. Is indicator ko samajh kar aur sahi tarah se istemal kar ke, traders apni trading strategies ko mazeed behtar bana sakte hain. Magar yaad rahe ke har trading decision lene se pehle thorough analysis aur risk management ka khayal rakhna zaroori hai.

              • #8 Collapse

                Pivot points Forex trading

                Pivot points Forex trading mein important technical indicators hote hain jo traders dwara short-term price movements aur market direction ka estimate karne mein madad karte hain. Ye levels mathematical calculations se derive kiye jate hain based on previous day's high, low, and close prices. Pivot points aur unke associated support aur resistance levels traders ke liye reference points provide karte hain, jo unhe potential entry aur exit points identify karne mein madad karte hain.


                Yahan kuch key points hain Pivot Points ke bare mein:
                1. Calculation: Pivot points ko calculate karne ke liye, aam taur par previous day ka high, low, aur close prices ka average liya jata hai. Iske alawa, is formula mein additional support aur resistance levels bhi calculate kiye jate hain. Standard Pivot Point formula ye hota hai:


                  Pivot Point (PP) = (High + Low + Close)
                2. ​​​​​​Support aur resistance levels ko calculate karne ke liye, traders alag-alag formulas ka istemal karte hain, jaise ke Fibonacci levels ya Camarilla equation.
                3. Levels: Pivot Point ke around kuch key levels hote hain:
                  • Pivot Point (PP): Ye central reference point hota hai. Isse price action ka bias determine kiya jata hai. Agar price PP se upar hai, to bullish sentiment indicate hota hai, jabki agar price PP se niche hai, to bearish sentiment indicate hota hai.
                  • Support Levels (S1, S2, S3): Ye levels neeche ke potential support areas hote hain jahan se price bounce kar sakta hai.
                  • Resistance Levels (R1, R2, R3): Ye levels upar ke potential resistance areas hote hain jahan se price reverse ho sakta hai.
                4. Usage: Pivot points traders ko short-term trading strategies mein use karne mein madad karte hain. Traders in levels ko price action analysis ke saath combine karte hain aur jab price levels ke kareeb aata hai, to unhe entry ya exit points ke liye consider karte hain. Agar price support level ke near aata hai aur reversal signs show karta hai, to traders long positions enter kar sakte hain. Vaise hi, agar price resistance level ke near aata hai aur reversal signs show karta hai, to traders short positions enter kar sakte hain.
                5. Timeframes: Pivot points har timeframe par effective hote hain, lekin shorter timeframes par unka usage zyada common hota hai.
                Conclusion
                Pivot points flexible aur widely used technical analysis tools hain jo traders ko market mein short-term trading opportunities identify karne mein madad karte hain. Iske saath-saath, pivot points ke saath doosre technical indicators aur price action analysis ka istemal karke traders apne trading strategies ko refine kar sakte hain
                • #9 Collapse

                  Click image for larger version

Name:	What is Pivot Point in Forex Trading.png
Views:	49
Size:	7.4 کلوبائٹ
ID:	12843658

                  Forex Trading mein Pivot Point aik aham technical indicator hai jo traders ko market ke direction aur potential support aur resistance levels ko samajhne mein madad deta hai. Yeh indicator daily, weekly, ya monthly price movements ke base par calculate kiya jata hai. Neeche Pivot Point ke mukamal points Roman Urdu mein diye gaye hain:


                  Markazi Point:

                  Pivot Point aksar trading session ke markazi point ke tor par istemal kiya jata hai. Yeh market ke trend aur momentum ko determine karne mein madad deta hai.

                  Support aur Resistance Levels:

                  Pivot Point ke calculations se traders ko support aur resistance levels milte hain. Pivot Point ke around banaye gaye support aur resistance levels market ke price movements ko samajhne mein madadgar hote hain.

                  Calculations:

                  Pivot Point ko calculate karne ke liye aam tor par previous day's high, low, aur close prices ka istemal hota hai. Iske baad, kuch different formulas se Pivot Point aur iske related support aur resistance levels tay kiye jate hain.

                  Daily Pivot Points:

                  Yeh Pivot Points daily price movements ke hisab se calculate kiye jate hain aur traders ko intraday trading ke liye support aur resistance levels provide karte hain.

                  Weekly aur Monthly Pivot Points:

                  Weekly aur monthly Pivot Points bhi istemal kiye jate hain long-term trends aur positions ko analyze karne ke liye. Inse traders ko extended time frames ke liye support aur resistance levels milte hain.

                  Trend Determination:

                  Pivot Points ka istemal trend determination mein madadgar hota hai. Agar price Pivot Point se upar hai, to ye bullish trend ka indication ho sakta hai, jabke agar price Pivot Point se neeche hai, to ye bearish trend ka indication ho sakta hai.

                  Entry aur Exit Points:

                  Pivot Points traders ko entry aur exit points provide karte hain. Agar price support level tak pohanchti hai aur reversal signs dikhai deti hai, to ye entry point ho sakta hai. Ussi tarah, agar price resistance level tak pohanchti hai aur reversal signs dikhai deti hai, to ye exit point ho sakta hai.

                  Market Sentiment:

                  Pivot Points market sentiment ko bhi reflect karte hain. Agar price Pivot Point se upar hai aur support levels ko break karta hai, to ye bullish sentiment ko indicate kar sakta hai. Ussi tarah, agar price Pivot Point se neeche hai aur resistance levels ko break karta hai, to ye bearish sentiment ko indicate kar sakta hai. Is tarah se, Pivot Point Forex Trading mein ek aham technical indicator hai jo traders ko market ke direction aur potential support aur resistance levels ke bare mein maloomat faraham karta hai.
                  • #10 Collapse

                    What is Pivot Point in Forex Trading?
                    Click image for larger version  Name:	How-to-Use-Pivot-Points-in-Forex.png Views:	0 Size:	16.9 KB ID:	12843683


                    Forex trading mein "Pivot Point" ek important technical indicator hai jo traders istemal karte hain market ke support aur resistance levels ko determine karne ke liye. Pivot point ek mathematical calculation hai jo previous trading session ke high, low aur closing prices par based hota hai.
                    Pivot point calculation ke saath hi traders ko do aur important levels milte hain: support aur resistance.
                    1. Support Level: Ye pivot point se neeche ka level hota hai jahan se traders ko umeed hoti hai ke price ko neeche se bounce back milega.
                    2. Resistance Level: Ye pivot point se upar ka level hota hai jahan se traders ko umeed hoti hai ke price ko upar se bounce back milega.
                    Ye levels traders ko market trends aur potential entry aur exit points ka idea dete hain. Agar price pivot point ke upar hai to ye bullish sentiment ko indicate karta hai aur traders support level par potential buying opportunities dekhte hain. Wahi agar price pivot point ke neeche hai to ye bearish sentiment ko indicate karta hai aur traders resistance level par potential selling opportunities dekhte hain.
                    Pivot points ko calculate karne ke liye kuch alag-alag formulas hote hain, jinmein se sabse common formula hai:
                    Pivot Point=High+Low+Close3Pivot Point=3High+Low+Close​
                    Is formula mein, "High" previous trading session ka highest price hai, "Low" previous trading session ka lowest price hai, aur "Close" previous trading session ka closing price hai.
                    Forex trading mein pivot points ek important tool hote hain jo traders ko market ka direction samajhne mein aur trading decisions lene mein madad karte hain.
                    Last edited by ; 28-02-2024, 10:06 AM.
                    • #11 Collapse

                      Assalamu Alaikum Dosto!
                      Forex Pivot Points

                      Click image for larger version

Name:	images (17).png
Views:	44
Size:	7.5 کلوبائٹ
ID:	12843871

                      Forex Pivot Points, ya "Forex Pivot Bindu," trading mein ek ahem technical analysis tool hai jo traders ke liye support aur resistance levels ka estimation karta hai. Ye levels market trends aur price action ko samajhne mein madad karte hain aur trading decisions ke liye reference points provide karte hain.

                      Pivot points calculation, previous day's high, low, aur closing prices par based hoti hai. Isse traders ko ek central pivot point ke sath sath aur kai support aur resistance levels milte hain, jo price ke movements ke liye important hote hain.

                      Pivot Points ki calculation ke liye, traders kuch formulas istemal karte hain, jinmein sabse common formulas hain:

                      Standard Pivot Points
                      Fibonacci Pivot Points
                      Woodie's Pivot Points
                      Camarilla Pivot Points
                      Har ek formula alag alag levels generate karta hai jo traders ke liye useful hote hain. In levels ka istemal karke, traders apne entry aur exit points decide karte hain aur price movements ko analyze karte hain.

                      Pivot Points ka istemal karke, traders market ka sentiment samajhte hain aur trend ka direction anticipate karte hain. Iske alawa, Pivot Points ko support aur resistance levels ke roop mein istemal karke stop-loss aur target levels set kiya jata hai.

                      Overall, Pivot Points trading mein ek important tool hai jo traders ko market analysis mein madad karta hai aur unhe trading decisions ke liye guidelines provide karta hai.

                      Standard Pivot Points

                      Standard Pivot Points, ya "Mamooli Pivot Bindu," trading mein ek mukhtasar technical analysis tool hai jo traders ko support aur resistance levels ka estimation karne mein madad karta hai. Ye levels market trends aur price action ko samajhne mein madad karte hain aur trading decisions ke liye reference points provide karte hain.

                      Standard Pivot Points ki calculation previous day's high, low, aur closing prices par based hoti hai. Isse traders ko ek central pivot point ke sath sath aur kai support aur resistance levels milte hain. Yeh levels traders ke liye important hote hain kyunki isse unhe price movements ka direction samajhne mein madad milti hai.

                      Standard Pivot Points ko calculate karne ke liye, traders ye formula istemal karte hain:

                      ����������(��)=(�����������ℎ+�����������+��������� ����)/3PivotPoint(PP)=(PreviousHigh+PreviousLow+Previous Close)/3

                      Iske alawa, is central pivot point ke aas paas aur bhi kuch levels generate kiye jate hain, jaise:
                      1. Resistance Levels:
                        • R1 = (2 * PP) - Previous Low
                        • R2 = PP + (Previous High - Previous Low)
                        • R3 = Previous High + 2 * (PP - Previous Low)
                      2. Support Levels:
                        • S1 = (2 * PP) - Previous High
                        • S2 = PP - (Previous High - Previous Low)
                        • S3 = Previous Low - 2 * (Previous High - PP)

                      In levels ka istemal karke, traders market ka sentiment samajhte hain aur trend ka direction anticipate karte hain. Iske alawa, Pivot Points ko support aur resistance levels ke roop mein istemal karke stop-loss aur target levels set kiya jata hai.

                      Standard Pivot Points trading mein ek important tool hai jo traders ko market analysis mein madad karta hai aur unhe trading decisions ke liye guidelines provide karta hai.
                      • #12 Collapse

                        Pivot Point Indicator in Forex Trading
                        Pivot Point Indicator (Introduction)

                        Assalam o Alekum Dear Friends and Fellows Pivot Point Forex trading me ek technical analysis indicator hy jo traders istemal karty hein taake woh market ke potential support aur resistance levels ko samajh sake, khaas kar ek diye gaye time frame ke liye. Ye market trends ko samajhny aur trading decisions banane me madad karta hy.Pivot Point ka calculation previous day's high, low, aur close prices se hota hy. Iske alawa, iske saath saath, additional support aur resistance levels ko bhi calculate kiya jata hy. Ye levels traders ko batate hein ke market kis direction me ja sakta hy aur kahan price me reversal ho sakta hy.Traders pivot points ko samajhte hein aur inka istemal karty hein takey woh entry aur exit points decide kar sakein. Agar price pivot point se upar hy, toh ye indicate karta hy ke market bullish ho sakta hy, aur agar price pivot point se neechy hy, toh ye bearish trend ko darust kar sakta hy.


                        Pivot Point Trading Strategies

                        Dear Fellows Forex market main pivot point ko istemal karny ka ek moasar tareeqa resistance levels par sell karna aur support levels par ferokht karna hy. Iss k elawa aap resistance level k upper aur support level k nechay stop loss set kar sakty hen. Jab bhi prices support levels ko touch karti hy to traders k leye ek achih opportunity hoti hy k wo market main buy ki entry karen, jab k resistance level par market main sell ki entry ki jati hy.Trend confirmation k leye pivot point ko dosre reliable indicator ya money flue index indicator k sath bhi istemal kia ja sakta hy. Misal k tawar par agar jab prices pivot point k resistance level ko touch karti hy aur prices RSI indicator par bhi overbought position par hon, to yahan par sell ka signal peda hoga, jab k buy k signal k leye pivot point ka support zone ya level main hona chaheye jab k RSI indicator main prices ka oversold position par honna chaheye.

                        Levels Of Pivot Points


                        Pivot Point (PP):
                        Pivot Point market ka central point hota hy. Agar current price Pivot Point ke upper hy, toh yeh indicate karta hy ke market bullish trend me hy, jabke agar current price Pivot Point ke lower hy, toh yeh bearish trend ko darust karta hy.

                        Support Levels (S1, S2, S3):
                        Support levels Pivot Point ke neechy tay kiye jaty hein. S1, S2, aur S3, inme se har ek level Pivot Point ke lower hota hy aur traders isay market me expected downward movement ke liye dekhty hein.

                        Resistance Levels (R1, R2, R3):
                        Resistance levels Pivot Point ke upar tay kiye jaty hein. R1, R2, aur R3, inme se har ek level Pivot Point ke upper hota hy aur traders isay market me expected upward movement ke liye dekhty hein.
                        • #13 Collapse


                          ?Pivot Point Indicator in Forex Trading


                          Pivot Point Indicator Introduction

                          Assalam o Alekum Dear Friends and Fellows Pivot Point Forex trading me ek technical analysis indicator hy jo traders istemal karty hein taake woh market ke potential support aur resistance levels ko samajh sake, khaas kar ek diye gaye time frame ke liye. Ye market trends ko samajhny aur trading decisions banane me madad karta hy.Pivot Point ka calculation previous day's high, low, aur close prices se hota hy. Iske alawa, iske saath saath, additional support aur resistance levels ko bhi calculate kiya jata hy. Ye levels traders ko batate hein ke market kis direction me ja sakta hy aur kahan price me reversal ho sakta hy.Traders pivot points ko samajhte hein aur inka istemal karty hein takey woh entry aur exit points decide kar sakein. Agar price pivot point se upar hy, toh ye indicate karta hy ke market bullish ho sakta hy, aur agar price pivot point se neechy hy, toh ye bearish trend ko darust kar sakta hy.

                          پیوٹ points ko muzahmat aur support ki mumkina satah ke tor par dekha jata hai, aur is wajah se market ke mumkina mourr ke tor par dekha jata hai .
                          پیوٹ point ka tareeqa car himayat aur muzahmat ki mutadid sthon ka hisaab laganay ke liye istemaal kya ja sakta hai .
                          classic پیوٹ points ka hisaab pichlle din ki aala, kam aur ikhtitami qeematon ka istemaal karte hue kya jata hai .


                          Trading With Pivot Points

                          is baat se koi farq nahi parta hai ke turning points ki passion goi karne mein پیوٹ points kitney hi durust hain, taajiron ko un ke sath musalsal jeetnay ke liye aik qabil amal nizaam ki zaroorat hai. jaisa ke tamam tijarti nizamon ke sath, is ke liye aik dakhlay ka tareeqa, aik stap las ٹرگر, aur munafe ka hadaf ya aygzt signal darkaar hota hai .

                          kuch din tajir dakhlay, stops, aur munafe lainay ki sthon ka taayun karne ke liye پیوٹ points ka istemaal karte hue is baat ka taayun karne ki koshish karen ge ke dosray taajiron ki aksariyat kahan aisa kar rahi hai. forex پیوٹ point calculator retail forex brokrz aur third party Websites ke zariye internet par muft dastyab hain .


                          Levels Of Pivot Points


                          Pivot Point (PP):
                          Pivot Point market ka central point hota hy. Agar current price Pivot Point ke upper hy, toh yeh indicate karta hy ke market bullish trend me hy, jabke agar current price Pivot Point ke lower hy, toh yeh bearish trend ko darust karta hy.

                          Support Levels (S1, S2, S3):
                          Support levels Pivot Point ke neechy tay kiye jaty hein. S1, S2, aur S3, inme se har ek level Pivot Point ke lower hota hy aur traders isay market me expected downward movement ke liye dekhty hein.

                          Resistance Levels (R1, R2, R3):
                          Resistance levels Pivot Point ke upar tay kiye jaty hein. R1, R2, aur R3, inme se har ek level Pivot Point ke upper hota hy aur traders isay market me expected upward movement ke liye dekhty hein.
                          • <a href="https://www.instaforex.org/ru/?x=ruforum">InstaForex</a>
                          • #14 Collapse

                            **Forex Trading Mein Pivot Point Kya Hai?**
                            Pivot Point forex trading aur technical analysis mein ek ahem concept hai jo market ke potential reversal points aur support-resistance levels ko identify karne mein madad karta hai. Yeh ek mathematical calculation hoti hai jo ek trading session ke dauran market ki key levels ko determine karti hai. Pivot Points ko generally daily, weekly, aur monthly basis par calculate kiya jata hai, aur yeh traders ko trading decisions mein guide karte hain.

                            **Pivot Point Ka Calculation**

                            Pivot Point ko calculate karne ke liye, aapko previous trading session ke high, low, aur closing price ki zaroorat hoti hai. Formula kuch is tarah hota hai:

                            \[ \text{Pivot Point (PP)} = \frac{\text{High} + \text{Low} + \text{Close}}{3} \]

                            Is ke ilawa, support aur resistance levels bhi calculate kiye jate hain jo pivot point ke around set kiye jate hain. Inke formulas hain:

                            - **First Support (S1)**: \[ \text{S1} = (2 \times \text{PP}) - \text{High} \]
                            - **First Resistance (R1)**: \[ \text{R1} = (2 \times \text{PP}) - \text{Low} \]
                            - **Second Support (S2)**: \[ \text{S2} = \text{PP} - (\text{High} - \text{Low}) \]
                            - **Second Resistance (R2)**: \[ \text{R2} = \text{PP} + (\text{High} - \text{Low}) \]

                            **Pivot Point Ka Use Trading Mein**

                            1. **Support Aur Resistance Levels**: Pivot Point market ke key support aur resistance levels ko define karta hai. Traders in levels ka use trading decisions mein karte hain, jaise ke entry aur exit points ko identify karna.

                            2. **Trend Reversals**: Agar price pivot point ke upar move karti hai, to yeh bullish trend ka indication ho sakta hai. Agar price pivot point ke neeche move karti hai, to yeh bearish trend ka signal ho sakta hai.

                            3. **Trading Strategy**: Pivot Points ko use karke traders short-term aur intraday trading strategies develop karte hain. Yeh levels price action ke basis par trading signals ko confirm karte hain aur market trends ko track karte hain.

                            4. **Psychological Levels**: Pivot Points trading community mein widely recognized hote hain, aur isliye yeh psychological levels ban jate hain jahan price movements significant hote hain. Traders in levels par market behavior aur price reactions ko closely monitor karte hain.

                            **Conclusion**

                            Pivot Point forex trading mein ek crucial tool hai jo market ke key support aur resistance levels ko identify karne mein madad karta hai. Iska accurate calculation aur application aapko market trends ko better samajhne aur trading decisions ko enhance karne mein madad kar sakta hai. Pivot Points ko other technical indicators aur analysis tools ke sath combine karke, aap apni trading strategies ko optimize kar sakte hain aur market movements ko effectively predict kar sakte hain.

                            اب آن لائن

                            Working...
                            X