money flow index indicator
No announcement yet.
X
  • وقت
  • دکھائیں
Clear All
new posts
  • #1 Collapse

    money flow index indicator
    Money Flow Index (MFI) ek technical analysis indicator hai jo market ki strength or weakness ko measure karta hai. Yeh indicator primarily volume or price data ka use karta hai, jisse traders ko market trend aur potential reversals ka pata chalta hai. MFI, Welles Wilder ne develop kiya tha, jo ke renowned technical analyst the.

    MFI ka basic concept yeh hai ke jab market mein buying pressure zyada hoti hai, to MFI bhi zyada hota hai, indicating strong bullish trend. Aur jab selling pressure dominate karta hai, to MFI kam hota hai, pointing towards a potential bearish trend.

    MFI ka formula simple hai, jisme aapko positive money flow aur negative money flow calculate karna hota hai. Positive money flow, uptick times mein buying pressure ko represent karta hai, jabki negative money flow, downtick times mein selling pressure ko indicate karta hai.

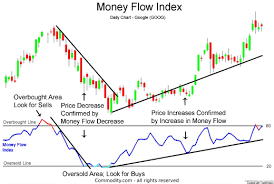
    MFI values typically 80 ke upar overbought territory ko signal karte hain, jisse traders ko ye samajh aata hai ke market mein zyada buying activity ho rahi hai, aur ek reversal possible hai. 20 ke neeche ke MFI values, oversold conditions ko indicate karte hain, jisse traders ko ye idea milta hai ke market mein selling pressure hai, aur reversal ho sakta hai.

    MFI ka istemal various trading strategies mein hota hai. Kuch traders MFI ko trend confirm karne ke liye istemal karte hain, jabki doosre MFI ko divergence detection ke liye use karte hain. Divergence ka matlab hota hai jab price aur MFI mein opposite movements hote hain, indicating a potential trend reversal.

    MFI ke alawa bhi kuch parameters hote hain jinhe traders customize kar sakte hain, jaise ke period length. Longer period length se aapko smoother MFI milta hai, jabki shorter periods volatility ko better capture karte hain

    Click image for larger version

Name:	download (15).png
Views:	25
Size:	10.3 کلوبائٹ
ID:	12802172


    Is indicator ki kuch limitations bhi hain, jaise ke choppy markets mein false signals ka risk hota hai. Isliye, wise hai ke MFI ko aur doosre indicators ke saath combine kiya jaye for more reliable signals.

    Final words mein, Money Flow Index ek powerful tool hai jo traders ko market conditions samajhne mein madad karta hai. Lekin, jaise har indicator ka case hota hai, iska bhi cautious istemal karna important hai aur doosre factors ke saath combine karna wise decision hota hai.
  • <a href="https://www.instaforex.org/ru/?x=ruforum">InstaForex</a>
  • #2 Collapse

    Forex mein Money Flow Index Indicator istemal karna, trading mein mukhtalif securities ki keemat aur unke volume ke darmiyan ta'alluq ko samajhne mein madad karta hai. Yeh ek technical indicator hai jo security ke price aur volume ke darmiyan relation ko measure karta hai.
    Yeh indicator typically 14 periods ka hota hai aur woh price aur volume ke base par ek value generate karta hai. Iski value 0 se 100 tak hoti hai. Agar yeh value 80 se zyada ho toh yeh indicate karta hai ke security overbought ho sakti hai, yaani ke price ne expected value se zyada increase kiya ho sakta hai aur potential reversal aa sakta hai.
    Waise agar yeh value 20 se kam ho toh yeh indicate karta hai ke security oversold ho sakti hai, yaani ke price ne expected value se zyada decrease kiya ho sakta hai aur potential reversal aa sakta hai.
    Click image for larger version

Name:	money flow1.jpg
Views:	28
Size:	12.5 کلوبائٹ
ID:	12802203
    Yeh indicator market trends, reversals, aur entry/exit points ke liye istemal hota hai. Lekin, sirf Money Flow Index Indicator se trading nahi ki ja sakti, isko aur bhi tools aur analysis ke saath istemal kiya jata hai taake accurate decisions liye ja sakein.
    Money Flow Index (MFI) Indicator ke kuch faiday ye hote hain:
    1. Overbought ya Oversold Conditions Ka Pata: MFI, securities ke overbought ya oversold hone ki soorat mein madadgar hota hai. Jab yeh indicator 80 se zyada ya 20 se kam hota hai, toh yeh price reversal ke chances ko darust karta hai.
    2. Divergence Ko Samajhna: MFI, price aur volume ke darmiyan ki divergence ko detect karta hai. Agar security ke price aur MFI ke readings mein farq hai, toh yeh potential trend reversal ki indication de sakta hai.
    3. Trend Ko Confirm Karna: Is indicator ki madad se traders trend ko confirm kar sakte hain. Agar MFI high levels par hai aur price bhi high hai, toh trend strong hone ki possibility hai.
    4. Entry/Exit Points Ke Liye: MFI, entry aur exit points ke liye bhi istemal hota hai. Jab yeh indicator overbought ya oversold zone mein enter karta hai, toh traders apne positions ko adjust kar sakte hain.
    5. Volume aur Price Ke Relation Ka Pata: Is indicator ke zariye traders volume aur price ke darmiyan ki correlation ko samajh sakte hain. Isse unko market sentiment aur strength ka idea milta hai.
    Click image for larger version

Name:	money flow2.png
Views:	19
Size:	9.0 کلوبائٹ
ID:	12802204
    Lekin, yaad rahe ke kisi bhi indicator ki tarah, MFI bhi sirf ek tool hai aur isko akele mein istemal nahi karna chahiye. Proper analysis, dusre indicators aur market conditions ko consider kar ke hi trading decisions leni chahiye.
    Click image for larger version

Name:	money flow3.png
Views:	17
Size:	10.3 کلوبائٹ
ID:	12802205
    • #3 Collapse

      money flow index indicator

      Click image for larger version

Name:	download (31).png
Views:	15
Size:	10.3 کلوبائٹ
ID:	12802210


      Money Flow Index (MFI) ek technical analysis indicator hai jo market ki trading activity aur money flow ko measure karne mein istemal hota hai. Yeh indicator primarily overbought (jab market mein zyada khareedari ho rahi hai) aur oversold (jab market mein zyada farokht ho rahi hai) conditions ka pata lagane ke liye istemal hota hai.

      Yeh indicator Richard Arms ne 1970s mein develop kiya tha. MFI ka calculation price aur volume par mabni hota hai. Niche MFI ka basic formula hai:

      ���=100−1001+��������������MFI=100−1+MoneyFlowRati o100​

      Money Flow Ratio (MFR): ���=Positive Money FlowNegative Money FlowMFR=Negative Money FlowPositive Money Flow​

      Positive Money Flow (PMF): ���=∑positive money flow over n periodsPMF=∑positive money flow over n periods

      Negative Money Flow (NMF): ���=∑negative money flow over n periodsNMF=∑negative money flow over n periods

      Yahan, "positive money flow" aur "negative money flow" trading sessions ke doran kiye gaye net cash flow ko darust karti hain. Positive Money Flow, buying pressure ko darust karta hai jabke Negative Money Flow, selling pressure ko darust karta hai.

      MFI ka interpretation yeh hai:
      • MFI Values:
        • 80 se zyada: Overbought condition (sell signal)
        • 20 se kam: Oversold condition (buy signal)
      • Divergence:
        • Agar market price aur MFI mein koi farq ho (divergence), toh yeh indicate kar sakta hai ke current trend kamzor ho sakta hai.
      • Confirmation with Price Trends:
        • MFI ko market price trends ke saath confirm kiya jata hai. For example, agar market price naye highs banaye lekin MFI mein koi naya high na ho, toh yeh bearish divergence ho sakti hai.

      MFI ka istemal traders aur investors ne market entry aur exit points tay karne mein kiya jata hai. Hamesha yaad rahe ke koi bhi indicator sirf ek tool hai aur isay doosre factors aur indicators ke saath mila kar istemal karna chahiye.


      • <a href="https://www.instaforex.org/ru/?x=ruforum">InstaForex</a>
      • #4 Collapse

        -:Money Flow Index Indicator-:

        Money Flow Index (MFI) ek technical analysis indicator hai jo market ke momentum aur money flow ko measure karta hai. Yeh ek oscillator hai, jo traders ko stock ya anya financial instruments ke price movements ke trends aur potential reversals ke bare mein information pradan karta hai. MFI primarily overbought ya oversold conditions ka pata lagane mein madad karta hai.

        -:Money Flow Index Indicator Ki Calculation-:

        MFI calculation money flow ke concept par adharit hoti hai. Niche diye gaye steps MFI calculate karne ke liye hote hain:
        1. Money Flow (MF) Calculation:
          • Money Flow = (Close Price - Open Price) x Volume
          • Agar Close Price, Open Price se bada hai, to Money Flow positive hota hai.
          • Agar Close Price, Open Price se chhota hai, to Money Flow negative hota hai.
        2. Positive Money Flow (PMF) and Negative Money Flow (NMF) Calculation:
          • PMF: Sum of Money Flow for all the days where the closing price is higher than the previous day's closing price.
          • NMF: Sum of Money Flow for all the days where the closing price is lower than the previous day's closing price.
        3. Money Ratio Calculation:
          • Money Ratio = PMF / NMF
        4. Money Flow Index Calculation:
          • MFI = 100 - (100 / (1 + Money Ratio))


        MFI ki range 0 se 100 ke beech hoti hai. Generally, MFI values 70 se upar overbought conditions ko indicate karte hain, jabki values 30 se neeche oversold conditions ko darust karti hain. Traders is indicator ka istemal karte hain to identify potential trend reversals, divergences, ya extremes in market conditions. Lekin, as always, kisi bhi indicator ka istemal karne se pahle, doosre technical analysis tools aur fundamental analysis ke saath combine karna important hai.

        اب آن لائن

        Working...
        X