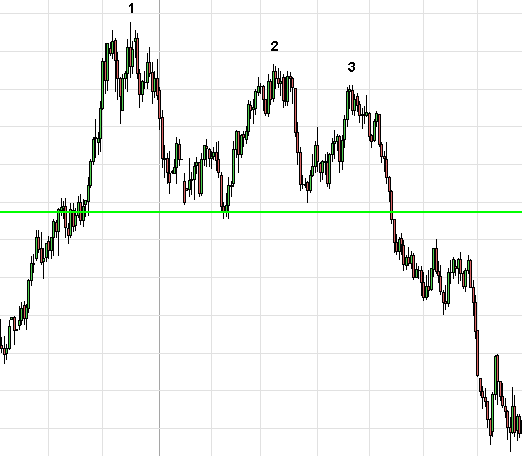
What is Triple top candlestick pattern

No announcement yet.
`
X
  • وقت
  • دکھائیں
Clear All
new posts
  • #1 Collapse

    What is Triple top candlestick pattern
    What is Triple top candlestick pattern kai hai


    Click image for larger version

Name:	download - 2023-12-30T202524.305.png
Views:	50
Size:	5.1 کلوبائٹ
ID:	12799989

    Triple Top ek technical analysis pattern hai jo market mein trend reversal ko suggest karta hai. Yeh pattern price chart par triple peaks (teesri baar ki high) ke roop mein dikhta hai. Yeh uptrend ke baad aata hai aur bearish reversal ke indication ke roop mein dekha ja sakta hai.

    Triple Top Candlestick Pattern ki pehchan karne ke liye kuch key characteristics hain:
    1. Three Peaks: Triple Top pattern mein, price chart par teen successive peaks hote hain jo approximately ek hi horizontal level par hote hain. Ye peaks resistance level ko darust karte hain jahan se price bar-bar neeche aati hai.
    2. Declining Volume: Har ek peak ke saath, trading volume mein bhi decrease hota hai. Yeh decline in volume, traders ke interest mein kami ko darust karta hai aur reversal ki possibility ko highlight karta hai.
    3. Breakdown Below Support: Jab price teesri baar se bhi neeche aati hai aur support level ko breach karti hai, tab triple top pattern confirm hota hai. Is point par traders ko ye indication milta hai ki uptrend khatam ho gaya hai aur bearish trend shuru hone wala hai.

    Triple Top pattern bearish reversal ke ek signal ke taur par consider hota hai, aur iski pehchan karne ke baad traders selling positions mein enter kar sakte hain ya existing long positions ko close kar sakte hain. Lekin, hamesha yaad rahe ki kisi bhi pattern ko confirm karne ke liye, dusre technical indicators aur market conditions ko bhi madhya mein rakhna important hai. False signals se bachne ke liye, confirmatory factors ka istemal karna zaroori hai.
  • <a href="https://www.instaforex.org/ru/?x=ruforum">InstaForex</a>
  • #2 Collapse

    What is Triple top candlestick pattern kai hai

    Click image for larger version

Name:	download - 2023-12-30T203919.694.jpeg
Views:	48
Size:	14.1 کلوبائٹ
ID:	12799994

    "Triple Top" ek technical analysis chart pattern hai jo market mein trend reversal ko indicate karta hai. Yeh pattern generally uptrend ke baad dikhta hai aur traders ko batata hai ke market mein potential downtrend shuru ho sakta hai.

    Triple Top pattern ka concept simple hai:
    1. Three Peaks (Tops): Market chart par teen peaks (tops) dikhte hain, jo lagbhag ek hi level par hote hain. Har peak ke baad ek dip hota hai, lekin overall trend upar ki taraf hota hai.
    2. Resistance Level: Teen tops ke level ko connect karke ek horizontal resistance line ban jati hai. Yeh line traders ke liye important hoti hai, kyunki yeh dikhata hai ke market ne teen baar ek specific price level ko paar nahi kiya.
    3. Downtrend Confirmation: Triple Top pattern ko confirm karne ke liye, price ko woh resistance level neeche jaana chahiye. Agar ye level break hota hai, toh ye ek downtrend ke shuru hone ka signal hai.

    Triple Top pattern traders ko ye batata hai ke market mein teen baar ek particular level ko cross karne mein nakami hui hai, aur ab market neeche jaane ki possibility hai. Traders is pattern ko dekhte hain taaki woh apne positions ko adjust kar sakein ya phir potential short positions le sakein.

    Hamesha yaad rahe ke technical analysis patterns ki accuracy market conditions par depend karti hai, aur isliye ek comprehensive analysis ke saath risk management bhi important hai. Triple Top pattern ko samajhne ke liye, aapko market trends, support and resistance levels, aur price action ka dhyan rakhna hoga.
    • #3 Collapse

      What is Triple top candlestick pattern kai hai


      Triple Top ek bearish reversal candlestick pattern hai, jo market trend reversal ko indicate karta hai. Is pattern mein market par three consecutive peaks (high points) hote hain, jo nearly same resistance level ko touch karte hain. Triple Top formation ka visual representation aise hota hai:

      bashCopy code
      /\ /\ / \ / \ / \ / \ /______\ /______\
      Triple Top pattern ka structure is tarah hota hai:
      1. First Peak (Left Peak):
        • Market uptrend mein hota hai aur price ek peak tak pahunchta hai, jo left peak kehlata hai.
        • Yeh peak ek resistance level ko touch karta hai.
      2. First Retracement (Valley):
        • Price thoda girta hai, indicating a retracement or pullback from the initial peak.
        • Lekin, retracement itna zyada nahi hota ki uptrend khatam ho jaye.
      3. Second Peak (Middle Peak):
        • Price fir se upar jaata hai aur ek aur peak banata hai, jo middle peak kehlata hai.
        • Yeh bhi approximately same resistance level ko touch karta hai jo left peak ne touch kiya tha.
      4. Second Retracement (Valley):
        • Price dobara se girta hai, indicating another retracement or pullback from the middle peak.
        • Lekin, fir bhi retracement itna zyada nahi hota.
      5. Third Peak (Right Peak):
        • Price phir se upar jaata hai aur ek aur peak banata hai, jo right peak kehlata hai.
        • Yeh bhi approximately same resistance level ko touch karta hai jo left aur middle peaks ne touch kiya tha.
      6. Neckline Break:
        • Triple Top pattern ko confirm karne ke liye, price ko ek "neckline" ko break karna padta hai. Neckline, left aur middle peaks ke through draw kiya jata hai.
        • Agar price is neckline ko break karta hai aur neeche jaata hai, to ye bearish reversal ko indicate karta hai.

      Triple Top pattern ka interpretation hota hai ki buyers ke control mein thakaan aa gayi hai aur ab sellers ka dominance badh raha hai. Traders is pattern ko dekhte hain takki wo potential trend reversal ko identify kar sakein aur apne trading strategies ko uske anusaar adjust kar sakein.
      • #4 Collapse


        Triple Top candlestick pattern ek technical analysis ka pattern hai jo ke market mein trend reversal ko darust karnay mein madadgar hota hai. Is pattern ko samajhnay ke liye, hamain candlestick charts ki madad se market ke behavior ko observe karna zaroori hai.

        Is pattern mein teen alag alag peaks ya tops nazar aatay hain, jo ke ek dusre ke barabar hote hain. Jab market mein kisi trend ki growth hoti hai aur phir teen martaba wohi level touch hota hai, to yeh ek indication hoti hai ke buyers ka interest kam ho raha hai aur sellers ka dominance barh raha hai.

        Key Notes:
        1. Triple Top Structure: Triple Top pattern ka sab se ahem pehlu yeh hai ke market mein teen baar ek specific level ko touch karna. Yeh teen tops ek dusre ke bilkul barabar hote hain aur yeh market ke instability ko darust kartay hain.
        2. Trend Reversal Indicator: Triple Top pattern ek trend reversal indicator hai. Yeh dikhata hai ke market mein bullish trend kamzor ho rahi hai aur bearish trend barh raha hai.
        3. Volume Confirmation: Is pattern ko samajhnay ke liye, volume ki confirmation bhi dekhi jaati hai. Agar teeno tops ke doran volume bhi kamzor hota hai, to yeh aur bhi strong indication hai ke market reversal hone wala hai.
        4. Support and Resistance Levels: Triple Top pattern ke doran support aur resistance levels ka bhi khayal rakhna zaroori hai. Agar market ek specific level ko teen martaba touch kar rahi hai, to yeh level strong support ya resistance ban sakta hai.

        Triple Top candlestick pattern ka tajziya kar ke traders apne trading decisions ko improve kar saktay hain aur market trends ko samajhnay mein madad hasil kar saktay hain.


        • #5 Collapse

          What is Triple top candlestick pattern

          Click image for larger version

Name:	download - 2024-01-01T085414.310.png
Views:	39
Size:	11.1 کلوبائٹ
ID:	12800567


          "Triple Top" ek technical analysis chart pattern hai jo market trends ko analyze karne ke liye istemal hota hai. Yeh pattern ek bearish reversal pattern hai, yaani ke iska appearance uptrend ke baad hota hai aur ye indicate karta hai ke market mein potential downtrend shuru ho sakta hai.

          Triple Top Candlestick Pattern Ka Tareeqa:
          1. Three Peaks (Tops): Market chart par teen high points (tops) dikhte hain, jo lagbhag ek hi level par hote hain. Har peak ke baad ek dip hota hai, lekin overall trend upar ki taraf hota hai.
          2. Resistance Level: Teen tops ke level ko connect karke ek horizontal resistance line ban jati hai. Yeh line traders ke liye important hoti hai, kyunki yeh dikhata hai ke market ne teen baar ek specific price level ko paar nahi kiya.
          3. Downtrend Confirmation: Triple Top pattern ko confirm karne ke liye, price ko woh resistance level neeche jaana chahiye. Agar ye level break hota hai, toh ye ek downtrend ke shuru hone ka signal hai.

          Triple Top Candlestick Pattern Ko Samajhne Ka Maqsad:

          Triple Top pattern traders ko ye batata hai ke market mein teen baar ek particular level ko cross karne mein nakami hui hai, aur ab market neeche jaane ki possibility hai. Traders is pattern ko dekhte hain taaki woh apne positions ko adjust kar sakein ya phir potential short positions le sakein.

          Hamesha yaad rahe ke technical analysis patterns ki accuracy market conditions par depend karti hai, aur isliye ek comprehensive analysis ke saath risk management bhi important hai. Triple Top pattern ko samajhne ke liye, aapko market trends, support and resistance levels, aur price action ka dhyan rakhna hoga
          • #6 Collapse

            Triple top candlestick pattern ek bearish reversal pattern hai jo price charts par form hota hai. Yeh pattern tab banta hai jab price teen baar ek hi resistance level par hit hoti hai, lekin har dafa wo us level ko cross nahi kar pati. Yeh pattern traders ke liye ek signal hota hai ke market mein bearish trend shuru hone wala hai, aur iske baad price ka girna kaafi aasan hota hai. Triple top pattern kaafi simple hota hai aur iski pehchaan karna aasaan hota hai. Yeh pattern teen tops ya peaks se mil kar banta hai, jo ke almost ek hi horizontal level par hote hain. Har peak ke darmiyan, price thodi girti hai, lekin fir se usi resistance level ki taraf badhti hai.


            Pattern ki Structure
            1. Pehla Top: Yeh pehla peak hota hai jab price resistance level tak pahunchti hai. Is dauraan market bullish hota hai.
            2. Doosra Top: Iske baad price thodi girti hai, lekin phir se usi resistance level tak pahunchti hai. Yeh doosra top bhi pehle top ke barabar hota hai.
            3. Teesra Top: Teesra top bhi same resistance level par hota hai, lekin is dauraan bullish momentum kam hota hai.
            Pattern ke features
            • Time Frame: Yeh pattern kisi bhi time frame par ban sakta hai, lekin daily aur weekly charts par zyada reliable mana jata hai.
            • Volume: Volume ki decrease bhi is pattern ka hissa hota hai. Jaise jaise price teesra top banati hai, volume bhi kam hota hai, jo bearish trend ki taraf ishaara karta hai.
            Triple Top Pattern Ki Formation
            Triple top pattern ka formation kuch is tarah hota hai:
            1. Pehla Phase: Price resistance level tak pahunchti hai, aur yeh bullish sentiment ko darshata hai. Is dauraan traders ko profit booking ka mauka milta hai.
            2. Gharai: Pehle top ke baad, price girti hai aur ek support level tak pahunchti hai. Yeh support level price ko stabilize karta hai, aur traders ko yeh sochne par majboor karta hai ke kya price wapas uthne wali hai.
            3. Doosra Phase: Price do baar phir se resistance level tak pahunchti hai. Yeh bullish momentum ko darshata hai, lekin is dauraan traders ko yeh mehsoos hota hai ke price resistance ko cross nahi kar rahi hai.
            4. Teesra Phase: Price teesra top banati hai, lekin volume dheere dheere kam hota jata hai. Is dauraan bearish sentiment badhta hai, aur traders ko price girne ka andesha hota hai.
            Triple Top Pattern Ka Importance
            Triple top pattern kaafi aham hai trading mein, kyunki yeh bearish reversal ka signal deta hai. Yeh pattern un traders ke liye useful hota hai jo market ki direction ka andaza lagana chahte hain. Jab yeh pattern form hota hai, to yeh traders ko yeh sochne par majboor karta hai ke ab unko sell karna chahiye ya market se nikal jana chahiye.

            Reasons for Importance
            • Market Psychology: Yeh pattern market participants ki psychology ko darshata hai. Pehle do tops par bullish sentiment hota hai, lekin teesra top par market sentiment kamzor hota hai. Iska matlab hai ke traders ke beech uncertainty hai.
            • Risk Management: Triple top pattern traders ko yeh samajhne mein madad karta hai ke unko kab apni positions close karni chahiye. Agar price teesra top banate waqt girti hai, to yeh ek acha signal hai sell karne ka.
            • Confirmation: Is pattern ki confirmation tab hoti hai jab price teesre top ke baad support level ko break karti hai. Yeh bearish confirmation ke liye ek strong signal hota hai.
            Entry Aur Exit Points
            Triple top pattern ki trading strategy ke liye entry aur exit points ka samajhna zaroori hai. Yeh kuch steps hain jo aapko follow karne chahiye:
            1. Entry Point: Teesra top banne ke baad, traders ko yeh dekhna chahiye ke kya price support level ko break karti hai ya nahi. Agar price break hoti hai, to yeh ek acha entry point hota hai sell karne ke liye.
            2. Stop Loss: Stop loss ko teesre top ke upar set karna chahiye. Is tarah agar market bullish hoti hai, to aap apne losses ko control kar sakte hain.
            3. Target Price: Target price ko previous support level ya lower support level ke aas paas set karna chahiye. Yeh aapko ek risk-reward ratio provide karta hai.
            4. Confirmation: Is pattern ki confirmation ke liye volume ka analysis bhi karna zaroori hai. Agar price support level ko break karti hai aur volume bhi badhta hai, to yeh bearish confirmation ka strong signal hota hai.
            Example

            Step 1: Aap ek stock chart dekhte hain jismein price teen baar ek hi resistance level (let's say 100) tak pahunchti hai.

            Step 2: Pehla top 100 par banta hai aur phir price 90 tak girti hai.

            Step 3: Doosra top phir se 100 par banta hai, lekin is baar price 85 tak girti hai.

            Step 4: Teesra top bhi 100 par banta hai, aur is baar price 80 tak girti hai. Is dauraan volume dheere dheere kam hota hai.

            Step 5: Jab price 80 ko break karti hai, to yeh aapke liye sell karne ka signal hota hai. Aap stop loss ko 101 par set karte hain, aur target price ko 70 par rakhte hain.

            Market Psychology Aur Triple Top
            Triple top pattern ki formation market psychology ko darshata hai. Pehle do tops par bullish sentiment hota hai, jahan traders ko lagta hai ke price phir se upar jayegi. Lekin teesra top banate waqt traders ko yeh mehsoos hota hai ke market bullish momentum khatam ho raha hai.
            • Market Sentiment: Jab price resistance level par bar-bar hit karti hai, to traders mein fear aur uncertainty ka ahsas hota hai. Yeh feeling unhe position ko close karne ya selling pressure create karne par majboor karti hai. Agar bullish trend sustain nahi hota, to traders ko market ke bearish hone ka dar hota hai.
            • Volume Analysis: Volume ki decrease bhi market sentiment ko darshata hai. Agar volume teesre top par kam hota hai, to iska matlab hai ke buyers ke paas strength nahi hai. Yeh bearish sentiment ko darshata hai aur sellers ki dominance ka asar hota hai.
            Triple Top Pattern Ka Limitations
            Jab ke triple top pattern kaafi reliable hai, lekin iske kuch limitations bhi hain:
            1. False Signals: Kabhi kabhi yeh pattern false signals de sakta hai. Agar price support level ko break nahi karti, to traders ko loss ho sakta hai. Is liye stop loss ka istemal karna zaroori hai.
            2. Market Conditions: Agar market bullish trend mein hai, to triple top pattern itna effective nahi hoga. Market ki overall conditions ko hamesha dekhna chahiye.
            3. Time Frame: Yeh pattern kisi bhi time frame par ban sakta hai, lekin short time frames par yeh kam reliable hota hai. Long-term charts par iski reliability zyada hoti hai.
            4. Volume Anomalies: Kabhi kabhi volume analysis misleading ho sakta hai. Is liye volume trends ko analyze karte waqt careful hona chahiye.
            Trading Strategies with Triple Top
            Triple top pattern ka istemal karte waqt kuch trading strategies hain jo aapko madadgar sabit ho sakti hain:
            1. Trend Following: Agar aap trend-following trader hain, to triple top ko apne trading system mein integrate kar sakte hain. Is pattern ko identify karne ke baad, aap bearish trades enter kar sakte hain.
            2. Options Trading: Options trading mein triple top ka istemal karte waqt aap put options buy kar sakte hain. Agar aapko lagta hai ke market bearish hone wala hai, to yeh strategy aapko profit dilane mein madad karegi.
            3. Hedging: Agar aap long positions mein hain aur triple top ka signal milta hai, to aap short positions ya put options ka istemal karte hue apne portfolio ko hedge kar sakte hain.
            4. Combining Indicators: Aap technical indicators ka istemal karte hue triple top pattern ko confirm kar sakte hain. For example, moving averages ya Relative Strength Index (RSI) ko use karna.


            Triple top candlestick pattern trading ka aik important tool hai jo traders ko market ki reversal points ko identify karne mein madad karta hai. Yeh pattern bullish momentum ke khatam hone ka signal deta hai aur traders ko selling pressure ke liye tayar karta hai.

            Is pattern ki formation market psychology, volume analysis, aur price action ke principles par based hoti hai. Triple top ka istemal karte waqt entry aur exit points ko samajhna, stop loss set karna, aur target price ko define karna zaroori hai. triple top pattern ek valuable trading strategy hai, lekin isse kabhi bhi ek standalone signal ki tarah nahi lena chahiye. Hamesha market conditions, volume trends, aur apni trading strategy ke sath combine karte hue analysis karna chahiye. Is tarah aap apne trading results ko behtar bana sakte hain aur profitable decisions le sakte hain.
            Believe in yourself and your abilities. When you fight for your dreams, you can achieve anything.
            • #7 Collapse

              What is the Triple Top Candlestick Pattern?

              Introduction:
              Triple Top Candlestick Pattern ek popular reversal pattern hai jo market ke uptrend ke end hone aur potential downtrend shuru hone ka indication deta hai. Yeh pattern tab banta hai jab price chart par ek specific formation hoti hai jisme price teen dafa ek hi resistance level ko touch karta hai, lekin us level ko break nahi kar pata, aur phir wahan se neeche ki taraf reversal hota hai.

              Forex, stocks, aur commodities trading mein, triple top pattern ko bearish reversal ka strong signal mana jata hai. Is pattern ko samajhkar traders apne trades ko adjust karte hain, taki wo potential downtrend ke liye ready ho sakein.

              Structure of Triple Top Pattern
              Triple top pattern ka structure kaafi simple hota hai, lekin iske sahi interpretation ke liye aapko kuch important points ko samajhna hoga. Is pattern mein market price teen dafa ek resistance level ko test karti hai, lekin har dafa us level ko break karne mein nakam hoti hai. Har top ke beech mein price thoda neeche aata hai, aur teesri dafa jab price neeche aati hai, to wo support level ko break kar ke ek new downtrend ki shuruaat karti hai.

              1. Three Peaks (Teen Highs):
              Triple top pattern ka sabse important hissa teen highs hain. Yeh highs approximately same level par bante hain, jo resistance level hota hai. Har top ke baad price neeche aati hai, lekin market wapas se resistance level ko test karti hai. Jab price teesri dafa bhi us level ko cross nahi kar pati, to yeh ek bearish signal hota hai.

              2. Support Level:
              Is pattern mein ek horizontal support line hoti hai jo har peak ke neeche banne wale lows ko connect karti hai. Jab price teesri dafa neeche aati hai aur yeh support level break hota hai, to pattern complete hota hai aur ek naya downtrend shuru hota hai.

              3. Volume Confirmation:
              Triple top pattern ki confirmation ke liye volume ka role bhi important hota hai. Jab price teesri dafa resistance level se neeche aati hai aur support break hota hai, to volume mein bhi increase hoti hai, jo ke bearish momentum ko confirm karta hai.

              How to Identify a Triple Top Pattern?
              Triple top pattern ko identify karna mushkil nahi hota, lekin iske liye aapko market ki price action ko achhi tarah study karna hota hai. Yahan kuch steps hain jo aapko help karenge triple top pattern ko dekhne aur samajhne mein:

              Step 1: Look for an Uptrend
              Sab pehle, yeh pattern sirf tab banta hai jab market ek uptrend mein hoti hai. Triple top pattern ko reversal pattern mana jata hai, is liye yeh tabhi meaningful hota hai jab market pehle se upward direction mein move kar rahi ho.

              Step 2: Spot Three Similar Peaks
              Chart par dekhna hoga ke price teen dafa approximately same level par resistance ko touch karti hai. Har peak ke baad price neeche aati hai, lekin fir market wapas resistance level ko test karti hai. Yeh teen peaks almost barabar ke levels par bante hain.

              Step 3: Identify the Support Level
              Teen peaks ke beech mein price neeche aakar ek horizontal support level banati hai. Yeh support line pattern ka important hissa hoti hai, kyunki jab price is support ko break karti hai, to pattern complete hota hai.

              Step 4: Confirm with Volume
              Price ke neeche girne ke waqt volume ko bhi dekhna zaroori hai. Jab price support break karti hai, to volume mein bhi significant increase hota hai, jo ke bearish trend ki confirmation hoti hai.

              Example of a Triple Top Pattern
              Agar aap forex trading kar rahe hain aur EUR/USD pair par ek triple top pattern ban raha hai, to iska matlab yeh ho sakta hai ke currency pair ka uptrend end hone wala hai aur ek naya downtrend shuru ho sakta hai. Suppose, price pehle 1.2000 ke level ko test karti hai, phir neeche aati hai, phir wapas se 1.2000 ko test karti hai, aur phir teesri dafa bhi usi level ko touch kar ke neeche girti hai. Jab price finally 1.1800 ke support ko break karti hai, to triple top pattern confirm ho jata hai, aur traders selling opportunities dekhne lagte hain.

              Trading the Triple Top Pattern
              Triple top pattern ko trade karte waqt kuch key points ko yaad rakhna zaroori hota hai, taki aap apne trades ko sahi tareeqe se plan kar sakein. Yeh strategy kaafi simple hoti hai lekin risk management aur confirmation signals ka istemal karna zaroori hota hai.

              1. Entry Point:
              Jab price teesri dafa resistance level se neeche aati hai aur support level ko break karti hai, to yeh entry ka best point hota hai. Aap sell trade tab enter karte hain jab price support line ke neeche close hoti hai, aur volume mein increase hota hai. Yeh signal deta hai ke market ab downtrend ki taraf move kar rahi hai.

              2. Stop Loss:
              Stop loss set karna trading ka important hissa hota hai. Triple top pattern trade karte waqt, aap apna stop loss last peak ke thoda upar set karte hain. Agar price wapas se resistance level ko break kar le, to iska matlab yeh hoga ke pattern fail ho gaya hai, aur aapka stop loss aapko zyadatar loss se bacha lega.

              3. Profit Target:
              Profit target set karte waqt, aap pattern ki height ko measure kar sakte hain, yani resistance aur support ke darmiyan distance ko dekh kar. Is height ko support break ke baad downward projection ke liye use kiya jata hai. Is projection se aap apne profit targets ko set kar sakte hain.

              4. Risk Management:
              Risk management is strategy ka zaroori hissa hota hai. Aapko apne trades mein kabhi zyada risk nahi lena chahiye. Triple top pattern trade karte waqt proper risk-to-reward ratio ka dhyan rakhna chahiye, taki aap apne loss ko control kar sakein aur potential profits maximize kar sakein.

              How to Confirm the Triple Top Pattern?
              Triple top pattern ko confirm karne ke liye aapko sirf chart par highs aur lows ko nahi dekhna chahiye, balki kuch additional factors ko bhi dhyan mein rakhna chahiye, taki aapke trades zyada accurate hon.

              1. Volume Confirmation:
              Volume ek important indicator hota hai. Jab price resistance level ko break karne mein nakam hoti hai aur teesri dafa neeche aati hai, to volume mein bhi increase hota hai. Volume confirmation ke bina, pattern ka signal kamzor ho sakta hai.

              2. Time Duration:
              Triple top pattern ka duration bhi dekhna zaroori hota hai. Agar yeh pattern bohot chhoti time frame mein ban raha hai, to iska signal weak ho sakta hai. Yeh pattern zyada reliable tab hota hai jab yeh longer time frames, jaise daily ya weekly charts par banta hai.

              3. Divergence Indicators:
              Sab traders divergence indicators ka bhi istimaal karte hain, jaise ke RSI (Relative Strength Index) ya MACD (Moving Average Convergence Divergence), taki pattern ke reversal signal ko confirm kiya ja sake. Agar RSI overbought levels ko show kar raha ho aur price triple top pattern bana raha ho, to yeh ek strong confirmation hoti hai ke reversal aaney wala hai.

              Advantages of Triple Top Pattern
              1. Clear Reversal Signal: Triple top pattern ek strong aur clear signal deta hai ke market uptrend ke baad reversal karne wali hai. Is pattern ko identify karna relatively easy hota hai, jo beginners ke liye helpful hota hai.
              2. Easy to Recognize: Is pattern ka structure simple hota hai, jo aapko quickly identify karne mein madad deta hai. Isse aap timely trade decisions le sakte hain.
              3. Works Across Markets: Yeh pattern sirf forex mein nahi, balki stocks, commodities, aur cryptocurrencies jese markets mein bhi kaam karta hai.
              Disadvantages of Triple Top Pattern
              1. False Breakouts: Kabhi kabhi market mein false breakouts bhi ho sakte hain, jisme price temporarily support ko break karti hai lekin wapas upar jaati hai. Is wajah se aapko confirmation signals ka intezaar karna hota hai.
              2. Time Consuming: Triple top pattern banne mein waqt lagta hai, kyunki market ko teen peaks form karne hote hain. Agar aap impatience mein trade karte hain to yeh pattern aapke liye mushkil ho sakta hai.
              3. Less Effective in Choppy Markets: Sideways ya choppy markets mein yeh pattern kaam nahi karta, kyunki price clear trends nahi banati.
              Conclusion
              Triple Top Candlestick Pattern forex aur stock trading mein ek powerful reversal signal hai jo uptrend ke baad downtrend ke shuru hone ka indication deta hai. Is pattern ko samajhna aur sahi tarah se trade karna traders ke liye profitable ho sakta hai, lekin risk management aur confirmation indicators ka istimaal zaroori hota hai. Agar aap is pattern ka sahi analysis karen aur market ke signals ko follow karein, to aap apne trading results ko improve kar sakte hain.
              • <a href="https://www.instaforex.org/ru/?x=ruforum">InstaForex</a>
              • #8 Collapse

                ### Triple Top Candlestick Pattern
                1. **T التعريف:**
                - Triple top candlestick pattern ek bearish reversal pattern hai jo uptrend ke doran banta hai.
                - Ye pattern teen consecutive highs ko indicate karta hai, jo price ki resistance level ko darshata hai.

                2. **Formation:**
                - Is pattern ki formation tab hoti hai jab price teen baar ek hi resistance level ko test karti hai.
                - Har bar price us level par fail hoti hai aur neeche gir jati hai, jo bearish sentiment ko darshata hai.

                3. **Market Sentiment:**
                - Triple top pattern ka hona market ki sellers ki strength ko darshata hai.
                - Ye indicate karta hai ke buyers ki power kam ho rahi hai aur sellers market mein control hasil kar rahe hain.

                4. **Pattern ki Shakal:**
                - Ye pattern 'M' shape ki tarah hota hai, jahan teen peaks banti hain aur beech mein dips hote hain.
                - Pehla high, doosra high, aur teesra high aapas mein almost same level par hota hai.

                5. **Breakout Point:**
                - Pattern tab confirm hota hai jab price teesre high ke baad neeche girti hai aur support level break karti hai.
                - Ye breakout bearish signal hota hai, jo price mein significant decline ki taraf ishaara karta hai.

                6. **Volume ka Asar:**
                - Is pattern ki effectiveness ko volume ke sath dekhna chahiye.
                - Agar teesra peak volume ke saath aata hai, to ye bearish reversal ki confirmation deta hai.

                7. **Stop-Loss Placement:**
                - Trader ko apne stop-loss ko pattern ke teesre high ke thoda upar lagana chahiye, taake agar price wapas upar jati hai to loss control mein rahe.
                - Ye risk management ka important hissa hai.

                8. **Target Price:**
                - Target price kaise tay karein:
                - Pattern ke breakout point se support level ki distance ko measure karke, is distance ko breakout point se subtract karein.
                - Isse aapko estimated target price milta hai.

                9. **Limitations:**
                - Triple top pattern hamesha successful nahi hota; false breakouts ka khatara hota hai.
                - Is pattern ko dusre technical indicators ke sath confirm karna chahiye, jaise moving averages ya RSI.

                10. **Conclusion:**
                - Triple top candlestick pattern trading mein aik ahmiyat rakhta hai kyunki ye bearish reversal ka indication deta hai.
                - Is pattern ko samajhkar aur dusre technical indicators ke sath combine karke trader profitable trades kar sakte hain.
                - Risk management aur market conditions ka khayal rakhkar trader is pattern se faida utha sakte hain.

                اب آن لائن

                Working...
                X