What is Tweezer Bottom pattern
X
  • وقت
  • دکھائیں
Clear All
new posts
  • #1 Collapse

    What is Tweezer Bottom pattern
    What is Tweezer Bottom pattern

    Click image for larger version

Name:	download (95).png
Views:	41
Size:	5.5 کلوبائٹ
ID:	12797828


    "Tweezer Bottom" ek bullish reversal candlestick pattern hai, jo market analysis mein istemal hota hai. Ye pattern typically downtrend ke baad aata hai aur bullish reversal ko suggest karta hai. "Tweezer Bottom" pattern ko samajhne ke liye, yahan kuch key points hain:

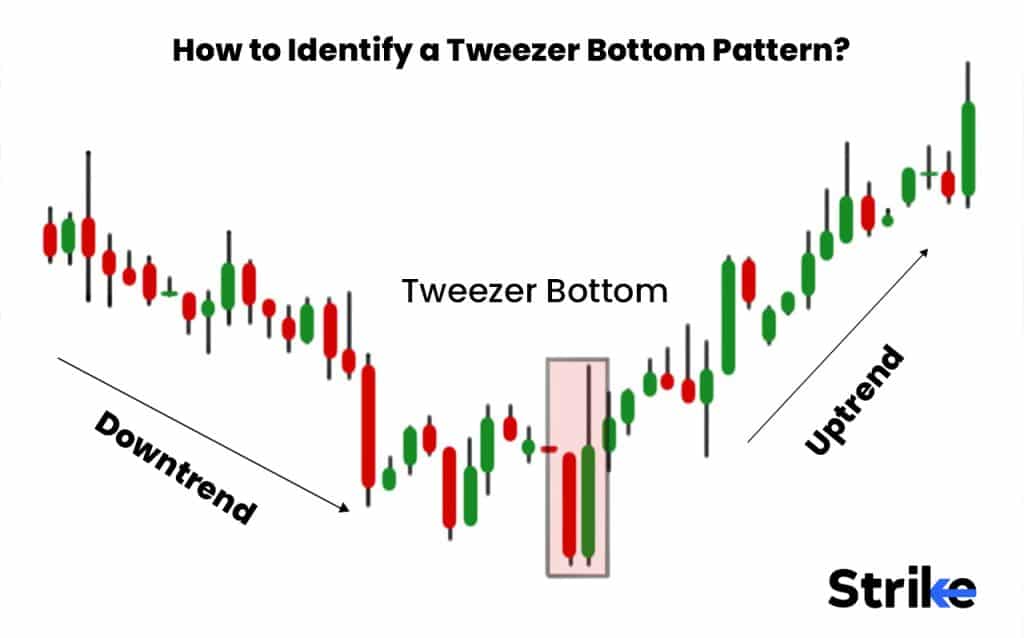
    Tweezer Bottom Pattern Ka Formation (ٹویزر بوٹم پیٹرن کا ڈھانچہ):
    1. Downtrend:
      • "Tweezer Bottom" pattern ek existing downtrend ke baad hota hai, jismein prices lower lows aur lower highs banate hain.
    2. Two Consecutive Bottoms:
      • Pattern mein do consecutive candles hote hain, jinmein dono candles ka low nearly ek hi level par hota hai. Ye dono bottoms ko represent karte hain.
    3. Long Lower Shadows:
      • Dono candles ke lower shadows (yaani ke tails) lambi hote hain, indicating ki bears initially control mein the, lekin phir bulls ne control le liya.
    4. No Upper Shadows:
      • Preferably, dono candles ke upper shadows hone chahiye, lekin ideally, ye shadows chhote ya zero hone chahiye. Iska matlab hai ki closing price candle ke upper end ke kareeb hoti hai.

    Interpretation (تشخیص):
    • "Tweezer Bottom" pattern ka appearance downtrend ke exhaustion ya reversal ko suggest karta hai. Ye pattern market sentiment mein bullish shift ko darust karta hai.

    Trading Strategies (ٹریڈنگ استریٹیجیز):
    1. Long Positions:
      • "Tweezer Bottom" pattern ke appearance par traders long positions lete hain, expecting ke bullish trend shuru hoga.
      • Entry point candlestick pattern ke confirmation ke baad set kiya ja sakta hai.
    2. Stop-Loss:
      • Stop-loss order ko set karna important hai taki unexpected market movements se bacha ja sake.
      • Stop-loss order ko candlestick pattern ke opposite side par set karna zaroori hai.
    3. Target:
      • Target ko set karne ke liye traders previous highs ya resistance levels ko consider karte hain.
      • Risk-reward ratio ka bhi dhyan rakhna important hai.
    4. Confirmation with Other Indicators:
      • Traders doosre technical indicators ya trend analysis ke saath "Tweezer Bottom" pattern ka istemal karte hain for additional confirmation.

    Hamesha yaad rahe ke kisi bhi candlestick pattern ka istemal karne se pehle market conditions aur doosre technical indicators ka bhi analysis karna zaroori hai. Risk management aur disciplined approach bhi trading mein important hain.
  • <a href="https://www.instaforex.org/ru/?x=ruforum">InstaForex</a>
  • #2 Collapse

    What is Tweezer Bottom pattern


    Click image for larger version

Name:	download (97).png
Views:	39
Size:	3.9 کلوبائٹ
ID:	12797836

    "Tweezer Bottom" ek candlestick pattern hai jo market mein hone wale potential trend reversals ko darust karta hai. Ye pattern typically downtrend ke baad aata hai aur indicate karta hai ke bears ki control kamzor ho rahi hai aur bulls ke favor mein shift ho sakta hai.

    Tweezer Bottom pattern ka main feature hai ki do consecutive candles ek dusre ke neeche close hote hain, jismein dono candles ki lower shadows (yaani ke neeche wali chhoti lines) ek dusre ke bilkul paas hoti hain. Ye pattern buyers ki strong comeback ko darust karta hai.

    Key components of the Tweezer Bottom pattern:
    1. Downtrend (Girawat): Tweezer Bottom pattern generally downtrend ke baad aata hai. Pehle candle ek bearish (girawat wala) candle hota hai jo market mein downtrend ko represent karta hai.
    2. Gap Down or Same Opening Price: Doosre candle mein, ya toh ek gap down ke sath open hota hai ya fir woh almost same level par open hota hai. Is candle ki body bearish ho sakti hai.
    3. Lower Shadows Close Together: Both candles ki lower shadows yaani ke neeche ki chhoti lines ek dusre ke bohot kareeb hoti hain, almost at the same price level. Ye indicate karta hai ke sellers neeche jaa kar control nahi bana sake hain.
    4. Bulls' Comeback: Tweezer Bottom pattern buyers (bulls) ki strong comeback ko darust karta hai, aur ye suggest karta hai ke ab market mein trend reversal hone ke chances hain.

    Traders Tweezer Bottom pattern ko dekhte hain taaki wo samajh sake ke market mein buying pressure badh rahi hai aur potential entry points ya trend reversal ko identify kar sakein. Hamesha yaad rahe ke ek single pattern par pura bharosa na karein, aur doosre technical indicators aur analysis tools ka bhi istemal karein trading decisions ke liye.
    • #3 Collapse

      What is Tweezer Bottom pattern kai hai

      Click image for larger version

Name:	download (73).jpeg
Views:	28
Size:	14.1 کلوبائٹ
ID:	12797854


      Tweezer Bottom pattern, ek candlestick pattern hai jo financial markets mein dekha ja sakta hai aur ye bullish reversal ko indicate karta hai. Yeh pattern market mein girawat (downtrend) ke baad aane wale possible reversal ko darust karta hai. Is pattern mein do consecutive candles shamil hote hain, jo ki lower price levels par close karte hain.

      Yahan Tweezer Bottom pattern ka tafseeli bayan hai:
      1. Pehli Candle: Pehli candle ek downtrend ko represent karti hai aur bearish hoti hai. Is candle ki range ke andar price neeche jaati hai.
      2. Dusri Candle: Dusri candle bhi bearish hoti hai, lekin iski range pehli candle ki range ke andar rehti hai. Dusri candle ki closing price, pehli candle ki opening price ke qareeb hoti hai ya usse neeche.

      Tweezer Bottom pattern ka naam isliye hai kyunki ye pattern tweezer jaise dikhta hai, jismein dono candles ki lower shadows ek dosre ke saath align hoti hain aur yeh market mein neeche jaane ke baad hone wale selling pressure ki kamzori ya exhaustion ko darust karta hai.

      Tweezer Bottom pattern ko confirm karne ke liye, traders doosre indicators aur confirmatory signals ka bhi istemal karte hain. For example, agar is pattern ke baad market mein bullish candlestick formation hoti hai ya phir koi doosra bullish reversal signal aata hai, toh ye Tweezer Bottom pattern ko aur bhi powerful bana deta hai.

      Traders is pattern ko dekhte hain takay wo samajh sakein ke market mein selling pressure kamzor ho rahi hai aur buying pressure badh rahi hai, jo ki ek potential trend reversal ko indicate karta hai. Lekin, jaise har trading pattern ya indicator ke saath hota hai, Tweezer Bottom pattern ko bhi prudent risk management aur doosre confirmatory signals ke saath istemal karna zaroori hai.


      • #4 Collapse

        What is Tweezer Bottom pattern kai hai


        "Tweezer Bottom" ek bullish reversal candlestick pattern hai jo market trends mein hone wale potential reversals ko indicate karta hai. Ye pattern do ya zyada consecutive candlesticks se banta hai aur traders ko ye ishara karta hai ke downtrend ke baad buyers ka comeback ho sakta hai.
        Tweezer Bottom Pattern Ki Khasiyat:
        1. Downtrend Hona:
          • Tweezer Bottom pattern typically ek downtrend ke baad aata hai, jisme market mein consecutive lower lows bante hain.
        2. First Candle (Bearish):
          • Tweezer Bottom pattern ka shuruwat ek bearish (downward) candle se hoti hai, jo downtrend ko continue karta hai.
        3. Second Candle (Bullish):
          • Dusri candle ek bullish (upward) candle hoti hai, jo pehli bearish candle ke neeche close hoti hai. Is bullish candle ka body pehli bearish candle ke body ke qareeb hota hai.
        4. Equal Lows (Tweezer Bottom):
          • Tweezer Bottom ka naam isi wajah se hai kyunki dono candles ke lows aapas mein barabar hote hain ya kafi qareeb hote hain. Ye equal lows indicate karte hain ke sellers ne neeche aur control nahi kiya aur buyers ne comeback kiya hai.
        Tweezer Bottom Pattern Ka Interpretation:
        • Bullish Reversal Signal:
          • Tweezer Bottom pattern ko dekh kar traders ko lagta hai ke downtrend kamzor ho raha hai aur bullish reversal hone ki sambhavna hai.
        • Confirmation:
          • Is pattern ko confirm karne ke liye, traders doosre technical indicators aur market conditions ka bhi mawazna karte hain.
        Points to Remember:
        • Equal Lows:
          • Tweezer Bottom ka main characteristic equal lows hote hain. Isliye, ye important hai ke lows ka dhyan rakha jaye.
        • Volume:
          • Is pattern ke breakout ke saath volume ka bhi dhyan rakha jata hai. Agar breakout volume ke saath hota hai, toh uski authenticity badh jati hai.
        Caveats:
        • Tweezer Bottom pattern ek reversal signal hai, lekin false signals aur market volatility ka bhi dhyan rakhein.
        • Trading decisions banate waqt, risk management principles ko bhi dhyan mein rakhein. Stop-loss orders ka istemal karke apne positions ko protect karna zaroori hai.

        Tweezer Bottom pattern ko samajhne ke liye, traders ko overall market context aur doosre technical tools ka bhi istemal karna chahiye.
        • #5 Collapse


          Tweezer Bottom Pattern:


          Click image for larger version

Name:	download - 2023-12-27T074459.053.png
Views:	28
Size:	2.5 کلوبائٹ
ID:	12797878

          Tweezer Bottom Pattern, candlestick chart analysis mein ek bullish reversal pattern hai, jo market ke potential trend reversal ko indicate karta hai.

          Kya Hai?

          Tweezer Bottom ek candlestick pattern hai jismein do consecutive candlesticks hote hain, jismein pehla candlestick bearish hota hai (downward trend ko represent karta hai) aur doosra candlestick bullish hota hai (upward reversal ko suggest karta hai).

          Kaise Hota Hai?
          1. Pehla Candlestick (Bearish): Tweezer Bottom pattern ke shuruwat pe ek downtrend hota hai aur pehla candlestick red (bearish) hota hai. Is candlestick ka closing price neeche hota hai.
          2. Doosra Candlestick (Bullish): Doosra candlestick green (bullish) hota hai aur iska opening price pehle wale candlestick ke closing price ke aas-pass hota hai ya usse higher hota hai. Ye candlestick uptrend ke shuruat ko darust karta hai.

          Tweezer Bottom pattern ka characteristic ye hota hai ke dono candlesticks ki lower shadows (yaani ke neeche ki choti wicks) ek doosre ke bahut kareeb hoti hain, jisse ek horizontal line ki tarah dikhti hain.

          Kya Indicate Karta Hai?

          Tweezer Bottom pattern indicate karta hai ke market mein bearish trend ke baad buyers ka strong comeback hua hai aur ab uptrend shuru hone wala hai. Ye pattern reversal ka strong signal hai, lekin hamesha confirmatory signals aur dusre technical indicators ka bhi istemal karna zaroori hai.

          Naseehat:
          • Tweezer Bottom pattern ko confirm karne ke liye, traders ko dusre technical indicators aur market analysis tools ka istemal karna chahiye.
          • Is pattern ka istemal ek complete trading strategy ke hisse ke roop mein kiya ja sakta hai, lekin risk management ko hamesha prioritize karein.
          • Kabhi-kabhi false signals bhi ho sakte hain, isliye confirmatory signals ka dhyan rakhein.

          Note: Market analysis aur trading mein risk involved hota hai, isliye traders ko apni research aur risk management par dhyan dena chahiye.
          • <a href="https://www.instaforex.org/ru/?x=ruforum">InstaForex</a>
          • #6 Collapse

            Tweezer Bottom pattern


            "Tweezer Bottom" ek technical analysis pattern hai jo forex market mein price action ko identify karne ke liye istemal hota hai. Ye pattern bearish trend ke reversal ko indicate karta hai. Tweezer Bottom pattern mein do consecutive candlesticks hote hain, jinmein.

            -:Tweezer Bottom pattern ki eqsaam:-
            1. First Candlestick (Bearish):

              Ye candlestick downtrend ke part hota hai aur typically ek downtrend ke ant mein paya jata hai.
            2. Second Candlestick (Bullish):

              Ye candlestick bhi downtrend mein hota hai aur pehle candlestick ke neeche close hota hai. Iska open price first candlestick ke close price ke neeche hota hai. Second candlestick ka body pehle candlestick ke body ke neeche hota hai, indicating a potential reversal.


            Tweezer Bottom ka naam isliye hai kyunki yeh pattern candlestick chart par tweezer jaise dikhta hai, jismein ek chhota bearish candlestick ek lamba bullish candlestick ke saath hota hai, jise "bottom" kehte hain kyun ki yeh downtrend ke bottom ko indicate karta hai.

            Yadi market mein aapko Tweezer Bottom pattern dikhe aur phir market upside move kare, toh traders ye interpret karte hain ki bearish trend khatam ho sakta hai aur bullish trend shuru ho sakta hai. However, hamesha yaad rahe ki kisi bhi technical indicator ya pattern ki tarah, Tweezer Bottom bhi 100% accurate nahi hota, aur traders ko apne trading decisions mein aur bhi factors ko consider karna chahiye.

            Tweezer Bottom pattern ki eqsaam ki ehmiyat:-
            • Pehli Candle (Bearish):
              • Ye candle bearish trend mein hoti hai.
              • Opening price aksar pehle din ki high ke qareeb hoti hai.
              • Is doran bechnay walay (sellers) hawi rehtay hain.
            • Dusri Candle (Bullish):
              • Ye candle pehle din ki low ke neeche open hoti hai.
              • Closing price aam taur par pehle din ki close se ooncha hota hai.
              • Bullish candle bearish se bullish mein taqat ka nashan hai.
            Last edited by ; 27-12-2023, 08:38 AM.

            اب آن لائن

            Working...
            X