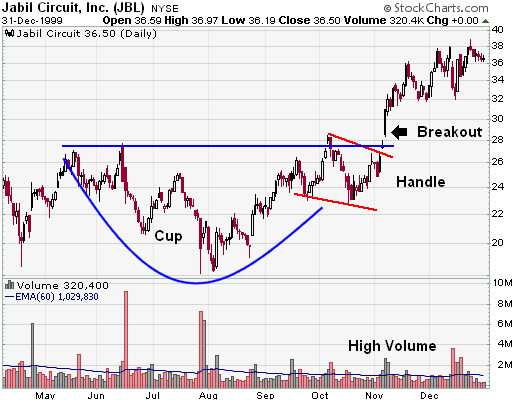
Cup & Handle candle

No announcement yet.
`
X
  • وقت
  • دکھائیں
Clear All
new posts
  • #1 Collapse

    Cup & Handle candle
    Cup & Handle candle kai hai


    Click image for larger version

Name:	download (78).png
Views:	54
Size:	5.3 کلوبائٹ
ID:	12796353

    "Cup and Handle" ek technical analysis pattern hai jo market charts par dikhai deta hai. Ye pattern bullish continuation ko indicate karta hai, yani ke uptrend ke baad aur bhi upward movement ki sambhavna hai. Is pattern ko "Cup and Handle" isliye kaha jata hai kyun ki iska structure ek cup aur ek handle jaisa hota hai. Yahan is pattern ki tafsiliyat hain:

    1. Cup (Cup):
    • Cup, ek rounded shape ka hota hai aur downward trend ke baad ata hai.
    • Cup ki formation mein price mein gradual decrease hota hai, jo ek "U" ya "V" shape create karta hai.
    • Cup ki depth aur shape alag ho sakti hai lekin generally, ye 1-6 months ka time frame cover karta hai.

    2. Handle (Handle):
    • Cup ke baad ek small consolidation period hota hai jo handle kehlata hai.
    • Handle formation mein price mein minor decrease hota hai ya sideways movement hota hai.
    • Handle usually short-term hota hai, aur iska duration aksar kuch weeks tak hota hai.

    3. Breakout (Tutna):
    • Handle ke baad jab price fir se increase karne lagta hai aur cup ki height ko cross karta hai, toh ise breakout kehte hain.
    • Breakout point par traders ko bullish signal milta hai, aur ye indicate karta hai ke buyers ne control pakad liya hai.

    4. Volume (Volume):
    • Cup and Handle pattern mein breakout ke time par volume ka bhi dhyan rakha jata hai. Agar breakout ke samay volume bhi badh raha hai, toh ye breakout ko aur bhi confirm karta hai.

    Trading Cup and Handle Pattern:
    1. Identification:
      • Pehle toh traders ko Cup and Handle pattern ko identify karna zaroori hai. Iske liye price chart par pattern dhundhein.
    2. Confirmation:
      • Breakout ke baad, traders ko confirmation ke liye doosre technical indicators aur price action signals ka istemal karna chahiye.
    3. Stop-Loss Aur Take-Profit Levels Set Karein:
      • Apne trades ke liye stop-loss aur take-profit levels set karein. Stop-loss aapko protect karega agar market against trend move kare, aur take-profit level aapko munafa secure karne mein madad karega.
    4. Risk Management:
      • Hamesha risk management ka khayal rakhein aur apne trading plan ko follow karein. Position size ko sahi taur par manage karein.

    Cup and Handle pattern trading mein istemal hota hai, lekin hamesha yaad rahe ke kisi bhi pattern par bharosa karne se pehle doosre technical factors aur market conditions ka bhi moolya karein.
  • <a href="https://www.instaforex.org/ru/?x=ruforum">InstaForex</a>
  • #2 Collapse

    Cup & Handle candle

    Click image for larger version

Name:	download (2).png
Views:	53
Size:	4.9 کلوبائٹ
ID:	12796375
    Cup & Handle Candlestick Pattern - Ek Technical Analysis Ka Jadoo

    Cup & Handle ek candlestick pattern hai jo financial markets mein istemal hota hai, khaas kar stock market mein. Yeh pattern traders aur investors ke liye ek ahem tajaweez hai takay woh future price movements ko samajh sakein aur munafa kamayen. Is pattern ka naam uske appearance ki wajah se hai, jo ek cup aur handle ki tarah dikhta hai. Is article mein hum Roman Urdu mein Cup & Handle pattern ki tafseelat par ghor karenge.

    Candlestick Patterns Ka Maayne: Candlestick patterns market analysis mein ahem hai kyun ke ye trader ko market ki current aur future situation ka andaza lagane mein madad karte hain. Har ek candlestick ek specific time frame ko represent karta hai aur uski shape aur color se trader ko information milti hai ke market mein kis tarah ka mood hai.

    Cup & Handle Pattern Ki Tafseelat:

    1. Cup (Pyala): Cup, jaise ke iska naam batata hai, ek pyala ki tarah hota hai. Yeh pattern market mein price decline ke baad aata hai aur ek rounded bottom ko represent karta hai. Cup ka formation market ke trend reversal ko indicate karta hai. Cup ka bottom U-shape ya V-shape ho sakta hai, lekin important hai ke bottom rounded ho.

    2. Handle: Cup ke baad aata hai handle, jo ek chhota sa price consolidation ka phase hota hai. Handle ek descending trend line ke saath dikhai deta hai, jiska matlab hai ke market mein thora sa selling pressure hai. Handle ka duration kuch weeks se lekar kuch months tak ka ho sakta hai.

    Cup & Handle Ka Matlab: Cup & Handle pattern ka matlab hota hai ke market mein ek strong bullish trend hone wala hai. Jab cup banta hai, to ye dikhata hai ke downtrend khatam hone wala hai aur phir handle ke baad bullish trend start hone wala hai. Is pattern ko dekhte hue traders ko ye samajh aata hai ke ab stock ki price mein upar ka movement hone wala hai.

    Cup & Handle Trading Strategy: Cup & Handle pattern ko trade karne ke liye kuch steps hote hain:

    1. Cup Recognition: Pehle toh trader ko cup formation ko recognize karna hota hai. Iske liye chart par dhyan se dekhein ke kya price ek rounded bottom banata hai.

    2. Handle Confirmation: Jab cup complete ho jata hai, toh handle ka confirmation dekha jata hai. Handle mein price thoda sa down ja sakta hai, lekin overall trend bullish rehta hai.

    3. Entry Point: Handle ke baad jab price upar ki taraf jaane lagta hai, toh trader ko entry point dhundhna chahiye. Entry point ko confirm karne ke liye volume ki bhi madad li ja sakti hai.

    4. Stop Loss: Har trading strategy mein stop loss ka hona bohot zaroori hai. Agar trade opposite direction mein jaata hai, toh stop loss se nuksan kam kiya ja sakta hai.

    5. Target Setting: Trader ko ye bhi decide karna hota hai ke woh kitna target set karna chahta hai. Target setting ke liye previous resistance levels ko dekha ja sakta hai.

    Cup & Handle Pattern Ki Khatraat: Har trading strategy ki tarah, Cup & Handle pattern ki bhi kuch khatraat hoti hain. Ye pattern hamesha 100% confirm nahi hota aur market ke uncertainties ki wajah se nuksan bhi ho sakta hai. Isliye, har trade ko dhyan se plan karna zaroori hai.

    Final Words: Cup & Handle ek powerful technical analysis tool hai jo traders ko market ke future trends ka pata lagane mein madad karta hai. Lekin, hamesha yaad rakhein ke kisi bhi trading strategy ko istemal karne se pehle market research karna aur risk management ko follow karna bohot zaroori hai.

    Is pattern ki sahi samajh aur istemal se traders apne investment ko better manage kar sakte hain aur profit kamane mein madad hasil kar sakte hain.


    • #3 Collapse

      Cup & Handle candle

      Click image for larger version

Name:	download (2).png
Views:	57
Size:	4.9 کلوبائٹ
ID:	12796380

      Cup & Handle Candlestick Pattern - Ek Technical Analysis Ka Jadoo

      Cup & Handle ek candlestick pattern hai jo financial markets mein istemal hota hai, khaas kar stock market mein. Yeh pattern traders aur investors ke liye ek ahem tajaweez hai takay woh future price movements ko samajh sakein aur munafa kamayen. Is pattern ka naam uske appearance ki wajah se hai, jo ek cup aur handle ki tarah dikhta hai. Is article mein hum Roman Urdu mein Cup & Handle pattern ki tafseelat par ghor karenge.

      Candlestick Patterns Ka Maayne: Candlestick patterns market analysis mein ahem hai kyun ke ye trader ko market ki current aur future situation ka andaza lagane mein madad karte hain. Har ek candlestick ek specific time frame ko represent karta hai aur uski shape aur color se trader ko information milti hai ke market mein kis tarah ka mood hai.

      Cup & Handle Pattern Ki Tafseelat:

      1. Cup (Pyala): Cup, jaise ke iska naam batata hai, ek pyala ki tarah hota hai. Yeh pattern market mein price decline ke baad aata hai aur ek rounded bottom ko represent karta hai. Cup ka formation market ke trend reversal ko indicate karta hai. Cup ka bottom U-shape ya V-shape ho sakta hai, lekin important hai ke bottom rounded ho.

      2. Handle: Cup ke baad aata hai handle, jo ek chhota sa price consolidation ka phase hota hai. Handle ek descending trend line ke saath dikhai deta hai, jiska matlab hai ke market mein thora sa selling pressure hai. Handle ka duration kuch weeks se lekar kuch months tak ka ho sakta hai.

      Cup & Handle Ka Matlab: Cup & Handle pattern ka matlab hota hai ke market mein ek strong bullish trend hone wala hai. Jab cup banta hai, to ye dikhata hai ke downtrend khatam hone wala hai aur phir handle ke baad bullish trend start hone wala hai. Is pattern ko dekhte hue traders ko ye samajh aata hai ke ab stock ki price mein upar ka movement hone wala hai.

      Cup & Handle Trading Strategy: Cup & Handle pattern ko trade karne ke liye kuch steps hote hain:

      1. Cup Recognition: Pehle toh trader ko cup formation ko recognize karna hota hai. Iske liye chart par dhyan se dekhein ke kya price ek rounded bottom banata hai.

      2. Handle Confirmation: Jab cup complete ho jata hai, toh handle ka confirmation dekha jata hai. Handle mein price thoda sa down ja sakta hai, lekin overall trend bullish rehta hai.

      3. Entry Point: Handle ke baad jab price upar ki taraf jaane lagta hai, toh trader ko entry point dhundhna chahiye. Entry point ko confirm karne ke liye volume ki bhi madad li ja sakti hai.

      4. Stop Loss: Har trading strategy mein stop loss ka hona bohot zaroori hai. Agar trade opposite direction mein jaata hai, toh stop loss se nuksan kam kiya ja sakta hai.

      5. Target Setting: Trader ko ye bhi decide karna hota hai ke woh kitna target set karna chahta hai. Target setting ke liye previous resistance levels ko dekha ja sakta hai.

      Cup & Handle Pattern Ki Khatraat: Har trading strategy ki tarah, Cup & Handle pattern ki bhi kuch khatraat hoti hain. Ye pattern hamesha 100% confirm nahi hota aur market ke uncertainties ki wajah se nuksan bhi ho sakta hai. Isliye, har trade ko dhyan se plan karna zaroori hai.

      Final Words: Cup & Handle ek powerful technical analysis tool hai jo traders ko market ke future trends ka pata lagane mein madad karta hai. Lekin, hamesha yaad rakhein ke kisi bhi trading strategy ko istemal karne se pehle market research karna aur risk management ko follow karna bohot zaroori hai.

      Is pattern ki sahi samajh aur istemal se traders apne investment ko better manage kar sakte hain aur profit kamane mein madad hasil kar sakte hain.


      • #4 Collapse

        Cup & Handle Candle in Forex Trading
        Forex trading mein "Cup & Handle" ek mukhtasar chart pattern hai jo price charts par nazar andaaz kiya jata hai.
        Cup Pattern:
        "Cup" pattern market mein ek particular trend ko represent karta hai. Ye pattern typically U-shape ya round-bottom shape ka hota hai.
        1. Formation: Is pattern mein, price initially ek upward trend follow karta hai, phir gradual decline hoti hai aur price neeche jati hai.
        2. Duration: Cup formation create hone mein kuch weeks ya months ka time lag sakta hai.
        3. Volume: Cup formation ke doran volume typically high hoti hai jab price initially upar ja rahi hoti hai aur phir low ho jati hai jab price neeche ja rahi hoti hai.
        Click image for larger version

Name:	cup1.png
Views:	45
Size:	7.0 کلوبائٹ
ID:	12796387
        Handle Pattern:
        "Handle" pattern cup ke baad form hota hai aur ye typically ek smaller, sideways price movement ko represent karta hai.
        1. Formation: Handle, cup ke baad ek small downward price movement ke roop mein dikhta hai, jise ek rectangular ya descending shape mein describe kiya ja sakta hai.
        2. Volume: Handle formation ke doran volume generally low hoti hai compared to the cup formation ke time period mein.
        Signal for Trading:


        Cup & Handle pattern traders ko ek potential trend reversal ka signal deta hai.
        1. Entry Point: Traders typically entry point tab consider karte hain jab price handle ke breakout ke baad upar jaane lagta hai.
        2. Stop-Loss: Stop-loss usually set kiya jata hai neeche handle ke neeche, taki agar pattern galat prove ho toh nuksan kam ho sake.
        3. Target: Target price usually determine kiya jata hai cup ki height se. Ye pattern successfully complete hone ke baad upward movement ka expectation create karta hai.
        Click image for larger version

Name:	cup2.png
Views:	46
Size:	5.6 کلوبائٹ
ID:	12796388

        Caveats:
        1. Confirmation: Always important hai ki traders confirm karein ki ye pattern valid hai ya nahi. False signals ko avoid karne ke liye confirmation ki zarurat hoti hai.
        2. Market Conditions: Har pattern har market condition mein work nahi karta. Volatility, liquidity, aur other factors ko bhi consider karna important hai.
        Conclusion:
        "Cup & Handle" pattern ek popular technical analysis tool hai jo traders use karte hain price movements ko analyze karne ke liye. Ye pattern, trend reversal ko identify karne mein madadgar ho sakta hai, lekin sahi tarah se samajhna aur confirm karna hamesha zaroori hota hai.

        Please note that trading in financial markets involves risks, and it's essential to combine technical analysis with other risk management strategies before making any trading decisions.
        • #5 Collapse

          Cup & Handle Candle Pattern: Ek Misaali Tijarat Pattern


          Tashreef Layein
          Forex market aur stocks mein traders ke liye mukhtalif tijarat patterns istemal hote hain, aur unmein se ek ahem aur mazboot pattern "Cup & Handle" hai. Is post mein hum dekheinge ke Cup & Handle candle pattern kya hai aur iski tijarat mein kya ahmiyat hai.

          Candlestick Patterns Aur Tijarat
          Candlestick patterns, market ke movements aur price changes ko samajhne mein traders ke liye mufeed hote hain. In patterns mein kuch specific formations hain jo market ke mood ko darust karte hain. Cup & Handle bhi ek aisa candlestick pattern hai jise traders market ke future movements ko predict karne ke liye istemal karte hain.

          Cup & Handle Kya Hai?
          Cup & Handle pattern ek bullish continuation pattern hai jo market mein hone wale possible uptrend ko indicate karta hai. Is pattern mein price chart par ek cup-shaped formation hoti hai jise "Cup" kehte hain, aur uske baad ek chhota sa handle banta hai. Yeh pattern market mein hone wale possible continuation ko darust karta hai.

          Cup Ki Tafseelat
          Cup formation ek mukhtasar tafseelaat mein aise hoti hai:

          - Cup ki starting mein ek downtrend hota hai, jise traders ko pata chalta hai ke market mein bearish phase tha.
          - Phir gradual taur par price mein increase hota hai aur cup shape ban jati hai.
          - Cup ki upper side pe curve hoti hai, jise "rim" kehte hain.
          - Cup ki depth aur shape alag ho sakti hai, lekin generally U-shaped hoti hai.

          Handle Ki Tafseelat
          Cup ke baad aane wala handle ek chhota sa downward movement hota hai, jise traders "handle" kehte hain. Is movement ke doran price mein thora sa decline hota hai, lekin overall market bullish direction mein rehta hai.

          Bullish Continuation Signal
          Cup & Handle pattern ek bullish continuation signal deta hai, yaani ke agar market mein uptrend shuru ho chuki hai, to yeh pattern darust karta hai ke wo uptrend continue ho sakta hai.

          Trading Mein Cup & Handle Ka Istemal
          Cup & Handle pattern ka istemal trading decisions banane ke liye hota hai. Jab traders cup formation ko dekhte hain, to unhein lagta hai ke market mein bullish phase shuru ho sakta hai. Handle formation ke baad, jab price mein thora sa decline hota hai, traders ko ye signal milta hai ke ab market fir se upar jane wala hai.

          Volume Ka Tawun
          Cup & Handle pattern ko confirm karne ke liye traders volume ka bhi tawun lete hain. Agar handle formation ke doran volume kam ho, to ye confirm karta hai ke handle ek temporary pullback hai, aur uptrend continue hone wala hai.

          Entry Aur Exit Points
          Traders cup & handle pattern ke signals ke mutabiq apne entry aur exit points tay karte hain. Cup formation ke baad entry point tay karna aur handle ke baad exit point decide karna important hai.

          Dusre Indicators Ka Istemal
          Cup & Handle pattern ko confirm karne ke liye traders dusre technical indicators ka bhi istemal karte hain, jaise ke RSI (Relative Strength Index) aur MACD (Moving Average Convergence Divergence).


          Conclusion
          Cup & Handle candle pattern, traders ke liye ek powerful tool ho sakta hai market ke future movements ko predict karne ke liye. Is pattern ko samajh kar aur sahi taur par interpret karke, traders apne trading strategies ko refine kar sakte hain. Lekin yaad rahe ke har pattern apni limitations aur risks ke saath aata hai, isliye prudent aur informed trading ke liye zaruri hai ke traders apne decisions ko samajhdarana aur cautious taur par lein. Cup & Handle pattern, jo ek bullish continuation signal hai, experienced aur well-prepared traders ke liye aham hosakti hai.

          • #6 Collapse

            "Cup and Handle" ek technical analysis pattern hai jo chart par dikhai deta hai aur market trends ke potential reversals ko indicate kar sakta hai. Yeh pattern do parts se milta hai - pehla "cup" aur dusra "handle." Is pattern ko dekhte waqt traders price action aur volume ka bhi dhyan rakhte hain. Chaliye dekhte hain Cup and Handle pattern ke characteristics aur kaise ise identify kiya ja sakta hai:


            Cup Formation:
            - Pehla step mein, ek rounded bottom ya "U" shape ka cup formation banta hai. Cup ka bottom slow price decline ya consolidation ko represent karta hai.

            Handle Formation:
            - Cup ke baad ek small consolidation ya pullback hota hai, jise handle kehte hain. Handle formation mein price mein minor decline hota hai, lekin overall trend bullish hota hai.

            Volume Analysis:
            - Cup and Handle pattern ko confirm karne ke liye volume analysis bhi important hai. Cup formation mein volume tezi se badhta hai, jabki handle formation mein volume thoda kam hota hai.

            Breakout:
            - Jab handle form ho jata hai, aur price ek resistance level ko cross karta hai jo handle ke upper part mein hota hai, toh traders ko ye signal milta hai ki bullish breakout hone wala hai.

            Target Calculation:
            - Target ko calculate karne ke liye, traders cup ki depth ko measure karte hain aur use handle breakout point se add karte hain. Yeh target price level ko indicate karta hai jahan se next uptrend shuru ho sakta hai.

            Trading Considerations:
            - Cup and Handle pattern ko identify karne ke baad, traders ko breakout ke confirmation ka wait karna chahiye. Handle breakout ke baad hi trade entry ki jati hai.

            - Stop-loss orders ka istemal karna important hai taki in case of a false breakout, losses ko minimize kiya ja sake.

            - Cup and Handle pattern ko aur bhi powerful banane ke liye, ise doosre technical indicators aur chart patterns ke saath confirm kiya ja sakta hai.

            - Har pattern ya indicator ki tarah, Cup and Handle bhi 100% guarantee nahi deta. Isliye, risk management ka istemal karna hamesha zaroori hai.

            Yeh pattern stocks, commodities, aur forex markets mein dekha ja sakta hai. Traders ko chart analysis ke sath-sath overall market conditions ka bhi dhyan rakhna chahiye jab Cup and Handle pattern ko interpret karte hain.
            • #7 Collapse

              –apne 1988 ke classic how to make money in stocks mein, Amrici tiknishn william j. o' neil ne cupp aur handle ( c & h ) patteren ki wazahat ki aur anostris business daily mein shaya honay walay mazameen ki aik series ke zariye takneeki zaroriat ko shaamil kya, jis ki bunyaad unhon ne 1984 mein rakhi thi .
              har Ansar ke liye time frame ki pemaiesh faraham karne ke ilawa, o' neil ne gole kmon ki mukammal wazahat faraham ki jo patteren ko is ki makhsoos chaye ka cupp zahir karti hai .

              jab koi stock is patteren ko banata hai aur pichlle oonchaiyon ko janchta hai, to un sthon par khareeday hue sarmaya karon ke usay baichnay ka imkaan hota hai. yeh farokht ka dabao mumkina tor par qeemat ko chaar din se chaar hafton tak mustahkam karne ka sabab banay ga, jis mein oonchai se pehlay neechay ki taraf rujhan hai. aik cupp aur handle patteren, jo kharidari ke mawaqay ki nishandahi karne ke liye istemaal hota hai, ko taizi ke tasalsul ke patteren ke tor par shumaar kya jata hai .

              cupp aur handle ke namonon ko talaash karte waqt, darj zail ko mad e nazar rakhna chahiye :

              lambai : aam tor par, lambay, ziyada" u" ke size walay bottlon walay cupon se aik mazboot signal tayyar hota hai. shadeed" v" ke size ke neechay walay cupon ko rokain .
              geherai : nazriya mein cupp ziyada gehra nahi hona chahiye. mazeed bar-aan, bohat gehray handls se parhaiz karen, kyunkay cupp patteren ke oopri hissay mein handle ban'nay chahiye .
              hajam : jaisa ke qeematein girty hain aur pyaale ki bunyaad mein ost se neechay rehti hain, hajam kam hona chahiye. jab stock oopar jana shuru karta hai aur pichlle high ko jhanchne ke liye wapas oopar chala jata hai, to hajam barhna chahiye .

              yeh zaroori nahi hai ke pehlay ki muzahmat ke dobarah test ke liye chone ya pichli oonchai ke chand tik ke andar anay ke liye. bahar haal, handle ke oopri hissay ko oonchai se jitna ziyada faasla tay karna hoga, break out itna hi ahem hona chahiye .

              How to Trade the Cup and Handle


              cupp aur handle ki tijarat kayi tareeqon se ki ja sakti hai, lekin sab se aasaan yeh hai ke lambi position mein daakhil honay ke mawaqay talaash karen. neechay di gayi yeh tasweer riwayati cupp aur handle ke intizam ko dukhati hai. handle ki oopri trained line ke bilkul oopar stap khareed order den. sirf is soorat mein jab qeemat patteren ki muzahmat ko toar day aik order par amal kya jana chahiye. tajir ghalat break out mein daakhil honay ke liye jarehana indraaj ka istemaal kar satke hain aur zaroorat se ziyada phislan ka tajurbah kar satke hain .

              mutabadil ke tor par, handle ki oopri trained line ke oopar qareeb ko dekhen. phir, agar qeemat peechay hatt jati hai, to patteren ke break out level se bilkul neechay had ka order day kar amal daraamad karne ki koshish karen. agar qeemat barhti rehti hai aur kam nahi hoti hai, to is baat ka imkaan hai ke aap tijarat se mahroom ho jaien ge .


              patteren ke break out level aur cupp ke nichale hissay ke darmiyan faasla mapa jata hai, aur munafe ke hadaf ka taayun karne ke liye is faaslay ko break out se oopar ki taraf badhaya jata hai. munafe ka hadaf muqarrar kya jata hai, misaal ke tor par, patteren ke handle se 20 point oopar agar cupp ke neechay aur handle ke break out level ke darmiyan faasla 20 points ho. stap loss orders handle ke neechay ya cupp ke neechay rakhay ja satke hain, jo tajir ki khatray ki bhook aur market ke utaar charhao par munhasir hotay hain
              • #8 Collapse

                Cup & Handle candle kai hai

                Click image for larger version

Name:	download (22).jpeg
Views:	37
Size:	8.1 کلوبائٹ
ID:	12804329

                "Cup and Handle" candlestick pattern ek technical analysis pattern hai jo market charts par dekha jaata hai. Yeh pattern bullish continuation pattern hota hai, jo indicate karta hai ke ek uptrend ke baad market mein consolidation hui hai aur ab phir se bullish movement ka expectation hai. Is pattern ka appearance ek cup and handle ki tarah hota hai.

                Cup and Handle Candlestick Pattern Ki Tafseel:
                1. Cup (Upar Ki Taraf Hota Hai):
                  • Cup ki shape ka formation hota hai jise market mein ek extended downtrend ke baad dekha jaata hai. Yeh extended downtrend ko represent karta hai. Cup ki shape round ya U-shaped hoti hai.
                  • Cup ke formation ke baad, price mein gradual increase hoti hai jisse ek rounded bottom create hota hai.
                2. Handle (Niche Ki Taraf Hota Hai):
                  • Handle ek relatively small downtrend hota hai jo cup ke upper level par hota hai. Handle ki shape ek downward-sloping line ki tarah hoti hai.
                  • Handle ke baad, price mein dobara se increase hoti hai, jisse ek upward movement create hota hai.

                Cup and Handle Candlestick Pattern Ki Tafseelat:
                • Cup and Handle pattern ek continuation pattern hai, jo indicate karta hai ke uptrend continue hone ka chance hai.
                • Cup and Handle pattern ke appearance ke baad, traders ko confirmatory signals ki talash karni chahiye, jaise ke volume analysis, moving averages, ya doosre technical indicators ki madad se.

                Trading Strategies:
                • Agar Cup and Handle pattern sahi taur par confirm hota hai, toh traders long positions le sakte hain, yani ke wo khareedte hain.
                • Stop-loss orders ka istemal karna important hai taake nuksanat se bacha ja sake.

                Ehtiyaat (Precautions):
                • Har ek pattern ya indicator ki tarah, Cup and Handle pattern bhi 100% confirmatory nahi hota. Market conditions, economic events, aur doosre factors ko bhi madde nazar rakhna zaroori hai trading ke faislay mein. Isliye, doosre technical indicators ke saath milake is pattern ko confirm karna sensible hota hai.


                • #9 Collapse

                  Cup & Handle candle
                  Click image for larger version

Name:	a04bb11c5afcb86009bfc0877ddb3847.jpg
Views:	36
Size:	73.8 کلوبائٹ
ID:	12804339


                  "Cup & Handle" ek technical analysis pattern hai jo stock market mein istemal hota hai. Yeh pattern price chart par ek cup-shaped formation ko represent karta hai, jise phir ek small handle follow karta hai. Agar yeh pattern sahi taur par dikhe toh yeh indicate karta hai ke ek potential bullish trend hone wala hai.

                  Is pattern ko samajhne ke liye, yeh kuch steps hote hain:

                  Cup Formation:

                  Cup shape ka formation banne ke liye price chart par ek rounded bottom hota hai, jo ki ek U-shape ya saucer jaisa dikhta hai. Is phase mein price initially down hoti hai, phir gradually up ho kar ek curve banata hai.
                  Handle Formation:

                  Cup formation ke baad, ek small price consolidation hoti hai jo handle ki tarah dikhti hai. Is phase mein price mein kuch profit booking ya consolidation hoti hai, lekin overall trend positive rehta hai.
                  Breakout:

                  Cup & Handle pattern complete hone ke baad, ek bullish breakout hota hai. Yani ke price ek upward movement shuru karta hai. Traders is breakout ke baad long positions le sakte hain, kyun ki yeh indicate karta hai ke market mein buying interest badh gayi hai.
                  Yeh pattern market sentiment ko reflect karta hai aur traders ko future price movements ka hint deta hai. Cup & Handle pattern ke istemal se traders ko entry aur exit points determine karne mein madad milti hai.

                  Tafseel se samajhne ke liye, aapko technical analysis aur stock market ke basic concepts par bhi gaur karna hoga.
                  • <a href="https://www.instaforex.org/ru/?x=ruforum">InstaForex</a>
                  • #10 Collapse

                    Cup & handle candle


                    "Cup and Handle" candlestick pattern ek technical analysis pattern hai jo financial markets, jaise ki stocks, commodities, aur currencies, mein use hota hai. Ye pattern typically bullish reversal pattern hota hai, aur traders iska istemal karte hain to anticipate a potential upward trend reversal.


                    Pattern ka naam isliye hai kyunki iski appearance ek cup aur handle jaisi shape ko resemble karta hai.


                    Yahan, main is pattern ki basic structure aur interpretation explain karunga:

                    1. Cup Formation:
                    • Cup formation ek rounded bottom pattern hota hai, jise ek U-shaped ya saucer-shaped cup ke roop mein dekha ja sakta hai.
                    • Cup ki formation market mein previous downtrend ya consolidation phase ke baad hoti hai.
                    • Is phase mein prices initially decline, fir stabilize hote hain, aur phir gradual recovery shuru hoti hai, jisse ek cup banta hai.

                    2. Handle Formation:
                    • Cup ke completion ke baad, ek small downward price movement hota hai jo handle ke roop mein dekha jata hai.
                    • Handle ek relatively small price consolidation area hoti hai, jisme prices thoda giraavat show karte hain.
                    • Handle formation ke dauran trading volumes normally kam hoti hain, indicating a potential period of indecision.

                    3. Breakout:
                    • Jab handle form ho jaata hai, traders ek breakout ka wait karte hain.
                    • Agar prices handle ke breakout ke baad upar ki taraf move karte hain, toh ye ek bullish signal hota hai.
                    • Breakout ke time par trading volume me bhi increase dekha ja sakta hai, confirming the strength of the potential upward move.

                    4. Target:
                    • Cup and handle pattern ka ek target hota hai jo traders anticipate karte hain.
                    • Target calculation hoti hai jisme handle ke depth ko cup ke height se divide kiya jata hai, aur fir ye percentage change upward move ke liye estimate banata hai.

                    Note: Pattern recognition and technical analysis should not be solely relied upon for trading decisions, as markets are dynamic and patterns may not always play out as expected.

                    Traders ko hamesha apne trades ke liye proper risk management ka dhyan rakhna chahiye, aur dusre technical indicators aur analysis tools ka bhi istemal karna important hai.

                    اب آن لائن

                    Working...
                    X