Bullish Kicker Pattern ek bullish reversal candlestick pattern hai jo market trends ke changing points ko identify karne mein madad karta hai. Yeh pattern typically downtrend ya consolidation ke baad dekha jata hai aur indicate karta hai ke market ke sentiment mein sudden change hua hai.
Bullish Kicker Pattern Ka Hona:
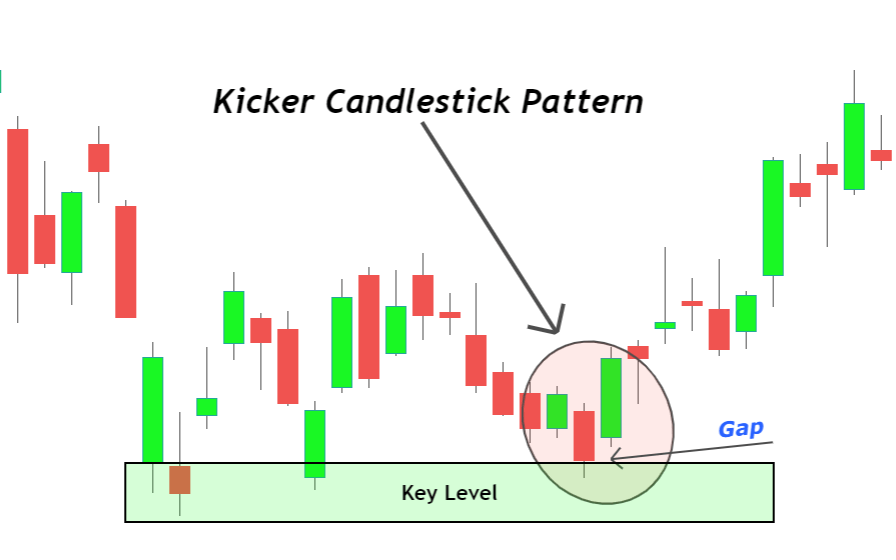
- First Candle: Pehli candle ek downtrend ke dauran hoti hai aur bearish hoti hai, indicating selling pressure.
- Second Candle: Dusri candle, pehli candle ke neeche open hoti hai, suggesting a gap down opening compared to the previous candle. Yeh candle immediately bullish hoti hai aur strong buying activity dikhati hai.
- Volume: Volume ka increase bhi dekha jata hai, indicating strong participation and confirmation of the bullish sentiment.
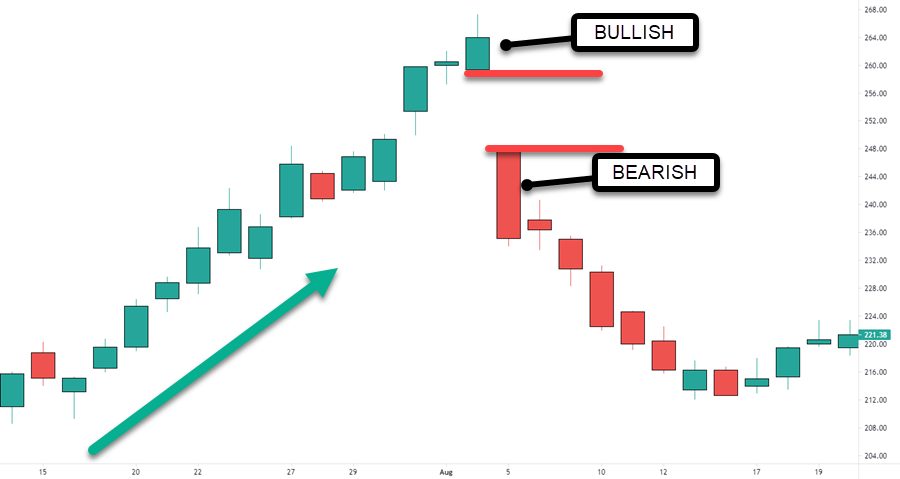
- Reversal Signal: Bullish Kicker Pattern ek strong bullish reversal signal provide karta hai jab market downtrend ya consolidation ke baad hai.
- Instant Shift in Sentiment: Is pattern mein dekha gaya sudden shift in sentiment, particularly jab pehli bearish candle ke baad ek immediate bullish candle form hoti hai.
- Strong Buying Pressure: Kicker patterns mein dikhai gayi strong buying pressure traders ke liye positive indication hoti hai, indicating a potential uptrend.
- Confirmation with Volume: Bullish Kicker Pattern ko confirm karne ke liye volume ka analysis important hota hai. Agar volume bhi increase hota hai, toh yeh bullish reversal signal ko strengthen karta hai.
- Entry aur Stop-Loss: Traders entry point ke liye second candle ke high ke break ke wait karte hain, aur stop-loss ko first candle ke low ke neeche place karte hain.
- Target Price: Pattern ki height ka measurement karke, target price set kiya ja sakta hai.
Bullish Kicker Pattern market trends ko anticipate karne mein helpful hota hai, lekin isko confirm karne ke liye additional technical analysis aur indicators ka istemal zaroori hai. Is pattern ke saath risk management ko combine karke, traders strong entry aur exit points identify kar sakte hain.
تبصرہ
Расширенный режим Обычный режим