Definition
Assalamualaikum aj is thread me apko me Pakistan Forex Trading ke ak bhot he important topic red candlestick pattern ke bare me btao ga
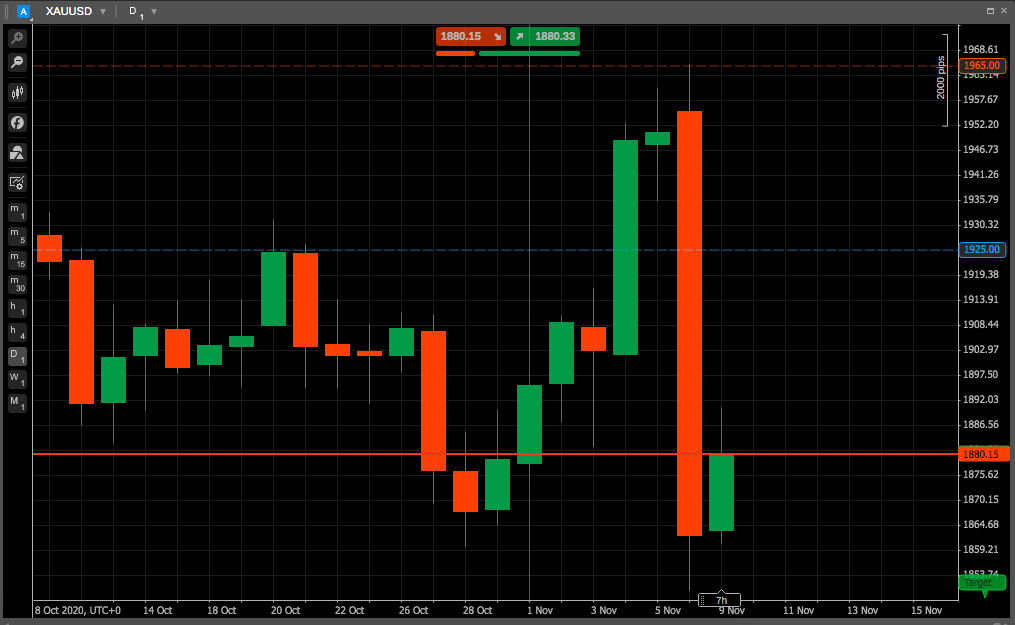
Red candlestick pattern ek technical analysis ka tool hai jo stock market ya kisi bhi financial market mein price movements ko represent card hai. Ye pattern Japanese rice traders do not develop kiya tha aur aaj bhi widely used by hota hai traders and investors ke buku.
Jab hum candlestick chart dekhte hain, to har candlestick ek certain time period ki price information ko show card hai jaise ke day, hour, ya minutes. Har candle mein four points hot hain: open, high, low, aur close price.
Explanation
Red candlestick ki baat karein you normally bearish signal kids hai. Bearish matlab ke market mein downtrend ya price drop ki expectations hai. Red candlestick ka matlab hai ke opening price closing price se kam thi during this time period. Isk body (jo rectangle hota hai) red ya black color ka hota hai in conventional charts.
Example
Let's take an example, agar koi stock din ki shuruwat mai 100 rupees par open hua aur din ke end tak gir kar 90 rupees par band hua, toh ye ek red banayega candlestick. Iska waziha matlab hai ke sellers ne control rakha throughout trading period aur buyers zyada strong they.
Red candlestick patterns mein kuch common types hote hain jaise ke:
1. **Bearish Engulfing:** Ye pattern tab banega jab ek chhota green/red candlestick ke baad ek bada red candlestick ho jo pehle wale candlestick ko poori tarah se cover kar le. Ye signal deta hai to bears no market control overtake kiya hai.
2. **Evening:** Three candlestick pattern hai jisme middle candlestick small body ki hoti hai aur dono sides par larger candles hoti hain. Agar on the right side wali candle red ho to ye bearish turn indicate karta hai.
3. **Shooting Star:** Those typically short term top ke near hota hai. Isme ek long upper shadow (wick) hoti hai aur ek small body jo ke red hoti hai, indicating to buyers initially price ko up leke gaye lekin seller no price ko pull sharply down kar diya.
4. **Three black crows:** It is a bearish reversal pattern hai jisme lagatar teenage red candle hoti hain, jo sab ke sab previous candle se neeche close hot hain.
Traders ye patterns ko dekh to future price direction ka andaza lagate hain aur apne trading decisions lete hain. Lekin yaad rakhen ke koi bhi technical analysis tool ya pattern 100% sahi predictions nahi deta, aur hamesha risk management ke sath trading karna chahiye.
Assalamualaikum aj is thread me apko me Pakistan Forex Trading ke ak bhot he important topic red candlestick pattern ke bare me btao ga
Red candlestick pattern ek technical analysis ka tool hai jo stock market ya kisi bhi financial market mein price movements ko represent card hai. Ye pattern Japanese rice traders do not develop kiya tha aur aaj bhi widely used by hota hai traders and investors ke buku.
Jab hum candlestick chart dekhte hain, to har candlestick ek certain time period ki price information ko show card hai jaise ke day, hour, ya minutes. Har candle mein four points hot hain: open, high, low, aur close price.
Explanation
Red candlestick ki baat karein you normally bearish signal kids hai. Bearish matlab ke market mein downtrend ya price drop ki expectations hai. Red candlestick ka matlab hai ke opening price closing price se kam thi during this time period. Isk body (jo rectangle hota hai) red ya black color ka hota hai in conventional charts.
Example
Let's take an example, agar koi stock din ki shuruwat mai 100 rupees par open hua aur din ke end tak gir kar 90 rupees par band hua, toh ye ek red banayega candlestick. Iska waziha matlab hai ke sellers ne control rakha throughout trading period aur buyers zyada strong they.
Red candlestick patterns mein kuch common types hote hain jaise ke:
1. **Bearish Engulfing:** Ye pattern tab banega jab ek chhota green/red candlestick ke baad ek bada red candlestick ho jo pehle wale candlestick ko poori tarah se cover kar le. Ye signal deta hai to bears no market control overtake kiya hai.
2. **Evening:** Three candlestick pattern hai jisme middle candlestick small body ki hoti hai aur dono sides par larger candles hoti hain. Agar on the right side wali candle red ho to ye bearish turn indicate karta hai.
3. **Shooting Star:** Those typically short term top ke near hota hai. Isme ek long upper shadow (wick) hoti hai aur ek small body jo ke red hoti hai, indicating to buyers initially price ko up leke gaye lekin seller no price ko pull sharply down kar diya.
4. **Three black crows:** It is a bearish reversal pattern hai jisme lagatar teenage red candle hoti hain, jo sab ke sab previous candle se neeche close hot hain.
Traders ye patterns ko dekh to future price direction ka andaza lagate hain aur apne trading decisions lete hain. Lekin yaad rakhen ke koi bhi technical analysis tool ya pattern 100% sahi predictions nahi deta, aur hamesha risk management ke sath trading karna chahiye.
تبصرہ
Расширенный режим Обычный режим