What is hanging men candlestick pattern??
X
  • وقت
  • دکھائیں
Clear All
new posts
  • #1 Collapse

    What is hanging men candlestick pattern??
    What is hanging men candlestick

    Aslam u alaikum dear friend

    definition


    Hanging man" candlestick pattern ek technical analysis ka tajziya hai jo ke stocks ya anya securities ki keemat mein mukhtalif hawale se badalne ki sambhavanaon ko pehchanna mein madad karta hai. Ye pattern aksar ek uptrend ke ant mein ban sakta hai aur ye darust karne ki sambhavana ho sakti hai ke trend reverse ho aur price neeche ja sakti hai.


    Candle types

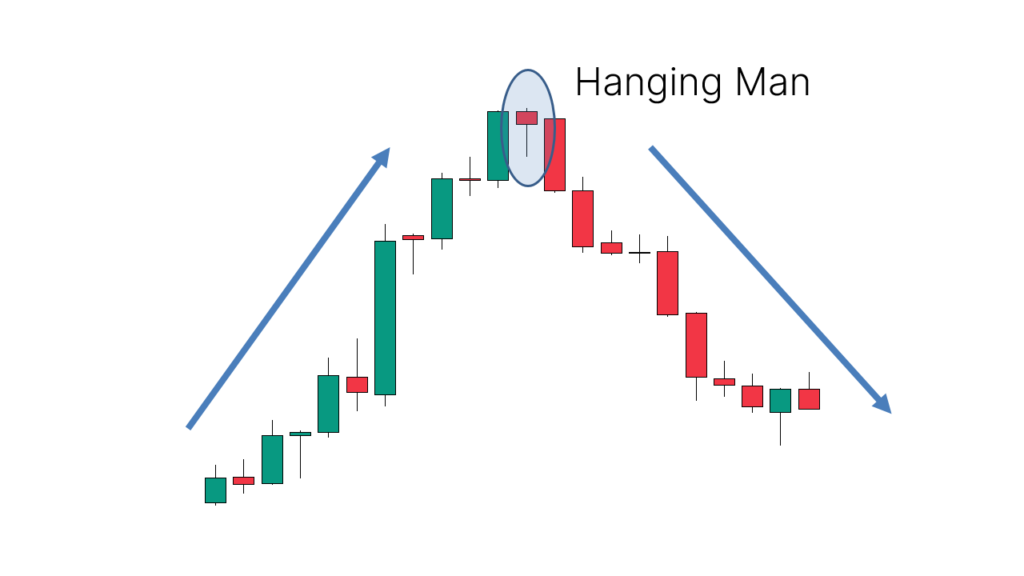
    Is pattern mein ek single candle hoti hai jo ke chhota jism, lambi neeche ki chhaya, aur kam se kam uppar ki chhaya ke saath aata hai. Chhota jism ishara karta hai ke khula aur band mein kam farq hai, jabki lambi neeche ki chhaya batati hai ke sellers ne price ko session ke doran kafi neeche daba diya, lekin ant mein buyers ne price ko upar uth

    Trading The hanging men patterns

    "Hanging man" candlestick pattern ek technical analysis mein istemal hone wala pattern hai jo ke securities ki keemat mein mukhtalif hawale se badalne ki sambhavanaon ko pehchanna mein madad karta hai. Yeh pattern aksar ek uptrend ke ant mein ban sakta hai aur iska matlub hai ke price mein neeche jaane ki sambhavana hai.

    Is pattern mein ek single candle hoti hai jiska chhota sa jism hota hai, lambi neeche ki chhaya hoti hai, aur kam se kam uppar ki chhaya hoti hai. Chhota sa jism ishara karta hai ke khula aur band mein kam farq hai, jabki lambi neeche ki chhaya batati hai ke sellers ne price ko session ke doran kafi neeche daba diya, lekin ant mein buyers ne price ko upar uthaya.


    Psychology of hanging men

    psychology mei, yeh dikhaata hai ke market mei sellers ne control haasil kiya aur price ko neeche le gaye, lekin buyers ne session ke ant mein control ko wapas pakad liya. Yeh pattern uptrend ke khatmay ko indicate karta hai aur bearish reversal ki sambhavana bataata hai. Traders is signal ko dekh kar, neeche jaane ki possibility par dhyaan dete hain. Agar price neeche jaati hai, toh yeh bearish confirmation ho sakti hai. Lekin, market conditions ko dhyan mein rakhna hamesha zaroori hai, kyun ki patterns 100% guarantee nahin de


  • <a href="https://www.instaforex.org/ru/?x=ruforum">InstaForex</a>
  • #2 Collapse

    -:HANGING MAN CANDLESTICK PATTERN:-

    "Hanging Man" ek candlestick pattern hai jo technical analysis mein istemal hota hai aur yeh ek bullish trend ki ulte taraf palatne ki sambhavna ko darust karna mein madad karta hai. Yeh ek hi candlestick pattern hai jo uptrend ke ant mein banta hai aur isse lagta hai ki buyers apne control kho rahe hain aur bears majbooti haasil kar rahe hain.
    Agar Hanging Man candlestick pattern uptrend ke baad aata hai, to yeh indicate karta hai ki bulls control kho rahe hain aur bears daakhil ho sakte hain. Is situation mein traders ko aur confirmatory signals ka bhi intezar karna chahiye, jese ke doji patterns, trend lines, ya dusre technical indicators ke signals.


    -:HANGING MAN CANDLESTICK PATTERN KI PEHCHAAN:-

    Hanging Man candlestick pattern ki kuch khaas pehchanen hain:
    1. Jism ka Size (Body Size): Hanging Man candle ka jism chhota hota hai, aur yeh trading range ke upper part mein hota hai.
    2. Lower Shadow (Tail): Iski sabse khaas pehchan yeh hoti hai ki iski lambi lower shadow hoti hai, jo kam se kam jism ki lambai ka do guna hota hai. Yeh indicate karta hai ki buyers ne shuruwat mein to control kiya, lekin phir market ne neeche ki taraf jaane mein takleef mehsoos ki.
    3. Upper Shadow: Hanging Man candle ka upper shadow chhota hota hai ya phir bilkul bhi nahi hota.
    4. Color (Rang): Jism ka rang mahatva purna nahi hota, lekin general taur par ise white (safed) ya black (kala) color mein dekha ja sakta hai.
    5. Trend Ke Context Mein Dekhein: Hanging Man hamesha uptrend ke baad aata hai. Iski pehchan karte waqt, trend ke context ko dhyan mein rakhna mahatva purna hai.
    6. Volume Ka Analysis: Hanging Man ke pattern ke sath-sath, volume ka bhi analysis karna important hai. Agar Hanging Man ke neeche high volume hai, to yeh us signal ko aur bhi strong bana deta hai.
    Last edited by ; 26-12-2023, 05:00 PM.
    • #3 Collapse

      Hanging man candlestick pattern ek widely recognized aur used technical analysis tool hai jo traders aur investors ko market ke potential reversal points ko identify karne mein madad karta hai. Ye pattern specially jab kisi security ka price upar ki taraf move kar raha ho tab dikhayi deta hai aur indicate karta hai ke price trend ab reverse ho sakta hai. Hanging man candlestick pattern ek bearish reversal pattern hai jo uptrend ke end mein appear hota hai. Iska naam hanging man isliye rakha gaya hai kyunki ye ek hanging man jaisa dikhayi deta hai. Is pattern ka main feature ye hai ke iska lower shadow kaafi lamba hota hai, jabke upper shadow choti hoti hai ya bilkul nahi hoti aur body bhi relatively choti hoti hai.


      Hanging Man Pattern ki Characteristics
      1. Long Lower Shadow: Lower shadow yani tail kaafi lambi hoti hai, jo indicate karti hai ke trading period ke dauran sellers ne prices ko niche push kiya tha.
      2. Small Real Body: Body choti hoti hai jo open aur close prices ke beech ke difference ko show karti hai. Agar close price open price ke niche ho to body black ya red hoti hai aur agar close price open price ke upar ho to body white ya green hoti hai.
      3. Little or No Upper Shadow: Upper shadow choti hoti hai ya bilkul nahi hoti, jo yeh suggest karta hai ke buyers ne prices ko bahut zyada upar push nahi kiya.
      Formation
      Hanging man candlestick pattern tab form hota hai jab ek security ki trading session ke dauran price significantly niche girti hai magar end of the session tak wapas recover ho jati hai. Is pattern ka formation yeh indicate karta hai ke market mein selling pressure shuru ho gaya hai aur uptrend khatam hone wala hai.

      Steps for Formation
      1. Uptrend: Pattern tabhi valid hota hai jab market ya security uptrend mein ho.
      2. Gap Up Open: Trading session ki shuruaat mein price gap up open hoti hai, yani previous close se zyada.
      3. Sell-Off: Session ke dauran sellers dominate karte hain aur price ko niche push karte hain, jo long lower shadow banata hai.
      4. Recovery: Closing ke time tak buyers kuch recovery karte hain, magar price fir bhi opening price ke qareeb rehti hai.
      Significance
      Hanging man pattern ka significance is baat par depend karta hai ke iske baad kya hota hai. Is pattern ko confirm karne ke liye, traders ko agle ek do candles ka wait karna chahiye. Agar agle candle mein price niche girti hai to yeh confirm hota hai ke hanging man pattern valid hai aur market trend reverse hone wala hai.

      Key Points of Significance
      1. Bearish Reversal Signal: Hanging man ek bearish reversal signal hai jo indicate karta hai ke uptrend ab khatam hone wala hai aur downtrend shuru hone wala hai.
      2. Confirmation Required: Is pattern ko confirm karne ke liye agle candle ki closing price ko dekhna zaroori hai. Agar closing price niche hoti hai to reversal confirm hota hai.
      3. Volume Analysis: Volume ka analysis bhi important hai. Agar hanging man pattern ke dauran volume zyada hai to yeh zyada strong signal hota hai.
      Trading Strategies Using Hanging Man Pattern
      Hanging man candlestick pattern ko use karte hue trading strategies banane ke kai tareeqe hain. Yeh strategies traders ko better decision making mein madad kar sakti hain aur unke profits ko maximize kar sakti hain.

      Confirmation Candle Strategy
      Yeh strategy sabse common aur safe strategy hai jisme traders hanging man pattern ke baad confirmation candle ka wait karte hain. Confirmation candle wo hoti hai jisme closing price niche hoti hai.

      Steps
      • Hanging man pattern ko identify karo.
      • Confirmation candle ka wait karo. Agar agla candle bearish hai aur niche close hota hai to signal confirm hota hai.
      • Is confirmation ke baad sell position open karo.

      Stop Loss Placement
      Hanging man pattern ko use karte hue stop loss placement bhi zaroori hai taake risk ko manage kiya ja sake. Stop loss usually hanging man pattern ki high price ke thoda upar lagayi jati hai.

      Steps
      • Hanging man pattern identify karo aur confirmation candle ka wait karo.
      • Sell position open karo aur stop loss hanging man pattern ki high price ke upar lagao.
      • Target profit levels ko identify karo aur accordingly position ko manage karo.

      Combining with Other Indicators
      Hanging man pattern ko doosre technical indicators ke sath combine karke zyada accurate trading decisions liye ja sakte hain. Isme RSI, MACD, aur moving averages shamil hain.

      Steps
      • Hanging man pattern identify karo.
      • Doosre indicators ko check karo jaise RSI (Relative Strength Index) agar overbought zone mein hai to reversal ka chance zyada hota hai.
      • Confirmation ke baad sell position open karo aur indicators ki madad se stop loss aur target profit levels set karo.
      Advantages of Using Hanging Man Pattern
      Hanging man candlestick pattern ke use karne ke kai advantages hain jo traders ko market movements ko better understand karne mein madad karte hain.

      1. Early Reversal Signals
      Hanging man pattern traders ko early warning sign provide karta hai ke uptrend ab khatam hone wala hai aur downtrend shuru ho sakta hai. Is se traders timely exit ya enter kar sakte hain.

      2. Simple to Identify
      Yeh pattern identify karna relatively simple hai. Bas lower shadow lambi honi chahiye aur body choti. Is simplicity ke wajah se beginners bhi is pattern ko easily identify kar sakte hain.

      3. Versatile Use
      Hanging man pattern ko kisi bhi time frame par use kiya ja sakta hai. Chahe daily charts hoon ya intraday charts, yeh pattern har tarah ke traders ke liye useful hai.

      Disadvantages and Limitations
      Jahan hanging man pattern ke kai advantages hain, wahan kuch limitations bhi hain jo traders ko dhyaan mein rakhni chahiye.

      1. False Signals
      Hanging man pattern false signals bhi de sakta hai, specially jab confirmation candle na ho. Is wajah se is pattern ko doosre indicators ke sath combine karna zaroori hai.

      2. Requires Context
      Is pattern ko sahi context mein dekhna zaroori hai. Yeh sirf tabhi valid hai jab uptrend ke end mein ho. Agar sideways market ya downtrend mein ho to yeh pattern misleading ho sakta hai.

      3. Not Always Reliable in Isolation
      Hanging man pattern ko akela rely karna risky ho sakta hai. Doosre technical indicators aur market conditions ko bhi consider karna chahiye.

      Practical Example
      Ek practical example se hanging man pattern ko samajhna aur bhi aasaan ho jata hai. Chaliye ek stock XYZ ka example lete hain jo uptrend mein hai.

      Step-by-Step Analysis
      1. Identify the Uptrend: XYZ stock pichle kuch weeks se consistently upar ja raha hai aur uptrend mein hai.
      2. Spot the Hanging Man Pattern: Ek din XYZ stock ek hanging man candlestick pattern form karta hai jisme lower shadow kaafi lambi hai aur body choti hai.
      3. Wait for Confirmation Candle: Agle din XYZ stock ek bearish candle form karta hai jisme closing price previous day ke close se niche hoti hai. Yeh confirmation hai ke reversal ho sakta hai.
      4. Execute the Trade: Confirmation milne ke baad trader XYZ stock ko sell karta hai aur stop loss previous high ke thoda upar lagata hai.
      5. Monitor and Exit: Trader apne target profit levels set karta hai aur position ko accordingly manage karta hai.
      Hanging man candlestick pattern ek powerful tool hai jo traders ko market ke potential reversal points identify karne mein madad karta hai. Is pattern ko effectively use karne ke liye context, confirmation, aur doosre technical indicators ko consider karna zaroori hai. Agar sahi tareeke se use kiya jaye to yeh pattern traders ke profits ko maximize kar sakta hai aur losses ko minimize kar sakta hai. Technical analysis ki duniya mein hanging man pattern ek valuable asset hai jo beginners aur experienced traders dono ke liye useful hai.
      Believe in yourself and your abilities. When you fight for your dreams, you can achieve anything.
      • #4 Collapse

        Hanging Man Candlestick Pattern: Ek Jaiza


        Muqaddama

        Hanging Man candlestick pattern ek bearish reversal pattern hai jo candlestick charts par appear hota hai. Ye pattern market ke uptrend ke baad often form hota hai aur potential trend reversal ko indicate karta hai. Is article mein hum Hanging Man candlestick pattern ko detail mein samjhenge, uski characteristics aur traders ke liye significance ko explore karenge.

        Hanging Man Candlestick Pattern Kya Hai?

        Hanging Man candlestick pattern ek single candle pattern hai jo typically bullish trend ke baad form hota hai. Is pattern mein:
        • Candlestick ki body small hoti hai, ideally iski length short hoti hai.
        • Candlestick ki upper shadow (ya wick) lambi hoti hai aur lower shadow nahi hoti ya bohot choti hoti hai.
        • Candlestick ki closing price near ya below opening price hoti hai.

        Hanging Man Pattern ki Characteristics
        1. Bearish Reversal Signal: Hanging Man pattern bearish reversal signal provide karta hai, yani bullish trend ke baad jab ye pattern form hota hai, toh ye indicate karta hai ke market ka sentiment change ho sakta hai aur price downward move kar sakta hai.
        2. Confirmation Required: Hanging Man pattern ko confirm karne ke liye traders dusre indicators ya patterns ki madad lete hain jaise ke volume analysis aur dusre candlestick patterns.
        3. Critical Price Levels: Hanging Man pattern ke formation ke baad traders critical support levels aur previous lows ko closely monitor karte hain. Agar price in levels ko break karta hai, toh ye bearish trend ka confirmation hota hai.

        Hanging Man Pattern Ka Istemaal
        1. Pattern Identification: Sabse pehla step hai Hanging Man pattern ko identify karna. Iske liye traders candlestick charts par specific characteristics ko dekhte hain jaise ke small body, long upper shadow, aur closing price near low.
        2. Entry aur Exit Points: Hanging Man pattern ke formation ke baad traders entry aur exit points decide karte hain. Agar pattern confirm hota hai, toh sell signal generate hota hai aur traders short positions enter karte hain.
        3. Risk Management: Har trading strategy mein risk management crucial hota hai. Hanging Man pattern ke istemaal mein stop loss aur take profit levels ko define karke traders apne risk ko effectively manage karte hain.

        Hanging Man Pattern Ki Limitations
        1. False Signals: Kabhi kabhi Hanging Man pattern false signals generate kar sakta hai, especially choppy ya range-bound markets mein. Isliye confirmation ke liye additional technical indicators ki zaroorat hoti hai.
        2. Time Frame Dependency: Hanging Man pattern ki accuracy time frame par depend karti hai. Different time frames par iski interpretation alag alag ho sakti hai, isliye multiple time frame analysis recommend ki jati hai.

        Conclusion

        Hanging Man candlestick pattern bearish reversal signal provide karta hai jo traders ke liye market trends ko identify karne aur profitable trading decisions lene mein madadgar sabit ho sakta hai. Is pattern ko sahi tarah se samajh kar aur confirmatory indicators ke saath use karke traders apne trading strategies ko improve kar sakte hain. Har trader ke liye zaroori hai ke wo candlestick patterns ko recognize karne mein maharat hasil kare taki wo market movement ko better anticipate kar sake aur apne trading results ko enhance kar sake.
        • #5 Collapse

          Hanging Man Candlestick Pattern Kya Hai?

          Hanging Man Candlestick Pattern ek bearish reversal pattern hai jo uptrend mein banta hai. Yah pattern traders ko yah batane ke liye ek sanket deta hai ki kiyat trend reverse hone wala hai aur bear market shuru hone wala hai.


          Hanging Man Candlestick Pattern ki visheshtaen hain:
          • Chhota real body: Hanging Man candlestick pattern mein ek chhota real body hota hai, jo yah batata hai ki buyers aur sellers ke beech mein koi majbut consensus nahi hai.
          • Lambi lower shadow: Hanging Man candlestick pattern mein ek lambi lower shadow hoti hai, jo yah batata hai ki sellers ne trend ko reverse karne ki koshish ki hai.
          • Koi ya kam upper shadow: Hanging Man candlestick pattern mein koi ya kam upper shadow hoti hai, jo yah batata hai ki buyers ne trend ko sustain karne ki koshish nahi ki.


          Hanging Man Candlestick Pattern ka matlab kya hai:

          Hanging Man Candlestick Pattern ka matlab hai ki trend reverse hone wala hai aur bear market shuru hone wala hai. Halanki, yah pattern sirf ek sanket hai aur iska matlab yah nahi hai ki trend 100% reverse hoga.


          Hanging Man Candlestick Pattern ka istemal kaise karein:

          Hanging Man Candlestick Pattern ka istemal trend reversal ki trading ke liye kiya ja sakta hai. Is pattern ka istemal karne ke kuchh tarike hain:

          Click image for larger version

Name:	images (1).jpeg
Views:	11
Size:	48.9 کلوبائٹ
ID:	13041674
          • Hanging Man candlestick pattern ke baad sell order dain. Yah sabse straightforward tarika hai is pattern ka istemal karne ka.
          • Hanging Man candlestick pattern ke baad stop-loss order dain. Yah aapko nuksan ko limited karne mein madad karega agar trend reverse nahi hota hai.
          • Hanging Man candlestick pattern ko confirmation ke liye aur indicators ka istemal karein. Yah aapko adhik vishwas ke saath trade karne mein madad karega.


          Hanging Man Candlestick Pattern ki kuchh limitations hain:
          • Yah ek false signal ho sakta hai. Jaise ki maine upar kaha hai, Hanging Man Candlestick Pattern sirf ek sanket hai aur iska matlab yah nahi hai ki trend 100% reverse hoga.
          • Yah dusre indicators ke saath achchhi tarah se kaam karta hai. Hanging Man Candlestick Pattern ko adhik vishwas ke saath trade karne ke liye aur indicators ka istemal karna chahiye.

          Mujhe ummed ha ka ya malomat app ke liey helpfull Rahi Hogi.
          • #6 Collapse

            HANGING MAN CANDLESTICK PATTERN
            Explain Hanging men candlestick pattern
            Assalamu alaikum dear forex friends I hope some khyriyat se honge dear jab hum for extreting Business main kam karty Hain to Ham yah dikhte hain ki market main moment Hoti hy to hamen vah candlesticks pattern ki surat main najar a Rahi hoti hy on patterns ko Ham jitne acche tariky se samajhte Hain itne acche tariky se Ham market ko analysis karne main kamyab hote hain or ISI Tarah hamen acchi or successful entry lene ka mauka milta hy aj Ham jis pattern ky bare main bat karenge vah hy "Hanging Man Candlestick Pattern" or aj main ISI se related apky sath kuchh important information share karungi jo apko trading ko profit table banane main bahut zyada madad degi.

            Important information about Hanging man candlestick pattern
            Dear traders hanging man candlestick pattern Ik single candle pattern hone ki wajah se technical analysis main bahut zyada istemal hone wala pattern hy yah Ik stand reversal pattern hy jisko Ham na sirf forest trading main istemal karty hain balki index band or currency trading main bhi isko istemal Kiya jata hy hanging man characteristic pattern ko price ky top per banne wala pattern hy or jab bhi yah candle price ky top per banti hy to Yahan yah bat mumkin Hoti hy ki Barish trend reversal ka start hone wala hy. Hanging man candlestick pattern dusre indicators ky sath price ky top per resistance reversal ky liye zyada mashhur hy jiski opposite direction main bottom price main inverted hammer candlestick banti hy or hanging man canda stick ky sath price ky top per Ik shooting star candle be same usi Tarah banti hy jo ki train reversal ka sabab banti hy or butter shape main hanging man candle se different hoti hy.

            Identification of hanging man candlestick pattern:
            Dear forex members, hanging man candlestick pattern market ky high position per banne wala pattern hy kyunki yah candle single candle betrayed reversal pattern ka kam karti hy or is candle ki closing point opening point se zyada hone chahiye but ye zaroori nahi hy ki aisa Hi ho kyunki is candle ka ik lamba Shadow hota hy jo ki size main takriban candle ki body ky double ya usse bhi zyada hota hy or isky andar ki real body ky lower side per honi chahie jis Tarah ky hammer candle ka hota hy pahle hi candle bullish Hoti honi chahie jabki hanging men candle ky bad next candle Badi honi chahie bearish candle ki closing position pichhali police candle ky down honi chahie hanging men candle ki upper side per Koi Shadow nahi hota balki Ik small si hoti hy jo ki candle ki shape ky change hone ki problem na ho candle ki real body ka color Koi bhi ho Sakta hy Kisi Ik color ka hona mast nahi hy hanging men candistic pattern small real body main lower side per long Shadow wali candle hy jismain price police rent ko reject karne ky bad yah indicate Karti hy caky candle ki shape d donon Tarah se ho sakti hy jab caky candle kya Shadow real body ky size se double ho sakta hy ya FIR usse bhi zyada hanging man Wednesday pattern hy jo different financial market ky sath bahut acchi tariky se kam karta hy yah candlestick pattern sabse famous pattern main shumar hota hy.

            Trading strategy of Hanging man candlestick pattern:
            Mere pyare aziz dosto, hanging man candlestick pattern bullish trend reversal pattern hy or yah donon shapes main bhi reversal ki kasuriyad shamil hoti hain kyunki price ky top per yah pattern trend main ya candle price ky liye register roll play karta hy yah single candle pattern main shamil hy jitna zyada lamba time frame hota hy iski reliability usi ky sath se acchi Hoti hy candle per trading se pahle long term ki time frame ky sath Ik train confirmation candle ka hona bahut jaruri hy jo ki real body main bearish candle ky hone ky sath hanging man candle ka bottom side per closing honi chahie Jo ky confirmation candle hoti hy or Baki Jo value overboards on main ho to top lost candle ky sabse top ya high price se tu PIP about stop loss ko set Kiya ja sakta hy.


            Click image for larger version

Name:	hangin.png
Views:	9
Size:	4.3 کلوبائٹ
ID:	13041717
            • #7 Collapse

              **Hanging Man Candlestick Pattern: Ek Mukhtasar Guide**
              Forex aur stock market mein technical analysis ka istemal karke traders price movements aur potential reversals ko predict karte hain. Ek aham candlestick pattern jo is analysis mein istemal hota hai, wo hai "Hanging Man."

              **Hanging Man Kya Hai?**

              Hanging Man ek single candlestick pattern hai jo typically uptrend ke baad develop hota hai aur bearish reversal ki indication deta hai. Is pattern ko identify karne ke liye kuch key characteristics hote hain:

              - **Long Lower Shadow:** Candlestick ka lower shadow long hota hai jo price ke low tak extend hota hai.

              - **Small Real Body:** Candle ka real body chhota hota hai aur ideally upper range mein close hota hai.

              - **No or Small Upper Shadow:** Candlestick ka upper shadow ideally nahin hota ya bahut chhota hota hai.

              **Hanging Man Ka Meaning**

              Hanging Man candlestick pattern ka formation bullish trend ke reversal ya price exhaustion ko indicate karta hai. Jab market high pe open karta hai, phir upper side pe strong move karta hai lekin day ke end mein price significantly lower close karta hai, to isko Hanging Man kaha jata hai.

              **Hanging Man Ka Istemal**

              Hanging Man pattern ko identify karne ke baad traders typically sell ya short positions consider karte hain, especially jab iske confirmation ke liye next candle bearish close karta hai. Is pattern ke successful istemal ke liye traders ko confirmatory signals aur risk management ka bhi dhyan rakhna hota hai.

              **Trading Strategy**

              Hanging Man pattern ko successfully trade karne ke liye traders kuch points par focus karte hain:

              - **Confirmation:** Hanging Man pattern ke baad next candle ka behavior observe karte hain, jaise ki bearish close.

              - **Volume Analysis:** Pattern ke formation mein volume ki analysis bhi important hoti hai, jaise ki pattern ke formation aur confirmatory candles ke time par volume ki increase indicate kar sakti hai selling pressure ko.

              - **Stop Loss Placement:** Har trade mein appropriate stop loss placement zaroori hoti hai, taaki unexpected market movements se protect kiya ja sake.

              **Conclusion**

              Hanging Man candlestick pattern forex, stocks, commodities aur other financial instruments ke trading mein ek valuable tool hai. Iska istemal karke traders market trends ko samajhte hain aur trading decisions lene mein help milti hai. Haqeeqat mein, is pattern ke saath practice aur experience ke saath traders apne analysis ko refine kar sakte hain aur market volatility aur uncertainty ko navigate kar sakte hain.
              • #8 Collapse

                **Hanging Men Candlestick Pattern Kya Hai?**
                Hanging Men candlestick pattern forex trading mein ek important chart pattern hai jo typically trend reversal ko indicate karta hai. Is pattern ko recognize karna traders ke liye crucial hai kyunki yeh market sentiment ke changes ko highlight karta hai, especially jab uptrend ke baad develop hota hai.

                **Hanging Men Candlestick Pattern Ki Characteristics:**

                1. **Appearance:** Hanging Men pattern ek single candlestick hota hai jo usually uptrend ke baad develop hota hai. Ismein candlestick ki body choti hoti hai aur lower shadow (ya tail) lamba hota hai, jo ke price ke neeche extend hota hai.

                2. **Body Size:** Candlestick ki body ideally upper shadow se choti hoti hai, indicating price ke neeche se recovery hone ki indication.

                3. **Upper Shadow:** Candlestick ki upper shadow minimal hoti hai ya phir nahi hoti, jo ke selling pressure ki kami ko show karta hai.

                **Hanging Men Ka Interpretation:**

                Hanging Men pattern ka interpretation traders ke liye important hai:

                - **Reversal Signal:** Hanging Men pattern uptrend ke baad develop hone se market ka potential reversal signal deta hai.

                - **Market Sentiment Change:** Is pattern mein price initially higher jaata hai lekin phir sellers price ko neeche drag karte hain, indicating sentiment change.

                - **Confirmation:** Is pattern ko confirm karne ke liye next candlestick ka wait kiya jata hai. Agar next candlestick downward movement show karta hai, toh hanging men pattern confirm hota hai.

                **Hanging Men Ka Trading Strategy:**

                Agar aap Hanging Men pattern ko spot karte hain, toh aapko iske saath sahi trading strategy apply karni chahiye:

                1. **Confirmation:** Pattern ko confirm karne ke liye next candlestick ka wait karein. Agar next candlestick downward move show karta hai, toh reversal ke chances zyada hote hain.

                2. **Entry Point:** Entry point ko define karein jab price support level ko break karta hai ya phir hanging men candlestick ke neeche jaata hai.

                3. **Stop Loss:** Always stop loss rakhein to manage risk, jaise ke recent high ya pattern ke upper part ke just above.

                4. **Target:** Target price ko set karein based on risk-reward ratio, jisse ke potential profit maximize ho sake.

                **Conclusion:**

                Hanging Men candlestick pattern ek valuable tool hai jo traders ko potential reversals identify karne mein madad karta hai. Isko sahi tarah se recognize aur interpret karna market analysis ka ek crucial aspect hai, jo ke risk management aur trading decisions ko improve karta hai. Traders ko is pattern ke saath proper technical analysis aur market context ko bhi consider karna chahiye, taki effective trading strategies develop ki ja sakein.

                Is tarah ke candlestick patterns ka knowledge gain karne se traders apne trading skills ko enhance kar sakte hain aur market trends ko better understand karke profitable trading opportunities explore kar sakte hain.
                • <a href="https://www.instaforex.org/ru/?x=ruforum">InstaForex</a>
                • #9 Collapse

                  **Hanging Man Candlestick Pattern**
                  Hanging Man ek bearish reversal candlestick pattern hai jo market ke uptrend ke baad appear hota hai aur potential trend reversal ko indicate karta hai. Yeh pattern ek single candlestick formation par based hota hai aur market mein selling pressure aur potential bearish reversal ko highlight karta hai.

                  **Characteristics of Hanging Man Pattern:**

                  1. **Single Candlestick:** Hanging Man pattern ek single candlestick par based hota hai. Is pattern ka appearance ek inverted "T" shape ki tarah hota hai, jisme ek chhoti body aur lambi lower shadow hoti hai.

                  2. **Lower Shadow:** Hanging Man ke lower shadow (wick) lamba hota hai, jo ki body se kam az kam do guna lamba hona chahiye. Yeh shadow price ke low level ko indicate karta hai jahan market ne selling pressure ko experience kiya.

                  3. **Small Body:** Body chhoti hoti hai aur generally upper shadow ke close ke kareeb hoti hai. Yeh body green (bullish) ya red (bearish) ho sakti hai, lekin yeh generally small hoti hai.

                  4. **Upper Shadow:** Upper shadow chhoti hoti hai ya bilkul nahi hoti, jo indicate karta hai ke price ne higher levels ko sustain nahi kiya aur close ke near hi aayi hai.

                  **Formation and Significance:**

                  1. **Uptrend Presence:** Hanging Man pattern tab form hota hai jab market ek strong uptrend mein hota hai. Yeh pattern price ke recent highs ke baad form hota hai aur potential bearish reversal ka signal deta hai.

                  2. **Reversal Signal:** Hanging Man ka formation strong selling pressure aur potential trend reversal ka indication hota hai. Yeh pattern show karta hai ke buyers market ko higher levels tak push karne ke bawajood, sellers ne price ko wapas neeche le aaya.

                  **Trading the Hanging Man Pattern:**

                  1. **Confirmation:** Hanging Man pattern ko ek bearish reversal signal ke tor par consider karne se pehle, additional confirmation ki zaroorat hoti hai. Confirmation ke liye next candlestick ko observe karna zaroori hai jo bearish close aur volume ke sath hona chahiye.

                  2. **Entry Point:** Hanging Man pattern ke confirmation ke baad, aap short trade initiate kar sakte hain. Entry point generally Hanging Man ke low ke thoda neeche rakha jata hai.

                  3. **Stop-Loss:** Stop-loss order ko Hanging Man ke high ke thoda upar place karna chahiye taake false breakouts aur unexpected market movements se protection mil sake.

                  4. **Take-Profit:** Profit target ko recent support levels ya fixed risk/reward ratio ke base par set karna chahiye. Yeh target market ke potential downtrend ko reflect karta hai.

                  **Example:**

                  Agar USD/JPY pair ek strong uptrend mein hai aur ek Hanging Man pattern bana hai jisme lambi lower shadow aur chhoti body hoti hai, toh yeh bearish reversal pattern ko indicate karta hai. Confirmation ke baad, aap short trade enter kar sakte hain, stop-loss Hanging Man ke high ke thoda upar place kar sakte hain, aur profit target recent support levels par set kar sakte hain.

                  **Conclusion:**

                  Hanging Man candlestick pattern ek valuable bearish reversal pattern hai jo market ke strong uptrend ke baad potential downtrend ko indicate karta hai. Is pattern ko sahi context aur additional confirmation indicators ke sath identify karne aur trade karne se traders market ke bearish moves ko effectively capture kar sakte hain aur profitable trades le sakte hain. Proper risk management ke sath, Hanging Man pattern trading strategies ko enhance karne mein madadgar hota hai.

                  اب آن لائن

                  Working...
                  X