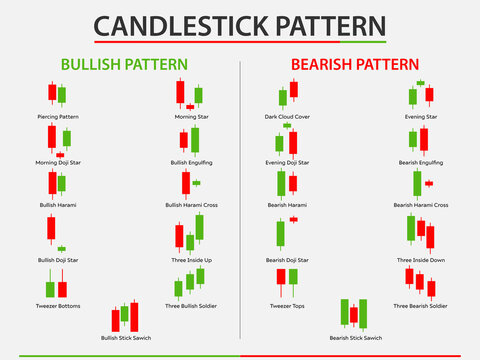
Barish candlestick pattern kya hta hy
X
  • وقت
  • دکھائیں
Clear All
new posts
  • #1 Collapse

    Barish candlestick pattern kya hta hy
    INTRODUCTION

    Barish candlestick pattern ek bearish reversal pattern hai jo uptrend ke end per aata hai. Is pattern mein, do candlesticks hoti hain:
    • Pahli candlestick bullish hoti hai, yani uski body uptrend ke sath hoti hai.
    • Dusri candlestick bearish hoti hai, yani uski body uptrend ke khilaf hoti hai.

    Is pattern ki reliability is baat per depend karti hai ki dusri candlestick ki body pahli candlestick ki body ko poori tarah se engulf karti hai. Agar dusri candlestick ki body pahli candlestick ki body ko poori tarah se engulf karti hai, to pattern ko aur bhi reliable mana jata hai.

    Barish candlestick pattern ka matlab hai ki buyers ka pressure kam ho raha hai aur sellers ka pressure badh raha hai. Is pattern ke aane ke baad, market mein bearish sentiment badh sakta hai aur prices niche ja sakti hain.

    How to trade
    Barish candlestick pattern ko trade karne ke liye, aap is pattern ke aane ke baad market mein short position le sakte hain. Aap ek stop loss order set kar sakte hain jo is pattern ke aane ke baad market mein price ke upar ho.
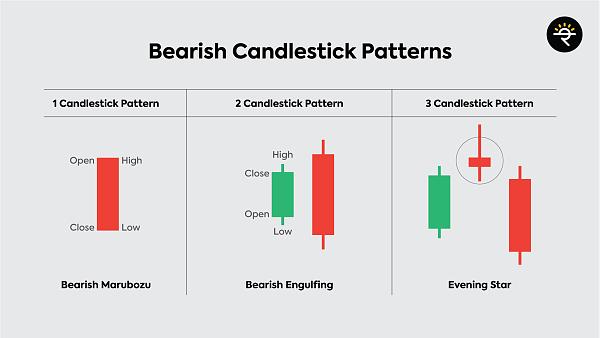
    Click image for larger version

Name:	42MPkcandlestickpattern.jpg
Views:	41
Size:	153.6 کلوبائٹ
ID:	12791308
    Yahan ek example diya gaya hai barish candlestick pattern ka:

    EXAMPLE
    Date | Open | High | Low | Close ------- | -------- | -------- | -------- | -------- 2023-07-20 | 100 | 105 | 95 | 102 2023-07-21 | 102 | 103 | 98 | 99

    Is example mein, pahli candlestick bullish hai, yani uski body uptrend ke sath hai. Dusri candlestick bearish hai, yani uski body uptrend ke khilaf hai. Dusri candlestick ki body pahli candlestick ki body ko poori tarah se engulf karti hai. Isliye, yah barish candlestick pattern hai.

    Barish candlestick pattern ek powerful bearish reversal pattern hai. Is pattern ko trade karne ke liye, aapko market mein bearish sentiment ke liye tayyar hona chahiye.

    CONCLUSION
    Ummid karta Hun ki aapko barish candle stick pattern ki samajh a Gai Hogi is topic ko gaur se padhe Taki aapko trading Karne ka tarika samajh a sake aur aapke knowledge mein izaafa ho sake..
  • <a href="https://www.instaforex.org/ru/?x=ruforum">InstaForex</a>
  • #2 Collapse


    Barish Candlestick Pattern Kya Hai:

    Candlestick patterns, ya moomiyati paterns, share market mein technical analysis ke liye istemal hoti hain taake traders ko market ke future movements ka andaza lagaya ja sake. In patterns mein se ek ahem aur commonly used pattern hai, "Barish Candlestick Pattern." Barish, yaani rain, ki tarah, yeh pattern market mein ek reversal ya trend change ko darust karti hai.
    Click image for larger version

Name:	forex-trading-truths-and-lies_body_truthvslies2.png.full.png
Views:	45
Size:	57.0 کلوبائٹ
ID:	12791319
    Barish Candlestick Pattern Kya Hota Hai:

    Barish Candlestick Pattern ek bearish reversal pattern hai, jise dekh kar traders samajh sakte hain ke upar ka trend khatam hone wala hai aur neeche ka trend shuru hone wala hai. Is pattern ko samajhne ke liye, aapko candlesticks ki body, wicks, aur consecutive candles ki formation par dhyan dena hoga.

    Is pattern mein, ek bearish candlestick hoti hai jiska close price pehle candlestick ke opening price se neeche hota hai. Isse ek gap banta hai jo market ke weakness ko darust karta hai. Yeh gap dikhata hai ke sellers ne control haasil kar liya hai aur buyers ko hara diya gaya hai.

    Barish Candlestick Pattern Ki Pehchan:

    Barish Candlestick Pattern ko pehchanna asaan hota hai. Is pattern mein pehli candle bullish hoti hai, jo ke uptrend ko represent karti hai. Lekin doosre candle mein, jo bearish hoti hai, uski closing price pehle candle ke opening price se neeche hoti hai, jisse gap ban jata hai.

    Yeh gap bearish reversal ko confirm karta hai. Iske baad, market mein bearish momentum badhne lagta hai, aur traders ko lagta hai ke ab neeche ka trend shuru hone wala hai.

    Barish Candlestick Pattern Ka Istemal:

    Barish Candlestick Pattern ka istemal traders market mein hone wale trend changes ko pehle se samajhne mein karte hain. Agar yeh pattern sahi taur par confirm hota hai, toh traders apne positions ko adjust kar sakte hain, jisse unka risk kam ho aur unhe market ke new trend ke sath chalne ka mauka mil sake.

    Hamesha yaad rakhein ke kisi bhi ek indicator ya pattern par pura bharosa na karein, balki market analysis ke liye multiple tools ka istemal karein. Market mein hamesha uncertainty hoti hai, aur har ek trade risk ke sath juda hota hai.

    In conclusion, Barish Candlestick Pattern ek important bearish reversal pattern hai jo traders ko market ke trend changes ko samajhne mein madad karta hai. Isko samajhna aur istemal karna traders ke liye ek zaroori skill ho sakti hai, lekin hamesha prudent aur cautious trading approach rakhna bhi mahatva purna hai.

    • #3 Collapse


      Barish Candlestick Pattern: Ek Mazboot Technical Analysis Tool

      Candlestick patterns market analysis mein aham kirdar ada karte hain, aur inka istemal traders ko market movements samajhne mein madad karta hai. Barish Candlestick Pattern ek aesa prakar ka pattern hai jo market mein bearish trend ko darust karti hai. Is article mein hum Barish Candlestick Pattern ke bare mein roman Urdu mein baat karenge aur samjhayenge ki ye kya hai aur kaise kaam karta hai.

      Barish Candlestick Pattern Kya Hai?

      Barish Candlestick Pattern ek technical analysis tool hai jo traders ko market ke possible bearish reversals ko identify karne mein madad karta hai. Ye pattern market mein seller dominance ko indicate karta hai. Iske naam mein "Barish" shabd ka istemal isliye kiya jata hai kyun ki is pattern ki formation se samajh aata hai ki buyers ko market control chhod raha hai aur sellers ka dabav badh raha hai.

      Barish Candlestick Pattern Ki Pechan:

      Barish Candlestick Pattern ko pehchanne ke liye aapko kuch important points par dhyan dena hoga:
      1. Single Candle Pattern: Barish Candlestick Pattern ek single candle se juda hua pattern hai. Ismein ek candle hota hai jo market mein bearish sentiment ko darust karta hai.
      2. Long Body: Barish candle ka body lamba hota hai aur iska color usually red hota hai, jo ki bearish movement ko darust karta hai.
      3. Shadows: Is candle mein shadows yaani ki upper aur lower wicks chhote hote hain, indicating ki opening aur closing prices ke beech mein kamzorii hai.

      Barish Candlestick Pattern Ke Types:
      1. Bearish Engulfing Pattern: Ye pattern ek bullish candle ko engulf karta hai, indicating a reversal of the trend. Ismein bearish candle ki opening price bullish candle ki closing price se upar hoti hai.
      2. Bearish Harami Pattern: Is pattern mein ek chota sa bearish candle ek bada bullish candle ko follow karta hai. Ye bhi trend reversal ko show karta hai.
      3. Dark Cloud Cover: Is pattern mein ek bullish candle ke upar ek bearish candle aata hai, jiska closing price pehle candle ke upper half mein hota hai. Ye bhi bearish reversal ko darust karta hai.

      Barish Candlestick Pattern Ka Istemal:

      Traders Barish Candlestick Pattern ka istemal karke market movements ka analysis karte hain aur isse bearish reversals ko pehchanne ki koshish karte hain. Agar ye pattern sahi taur par samjha jaye toh isse future price movements ke liye sahi trading decisions liye ja sakte hain.

      Aakhir Mein:

      Barish Candlestick Pattern ek powerful tool hai jo traders ko market sentiment ko samajhne mein madad karta hai. Iske istemal se traders market ke bearish reversals ko pehchan kar apne trading strategies ko optimize kar sakte hain. Lekin yaad rahe, market analysis mein hamesha risk hota hai aur kisi bhi pattern ki guarantee nahi hoti. Isliye, prudent risk management ke saath hi trading ki jani chahiye.

      • #4 Collapse


        Barish candlestick pattern forex trading mein ek important aur frequently used technical analysis tool hai jo market ke downward movements ko indicate karta hai. Yeh pattern bearish reversals, downtrends aur selling pressure ko identify karne mein madad karta hai.

        Barish candlestick pattern ko samajhne ke liye, pehle humein candlesticks aur unki basic terminology ko samajhna zaroori hai. Candlesticks market ke price action ko represent karte hain aur har candlestick ek specific time period ko darust karta hai, jaise ek din, ek ghanta, ya ek minute.

        Ek standard candlestick do parts se bana hota hai: body aur wicks . Candlestick ki body range ko represent karti hai jis mein price open aur close hota hai, jabki wicks price ki high aur low ko represent karte hain. Agar candlestick bullish hai, matlab ke price close open se ziada hai, aur agar bearish hai, toh price close open se kam hai.


        Barish candlestick pattern ki characteristics
        • Barish candlestick pattern mein ek bearish candlestick hota hai jiska range normal hota hai aur body ki length moderate hoti hai.
        • Is pattern mein bearish candlestick ke neeche ka price gap nahi hota. Agar gap hota hai, toh isko alag tarah ke bearish continuation pattern ya reversal pattern kehte hain.
        • Bearish candlestick ke neeche wicks ki length bhi moderate hoti hai aur body se choti hoti hai, indicating selling pressure aur bearish momentum.

        Barish candlestick pattern ke kuch alag variations bhi hote hain jo traders ko market ki movement ke bare mein aur zyada information dete hain. Kuch popular variations mein doji bearish pattern, engulfing bearish pattern, aur harami bearish pattern shamil hain.


        Barish candlestick pattern ka istemal
        • Entry Points: Barish candlestick pattern ko entry points ke liye istemal kiya ja sakta hai. Agar bearish candlestick form ho raha hai, toh traders short positions enter kar sakte hain expecting a downward movement in price.
        • Stop Loss Placement: Traders stop loss levels ko bearish candlestick ke high ke upper set kar sakte hain. Agar price bearish candlestick ke high se upper jaati hai, toh yeh indicate karta hai ke pattern invalid ho gaya hai aur traders ko apni positions ko close karna chahiye.
        • Take Profit Levels: Take profit levels ko set karne ke liye, traders support levels ya Fibonacci retracement levels ka istemal kar sakte hain. Agar price support level tak pahunch jaata hai, toh traders apne profits lock kar sakte hain.


        Barish candlestick pattern forex trading mein ek important bearish reversal pattern hai jo traders ko market ke downward movements ko identify karne mein madad karta hai. Is pattern ka istemal karke traders market ke reversals ko anticipate kar sakte hain aur potential entry aur exit points ko determine kar sakte hain. Lekin, yaad rahe ke kisi bhi candlestick pattern ki tarah, Barish candlestick pattern bhi khud mein perfect nahi hai aur false signals bhi generate kar sakta hai. Is liye traders ko always proper risk management aur market analysis ke sath iska istemal karna chahiye.
        • #5 Collapse

          Stock market mein trading karte waqt, traders ko mukhtalif patterns aur indicators ka istemal karna hota hai taake woh market ki movement ko samajh sake aur trading decisions ko optimize kar sakein. Ek aham aur popular pattern jo traders istemal karte hain, wo hai "Barish Candlestick Pattern".

          Barish candlestick pattern ek reversal pattern hai, jo market ke uptrend ya downtrend ke badalne ka signal deta hai. Is pattern ka naam "Barish" se lia gaya hai, kyunki iski shape ek barish ke baad ki boond ki tarah hoti hai.

          Kya Hai Barish Candlestick Pattern?

          Barish candlestick pattern mein, do alag alag candlesticks ka combination hota hai jo market ki movement ko indicate karta hai. Is pattern mein pehli candlestick ek lambi green candle hoti hai, jo uptrend ko represent karti hai. Dusri candlestick ek choti red candle hoti hai, jo pehli candlestick ki range ke andar rehti hai aur uptrend ke opposite direction mein hoti hai.

          Barish Candlestick Pattern Ke Types:
          1. Bullish Barish Pattern: Ye pattern market ke uptrend ke baad aata hai aur bullish trend ka end indicate karta hai. Is pattern mein pehli candlestick lambi green candle hoti hai, jo uptrend ko show karti hai. Dusri candlestick ek choti red candle hoti hai jo pehli candlestick ki range ke andar rehti hai aur uptrend ke opposite direction mein hoti hai.
          2. Bearish Barish Pattern: Ye pattern market ke downtrend ke baad aata hai aur bearish trend ka end indicate karta hai. Is pattern mein pehli candlestick lambi red candle hoti hai, jo downtrend ko show karti hai. Dusri candlestick ek choti green candle hoti hai jo pehli candlestick ki range ke andar rehti hai aur downtrend ke opposite direction mein hoti hai.

          Barish Candlestick Pattern Ka Istemal:

          Barish candlestick pattern ka istemal kar ke traders market ki movement ka analysis karte hain aur trading decisions banate hain. Agar ek bullish barish pattern dikhta hai, to traders expect karte hain ke market ka uptrend khatam hone wala hai aur bearish trend shuru hoga. Isi tarah, agar ek bearish barish pattern dikhta hai, to traders expect karte hain ke market ka downtrend khatam hone wala hai aur bullish trend shuru hoga.

          Final Words:

          Barish candlestick pattern ek powerful tool hai jo traders ko market ke reversals ko anticipate karne mein madad karta hai. Lekin, yeh pattern bhi sirf ek tool hai aur iska istemal karne se pehle traders ko aur bhi factors ka dhyan rakhna chahiye jaise ke trend, volume, aur market sentiment. Isi tarah, har ek trading decision ko carefully analyze karna zaroori hai taake loss se bacha ja sake aur profit maximized ho sake.
          • #6 Collapse

            Barish candlestick pattern, ya bearish candlestick pattern, ek technical analysis concept hai jo market mein bearish trend ko darust karta hai. Ye pattern ek individual candlestick ya series of candlesticks ko refer karta hai jo downward price movement ko indicate karte hain. Yeh pattern traders ko potential sell signals provide karta hai. Neeche barish candlestick pattern ki tafseel di gayi hai

            Barish Candlestick Pattern

            1. Single Bearish Candlestick
            - Ek bearish candlestick pattern mein, ek single candlestick hota hai jo market mein bearish momentum ko represent karta hai.
            - Is candlestick ki opening price usually upper wick se hoti hai aur closing price lower wick se hoti hai, indicating ki price high se low ki taraf gayi hai.
            - Is pattern mein candle ki body red (or black) hoti hai, indicating selling pressure.

            2. Series of Bearish Candlesticks
            - Kabhi kabhi, multiple consecutive bearish candlesticks ko dekha jaata hai jo ek bearish trend ko indicate karte hain.
            - Har candlestick ki closing price, pehle ki closing price se neeche hoti hai, suggesting ki downtrend mein continued selling pressure hai.

            Common Examples of Bearish Candlestick Patterns

            1. Bearish Engulfing Pattern
            Is pattern mein ek large bearish candlestick ek small bullish candlestick ko engulf karta hai, indicating bearish reversal.

            2. Dark Cloud Cover Pattern
            Is pattern mein ek bullish candlestick ek bearish candlestick ke upar close karta hai, indicating bearish reversal.

            3. Evening Star Pattern
            Is pattern mein ek large bullish candlestick, ek small-bodied candlestick (with small body or doji), aur phir ek large bearish candlestick dekha jaata hai, indicating bearish reversal.

            Interpretation
            Barish candlestick pattern bearish market sentiment ko indicate karta hai aur traders ko selling opportunities provide karta hai. Ye pattern bullish trend ke reversal ya downtrend ke continuation ko darust karta hai. Traders is pattern ko samajh kar apne trading strategies mein incorporate kar sakte hain, lekin confirmatory signals aur risk management ke saath mila kar istemal karna zaroori hai.

            Barish candlestick pattern ko samajhne ke liye practice aur experience ki zaroorat hoti hai. Iske saath sahi risk management ka istemal karna bhi ahem hai trading decisions ke liye.
            • #7 Collapse

              Barish candlestick pattern ek technical analysis tool hai jo stock market mein istemal hota hai. Yeh pattern market trends ko analyze karne aur future price movements ka prediction karne mein madad karta hai. Barish candlestick pattern ka naam isliye hai kyunki iska istemal bearish trends yaani price decline ko identify karne ke liye hota hai.
              Barish candlestick pattern kaafi popular hai traders aur investors ke darmiyan, khaaskar un logon ke darmiyan jo short selling ya hedging strategies ka istemal karte hain. Is pattern ka sahi tarah se samajhna aur interpret karna, market mein successful trading karne ke liye zaroori hai.

              Barish Candlestick Pattern Kya Hai?

              Barish candlestick pattern ek bearish trend ka indication deta hai jahan price decline hoti hai. Is pattern mein ek ya zyada candlesticks ki configuration hoti hai jo downward movement ko represent karta hai. Har candlestick ka apna significance hota hai jise traders aur investors analyze karte hain.
              Is pattern ka istemal chart analysis mein kiya jata hai jahan har candlestick ka price movement ko represent karta hai. Barish candlestick pattern ki pehchan karne ke liye traders ko candlestick ki body, wicks aur color ko dekhna hota hai.

              Kaise Kaam Karta Hai?

              Yeh pattern chart par candlesticks ke through represent kiya jata hai, jo downward movement ko indicate karta hai. Har candlestick ka apna open, high, low, aur close price hota hai jo uski body, wicks, aur color ke through represent kiya jata hai.
              Jab market mein bearish trend hota hai, to barish candlestick pattern ki configuration mein ek ya zyada candlesticks kaafi nichayi taraf close hoti hain, indicating price decline. Traders is pattern ko istemal karke market ke bearish movements ko identify karte hain aur apni trading strategies ko adjust karte hain.

              Components of Barish Candlestick Pattern:

              Is pattern mein do main components hote hain: opening price aur closing price. Opening price wo price hai jahan ek candlestick ka trading session shuru hota hai aur closing price wo price hai jahan trading session khatam hota hai.
              Jab closing price opening price se nichayi hoti hai, to candlestick ka color typically red ya black hota hai, indicating bearish movement. Isi tarah, candlestick ki body ka size bhi bearish movement ko represent karta hai. Agar candlestick ki body lambi hoti hai aur wicks chhoti hain, to yeh strong bearish movement ko indicate karta hai.

              Types of Barish Candlestick Patterns:

              Kuch mukhtalif types ki barish candlestick patterns hoti hain jaise ki shooting star, engulfing pattern, aur doji. Har ek pattern ka apna significance hota hai aur traders unhe alag-alag market conditions mein istemal karte hain.

              Shooting Star:

              Shooting star ek single candlestick pattern hai jo uptrend ke baad aata hai aur reversal ki possibility dikhata hai. Is pattern mein ek lambi upper wick hoti hai jo price ke upar gayi hoti hai aur ek chhoti body hoti hai jo lower side par close hoti hai. Yeh pattern bearish reversal ka indication deta hai agar isko uptrend ke baad dekha jaye.

              Engulfing Pattern:

              Engulfing pattern mein ek candlestick dusre candlestick ko poori tarah engulf karta hai, indicating a reversal. Yeh pattern ek strong reversal signal deta hai jab ek bearish candlestick ek previous bullish candlestick ko poori tarah engulf karta hai. Is pattern ko istemal karke traders bearish reversal ki entry points identify karte hain.

              Doji:

              Doji ek aise pattern hai jahan opening aur closing price barabar hoti hai, indicating market ka indecision. Is pattern mein candlestick ki body almost nahi hoti hai aur sirf do chhoti wicks hote hain. Doji ko dekhte hue traders ko market ke future direction ke baare mein doubt hota hai aur iske baad often ek reversal dekha jata hai.

              Barish Candlestick Pattern Ka Istemal:

              Traders aur investors barish candlestick pattern ka istemal karke market direction ka analysis karte hain. Is pattern ko samajhne ke liye traders ko candlestick formations ko study karna hota hai aur unhe market trends ko identify karne mein help milta hai.
              Barish candlestick pattern ka istemal karke traders market ke bearish movements ko identify karte hain aur apni trading strategies ko adjust karte hain. Is pattern ka sahi tarah se istemal karke traders apne trading decisions ko improve kar sakte hain aur profit ko maximize kar sakte hain.

              Reversal Signal:

              Barish candlestick pattern bearish trend ke reversal ko indicate karta hai aur traders ko sell karne ki advice deta hai. Jab market mein bearish trend hota hai aur barish candlestick pattern dikhta hai, to traders ko selling opportunities milte hain jisse wo profit earn kar sakte hain.
              Is pattern ka sahi tarah se interpretation karke traders apne positions ko timely exit kar sakte hain aur potential losses se bach sakte hain. Barish candlestick pattern bearish trend ke reversal points ko identify karne mein traders ko madad karta hai aur unhe market ke movements ko samajhne mein help karta hai.

              Risk Management:

              Is pattern ka istemal karke traders apni positions ko manage karte hain aur loss ko minimize karte hain. Jab market mein bearish trend hota hai aur barish candlestick pattern dikhta hai, to traders apne stop-loss orders ko set kar sakte hain jisse unka risk kam ho jata hai.
              Barish candlestick pattern ka sahi tarah se istemal karke traders apne risk ko control kar sakte hain aur apni positions ko protect kar sakte hain. Is pattern ka istemal karke traders apne trading strategies ko improve karte hain aur consistent profits earn kar sakte hain.

              Barish Candlestick Pattern Ka Importance:

              Yeh pattern market mein price action ko samajhne mein madad karta hai aur traders ko potential reversals ka pata lagane mein help karta hai. Barish candlestick pattern ka istemal karke traders market ke bearish movements ko identify karte hain aur apni trading strategies ko adjust karte hain.
              Barish candlestick pattern ka sahi tarah se istemal karke traders apne trading decisions ko improve kar sakte hain aur consistent profits earn kar sakte hain. Is pattern ka importance market analysis mein bahut zyada hota hai aur traders ko market trends ko samajhne mein help karta hai.

              Conclusion:

              Barish candlestick pattern ek powerful tool hai jo market analysis mein istemal kiya jata hai, lekin iska istemal karne se pehle thorough research aur practice ki zarurat hoti hai. Traders ko candlestick formations ko study karna chahiye aur market trends ko samajhne ke liye barish candlestick pattern ka sahi tarah se interpretation karna chahiye.
              Is pattern ka istemal karke traders apne trading decisions ko improve kar sakte hain aur consistent profits earn kar sakte hain. Barish candlestick pattern ka sahi tarah se istemal karke traders apne risk ko control kar sakte hain aur apni positions ko protect kar sakte hain.
              • #8 Collapse

                Barish candlestick pattern kya hta hy

                Click image for larger version

Name:	images (77).jpeg
Views:	19
Size:	26.0 کلوبائٹ
ID:	12886726

                Barish Candlestick Pattern Kya Hota Hai: Ek Mutala


                Mukhtasir Tareef:
                Barish candlestick pattern ek technical analysis tool hai jo stock market ya forex market mein istemal hota hai. Is pattern ko candlestick charts par dekha jata hai aur yeh traders ko market trend aur price movement ke baray mein maloomat faraham karta hai.

                Aghaz:
                Barish candlestick pattern ka aghaz Japan mein hua tha. Japanese traders ne isay pehli martaba dekha aur istemal kiya. Baad mein, isay western countries mein bhi popular kiya gaya.

                Barish Candlestick Pattern Kya Hota Hai:
                Barish candlestick pattern mein, ek ya zyada candles ki formation hoti hai jo market ke direction ke baray mein maloomat faraham karti hai. Is pattern mein do mukhtalif prakar ke candles shamil hote hain:
                1. Bullish Barish Candle:
                  • Bullish barish candle ek uptrend ke doran banti hai.
                  • Is candle ka opening price closing price se zyada hota hai.
                  • Iski body lambi hoti hai aur shade chhoti hoti hai.
                  • Yeh bullish trend ko indicate karta hai.
                2. Bearish Barish Candle:
                  • Bearish barish candle ek downtrend ke doran banti hai.
                  • Is candle ka closing price opening price se zyada hota hai.
                  • Iski body bhi lambi hoti hai aur shade chhoti hoti hai.
                  • Yeh bearish trend ko indicate karta hai.

                Barish Candlestick Pattern Ke Alamaat:
                Barish candlestick pattern ke kuch aham alamaat hain:
                • Body Size: Barish candle ki body ka size trend ke intensity ko darust karta hai. Lambi body zyada intense trend ko darust karti hai.
                • Shadows: Shade ki lambai bhi trend ki strength ko darust karti hai. Chhoti shade weak trend ko darust karti hai jabke lambi shade strong trend ko darust karti hai.
                • Color: Bullish barish candle green ya white color ki hoti hai jabke bearish barish candle red ya black color ki hoti hai.

                Barish Candlestick Pattern Ka Istemal:
                Traders barish candlestick pattern ko market ke trend aur price action ko analyze karne ke liye istemal karte hain. Is pattern ki madad se wo:
                • Trend Ko Confirm Karte Hain: Barish candlestick pattern se trend confirm kiya ja sakta hai, jo traders ko sahi entry aur exit points ka pata lagane mein madad karta hai.
                • Price Reversal Ko Identify Karte Hain: Barish candlestick pattern se price reversal ka pata lagaya ja sakta hai, jisse traders loss se bach sakte hain aur profit kamane ka moqa milta hai.
                • Risk Management: Is pattern ki madad se traders apni trading strategies ko improve kar sakte hain aur risk management ko behtar banate hain.

                Mukhtalif Barish Candlestick Patterns:
                Barish candlestick pattern ki kuch mashhoor shaklain hain:
                • Hammer: Bullish reversal signal hai.
                • Shooting Star: Bearish reversal signal hai.
                • Engulfing Pattern: Trend reversal signal hai.

                Conclusion:
                Barish candlestick pattern ek aham technical analysis tool hai jo traders ko market trends aur price movements ke baray mein maloomat faraham karta hai. Iske istemal se traders apni trading strategies ko improve kar sakte hain aur behtar faisle le sakte hain. Lekin, isay samajhne aur istemal karne ke liye, traders ko market ke fundamentals ko samajhna zaroori hai.
                • #9 Collapse


                  Barish candlestick pattern kya hta hy


                  "Barish candlestick pattern" bearish trend ke indication ke liye use hota hai aur ye market mein price ki girawat ko darust karta hai. Jab kisi candlestick ka closing price opening price se neeche hota hai, tab woh candle bearish ya barish candle kehlaya jata hai. Iska matlab hai ke us samay sellers market mein control mein hote hain aur price downward direction mein move kar rahi hai.

                  Barish candlestick patterns kai alag alag shapes aur sizes mein aate hain, jaise ki:
                  1. Bearish Engulfing:
                    • Ye pattern jab hota hai jab ek lamba bearish candle ek chhota bullish candle ko puri tarah se engulf kar leta hai, aur isse reversal signal samjha jata hai.
                  2. Bearish Harami:
                    • Ye pattern ek chhote bullish candle ke baad ek lamba bearish candle ke appearance ko describe karta hai. Isse bhi reversal signal samjha jata hai.
                  3. Bearish Marubozu:
                    • Ye pattern jab hota hai jab ek lamba bearish candle form hota hai jismein neither upper shadow nor lower shadow hota hai, indicating ki sellers ne control puri tarah se le liya hai.
                  4. Dark Cloud Cover:
                    • Ye pattern bullish trend ke baad dekha jata hai, jab ek bullish candle ke baad ek large bearish candle form hota hai jise pehle candle ki half se bhi zyada cover karta hai.

                  Ye to kuch bearish candlestick patterns hain, lekin market mein aur bhi kai tarah ke bearish patterns hote hain jo traders ke liye useful hote hain. In patterns ka istemal karke traders bearish movements ko identify karke apne trading strategies ko shape karte hain.


                  • <a href="https://www.instaforex.org/ru/?x=ruforum">InstaForex</a>
                  • #10 Collapse

                    **Bearish Candlestick Pattern Kya Hota Hai?**
                    Forex trading aur stock markets mein, candlestick patterns price movements aur market trends ko samajhne ke liye use kiye jate hain. Inmein se ek ahem pattern hai "Bearish Candlestick Pattern." Yeh pattern market ke downward movements aur potential sell opportunities ko indicate karta hai. Aayiye dekhte hain ke Bearish Candlestick Pattern kya hai aur iska Forex trading mein kaise istemaal kiya jata hai.

                    **Bearish Candlestick Pattern Ki Definition:**

                    Bearish Candlestick Pattern ek technical analysis tool hai jo market ke bearish (downward) trend ko indicate karta hai. Is pattern ke zariye traders ko market ke potential reversals aur downtrends ke signals milte hain. Yeh pattern candlestick chart par develop hota hai aur price data ke specific formations ko represent karta hai.

                    **Popular Bearish Candlestick Patterns:**

                    1. **Bearish Engulfing Pattern:**
                    - Yeh pattern do candlesticks ka combination hota hai. Pehla candlestick chhoti body aur small range wala hota hai, jab ke doosra candlestick bada aur pehle candlestick ko completely engulf karta hai. Jab yeh pattern develop hota hai, to yeh market ke bearish trend ke start hone ka signal hota hai.

                    2. **Shooting Star:**
                    - Shooting Star ek single candlestick pattern hai jo market ke upar ke trend ke baad develop hota hai. Is pattern ki body chhoti hoti hai aur upper shadow lambi hoti hai. Shooting Star ke baad price neechay move karne lagti hai, jo bearish trend ko indicate karta hai.

                    3. **Dark Cloud Cover:**
                    - Dark Cloud Cover bhi ek two-candlestick pattern hai. Pehli candlestick bullish (upward) hoti hai aur doosri candlestick pehli candlestick ke body ke upar se open hoti hai aur uske half se zyada area ko cover karti hai. Yeh pattern bearish reversal ka signal hota hai.

                    4. **Evening Star:**
                    - Evening Star ek three-candlestick pattern hota hai. Pehli candlestick bullish hoti hai, doosra candlestick chhota aur body-less hota hai (star formation), aur teesra candlestick bearish hota hai. Yeh pattern market ke reversal aur downtrend ke indication ko provide karta hai.

                    **Bearish Candlestick Patterns Ka Use:**

                    1. **Trend Reversal:**
                    - Bearish candlestick patterns market ke upward trend ke reversal ko indicate karte hain. Jab yeh patterns develop hoti hain, to yeh traders ko potential sell signals provide karti hain. Yeh patterns market ke upar ke movements ko downward trend me convert karne ki indication deti hain.

                    2. **Sell Signals:**
                    - Bearish candlestick patterns sell signals generate karti hain. Jab yeh patterns price charts par develop hoti hain, to traders ko market ke downward direction ke signal milte hain. Sell orders enter karne ke liye yeh signals use kiye jate hain.

                    3. **Confirmation with Other Indicators:**
                    - Bearish candlestick patterns ko other technical indicators ke saath combine karke trading signals ko confirm kiya jata hai. For example, RSI (Relative Strength Index) and MACD (Moving Average Convergence Divergence) ke saath combination se signals ko strengthen kiya jata hai.

                    **Benefits of Using Bearish Candlestick Patterns:**

                    1. **Clear Sell Signals:**
                    - Bearish candlestick patterns clear aur accurate sell signals provide karti hain. Yeh patterns traders ko market ke bearish trend aur potential selling opportunities ke baare mein batati hain.

                    2. **Reversal Indication:**
                    - Yeh patterns market ke trend reversal ko accurately indicate karti hain. Uptrend ke baad bearish patterns develop hote hain, jo downtrend ke start hone ke signals dete hain.

                    3. **Enhanced Decision-Making:**
                    - Bearish candlestick patterns se traders ko better decision-making aur trading strategies develop karne mein madad milti hai. Accurate sell signals aur trend reversals trading decisions ko enhance karte hain.

                    **Conclusion:**

                    Bearish Candlestick Patterns Forex trading mein ek valuable tool hain jo market ke downward movements aur sell opportunities ko indicate karte hain. Engulfing, Shooting Star, Dark Cloud Cover, aur Evening Star jese patterns price charts par specific formations ko represent karte hain. Yeh patterns trend reversals aur accurate sell signals provide karte hain, jo trading decisions ko improve aur enhance karte hain. Agar aap market ke bearish trends aur sell opportunities ko accurately detect karna chahte hain, to Bearish Candlestick Patterns aapki trading strategy ka ek important part ban sakti hain.

                    اب آن لائن

                    Working...
                    X