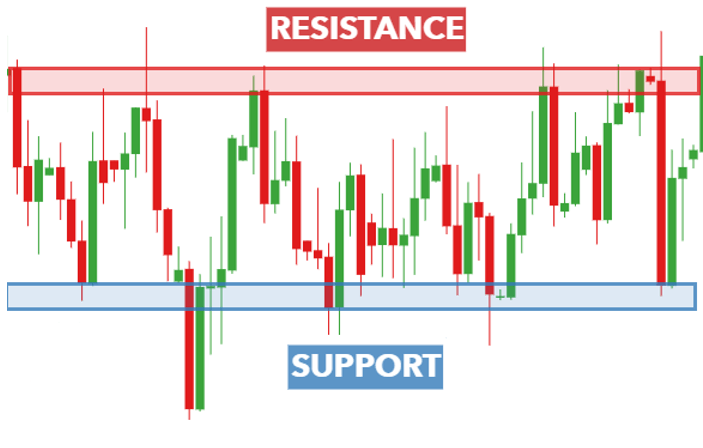
What Is Resistance?

No announcement yet.
`
X
  • وقت
  • دکھائیں
Clear All
new posts
  • #1 Collapse

    What Is Resistance?
    1What Is Resistance?


    hmaet ka mkhalf mzahmt hay۔ qemton men azafay ke ojh splae'e kay mqablay demand ka fazl hona hay۔ aek oqt aae'ay ga jb qemton men azafay kay sath frokht krnay ke khoahsh hasl krnay ke khoahsh say khen zeadh ho jae'ay ge۔ aesa honay ke ke'e ojohat hen۔ yh mmkn hay kh tajron ko ahsas ho kh oh apnay mqsd tk phnch ge'ay hen ya qemten bht zeadh hen۔ as ke aek mmknh ozaht khredaron ke atne zeadh qemton pr ne'e pozeshnen kholnay men hchkchaht ho skte hay۔ azafe ojohat ke ksrt hoskte hay۔ tahm، aek mahr qemt kay chart pr as nqth ke aasane say shnakht kr skta hay jhan splae'e mang say zeadh hona shroa ho jate hay۔ yh apozeshn hay۔ yh sport ke trh aek leol ya zon ho skta hay۔

    2The Basics


    chartng kay aml men shaml hr oqt ke mdt — rozanh، hfth oar، aor mahanh — ke hmaet aor mzahmt hote hay۔ chhotay tae'm frem، jesay kh aek mnt aor panch mnt kay chart، bhe tredrz sport aor mzahmt ke shnakht kay leay astamal kr sktay hen۔ tahm، hmaet ya mzahmt toel arsay men zeadh ahm ho jate hay۔ hmaet ya mzahmt ka taen krnay kay leay qemt men kme ya azafay men qabl zkr astap tlash krnay kay leay aap ko chart pr oqt kay sath pechhay jana chaheay۔ phr yh dekhnay kay leay dekhen kh aaea، jb yh as sth kay qreb aajata hay، qemt rk jate hay aor/ea plt jate hay۔ jesa kh phlay zkr kea gea hay، bht saray tjrbh kar tajr pchhle hmaet ya mzahmte sthon pr nzr rkhen gay aor an pr mstqbl kay tqable rdaml ke toqa men khod ko pozeshn men rkhen gay۔
    3Trendlines


    mzkorh bala msalen yh zahr krte hen kh ks trh kse asash ke qemt mstql sth pr honay kay doran zeadh ya km nhen ho skte۔ hmaet ya mzahmt ke sb say zeadh mrojh aqsam men say aek jamd rkaot hay، tahm chonkh maleate asason ke qemt aam tor pr kse bhe trh say rjhan rkhte hay، as leay oqt kay sath sath qemt ke an rkaoton men tbdele ka mshahdh krna mamol hay۔ as ojh say، sport ka mtalah krtay oqt rjhanat aor rjhanat ko s8
  • <a href="https://www.instaforex.org/ru/?x=ruforum">InstaForex</a>
  • #2 Collapse

    What Is Resistance in Forex Trading?


    Forex trading mein "resistance" ek aisi price level ko refer karta hai jahan ek currency pair ne itihas mein aage barhne mein mushkilat ka samna kiya hai. Ye ek technical analysis se aaya huwa concept hai jo amuman price charts par darust hota hai. Resistance levels ko psychological ya technical rukawat samjha jata hai jo ke prices ki upar ki taraf rawani se rukawat dalta hai.

    Resistance in Forex Trading ke Mutaliq Ahem Points:

    Tanazur:
    - Resistance, aik price chart par aisi level hai jahan bechne ki dilchaspi amuman ziada hoti hai, jis se price ko mazeed buland jaane se roka jata hai. Ye aik point hai jahan ek currency pair ne peechle dino mein bechnay se inkar kiya hai.

    Banawat:
    - Resistance levels amuman market mein peechlay high points par ban jatay hain. Jab price is level ke qareeb aata hai, to jo traders peechle dino mein is level pe khareedte thay, woh yahan se bechnay ko tayyar ho sakte hain, jis se upar ki taraf rawani se barhne mein rukawat paida hoti hai.

    Role Reversal:
    - Jab aik resistance level ko paar kardia jata hai, to ye kabhi-kabhi support ban jata hai. Iska matlab hai ke jo pehle aik rukawat banata tha, woh ab aik level ban jata hai jahan se log mazeed khareedari karne ke liye dakhil ho sakte hain.

    Multiple Approaches:
    - Traders resistance levels ko pehchanne ke liye mukhtalif tareeqon ka istemal karte hain. Ismein trendlines, horizontal price levels, ya technical indicators jese ke moving averages ya Fibonacci retracement levels shamil hote hain.

    Psychological Ahmiyat:
    - Resistance levels ki amuman psychological ahmiyat hoti hai. Traders aur investors peechlay highs ko yaad rakhte hain aur aise levels par khareedari karne mein hoshyar rehte hain.

    Volume Analysis:
    - Resistance levels par trading volume ka tajziya karna mazeed malumat faraham kar sakta hai. Resistance level par bechne ki volume mein izafah taqatwar resistance ko darust karta hai, jabke volume mein kamzori resistance level ko kamzor darust kar sakti hai.

    Trading Strategies with Resistance:

    Bechne ke Qareeb Khareedari:
    - Traders resistance level ke qareeb ponchne par currency pair ko bechna ya short karna pasand kar sakte hain, tajaweez karte hain ke price mein mudamat ya bechne ki dabawat anay wali hai.

    Taslem Ke Liye Intezar:
    - Kuch traders taslem ke liye intezaar karte hain ke resistance level ko paar karne ka tasdeeq hojaye. Jab resistance level ko mazbooti se paar karna mumkin lagta hai, to yeh ek mabain trend ko darust karne ka ishara ho sakta hai.

    Risk Management:
    - Risk management strategies ko implement karna trading ke dauran bohat zaroori hai, khas kar jab resistance ke aas-paas trading kiya jaa raha ho. Stop-loss orders tay karna aur risk-reward ratio ka khayal rakhna nuqsaan ko control karne mein madad karta hai.

    Doosre Indicators Ke Sath Milana:
    - Traders amuman resistance analysis ko doosre technical indicators ya chart patterns ke sath mila kar istemal karte hain, taake trades ko kamyaabi ke imkanat barh jayein.

    Resistance levels ko samajhna traders ke liye ahem hai kyun ke isse entry aur exit points ke baare mein malumat hasil hoti hai. Yaad rahe ke koi bhi level market mein mukammal nahi hota, aur traders ko forex trading mein comprehensive faislay ke liye mukhtalif tools aur analysis techniques ka istemal karna chahiye.
    • #3 Collapse

      What is Support and Resistance;


      Dear member Forex exchanging mein Backing or Obstruction bahut significant hote hey. In dono ideas ko samajhne se aap market ke pattern ke exposed mein pata laga sakte hey. Support or Opposition level ko find karne ke liye aapko market ke pattern ko break down karna hoga. Aapko market ki heading ko dissect karke Backing or Obstruction level ke exposed mein research karna hoga. Aapko apni or phir Backing or Opposition level ke exposed mein research karna hoga. Aapko apni exchange ko Backing or Obstruction level ke hisaab se oversee karna hoga. Agar aap apni exchange ko Backing or Obstruction level ke hisaab se oversee karte hey to aapko market mein bahut fayda hoga.The most effective method to Track down Help and Opposition.

      Support or Obstruction;

      Click image for larger version

Name:	12312345656489798.jpg
Views:	23
Size:	19.7 کلوبائٹ
ID:	13053833
      on ko samajhne se aap a matlab hota hey ki wo level jahan se market ne specialty gir kar ruk jata hey. Agar aap exchanging karte hey to aapko support level ko samajhna bahut zaruri hey. Support level ko samajhne se aap market mein passage or leave focuses ka pata laga sakte hey.Direction:Support or Obstruction levels dealers ko decision making mein guide karte hein. Agar cost ek explicit levIn levels ka use pattern affirmation ke liye hota hey. Agar cost ek specific level se break karke ja rahi hey, toh yeh affirm karta hey ke market mein Dear ko find karne ke liye aapko market ke pattern ko break down karna hoga. Aapko market ke pattern ko dissect karke Backing or Opposition level ko find karna hoga. Aapko market ki history or volume ko bhi examine karna hoga.Resistance ka matlab hota hey ki wo level jahan se market ne upar jane se rok diya hey. Agar aap exchanging karte hey to aapko Opposition level ko samajhna bahut zaruri hey. Opposition level ko samajhne se aap market mein passage or leave focuses ka pata laga sakte hey.Support or Obstructipattern hey or brokers apne exchanging techniques ko us pattern ke mutabiq change kar sakte hein.el se break hoti hey, toh merchants apne systems change karte hein.In sab focuses se saaf hota hey ke Backing or Opposition levels market mein kis tarah se significant hote hein, or dealers inko apne exchanging choices ko better illuminate karne ke liye use karte Specialized examiners in levels ko outline designs or other specialized pointers ke saath consolidate karke use karte hein. Yeh ek all encompassing methodology give karte hein market investigation mein

      • #4 Collapse

        What is Support and Resistance;


        Click image for larger version

Name:	download - 2024-07-23T194655.629.jpeg
Views:	15
Size:	12.5 کلوبائٹ
ID:	13053860

        **Support Aur Resistance Kya Hain? Roman Urdu Mein Tafseel**

        **Support** aur **Resistance** trading aur technical analysis mein fundamental concepts hain. Ye concepts market trends aur price movements ko samajhne ke liye use kiye jate hain. Aaiye in concepts ko detail mein samajhte hain:

        ### 1. **Support Kya Hai?**

        **Support** ek price level hai jahan market ki price girti hai aur wahan rok jati hai, yani price ko niche jaane se roknay wala level. Yeh wo level hai jahan buyers (damaanah) ka demand itna zyada hota hai ke price further decline nahi karti. Is level ko support level is liye kehte hain kyunki yeh price ke girne ko support karta hai.

        #### **Support Ki Characteristics**

        - **Demand Zone:** Support level wo zone hota hai jahan buyers ka demand barh jata hai aur sellers ke supply se zyada hota hai. Yeh level price ko niche jane se rokta hai.
        - **Price Reversal:** Jab price support level tak pohnchti hai, to yeh level price ko reverse karne ka kaam karta hai aur bullish trend shuru kar sakta hai.
        - **Historical Significance:** Historical price data ke analysis se pata chalta hai ke price ne is level par previous mein bhi support liya tha.

        #### **Support Ka Analysis**

        - **Horizontal Support:** Isme price ek specific horizontal line ke saath repeatedly support leti hai. Yeh level clear aur prominent hota hai.
        - **Trendline Support:** Trendlines ko chart par draw karke bhi support levels identify kiye jate hain. Trendline support unko indicate karta hai jo ek trend ke saath price ko support karte hain.
        - **Moving Averages:** Moving averages bhi support levels ke tarah kaam kar sakti hain. Short-term moving averages price ko support karte hain jab price moving average ke upar hoti hai.

        #### **Support Ka Trading Strategy**

        - **Entry Point:** Jab price support level par pohnchti hai aur wahan se reverse hoti hai, to buy entry point consider kiya jata hai.
        - **Stop-Loss Placement:** Stop-loss ko support level ke niche place karein taake agar price further decline kare to loss limit ho.
        - **Profit Target:** Profit targets ko previous resistance levels ya nearest resistance zones ke mutabiq set karein.

        ### 2. **Resistance Kya Hai?**

        **Resistance** ek price level hai jahan market ki price upar jane se rok jati hai, yani price ko upar jane se resist karne wala level. Yeh wo level hai jahan sellers ka supply itna zyada hota hai ke price further increase nahi karti. Is level ko resistance level is liye kehte hain kyunki yeh price ke barhne ko resist karta hai.

        #### **Resistance Ki Characteristics**

        - **Supply Zone:** Resistance level wo zone hota hai jahan sellers ka supply barh jata hai aur buyers ke demand se zyada hota hai. Yeh level price ko upar jane se rokta hai.
        - **Price Reversal:** Jab price resistance level tak pohnchti hai, to yeh level price ko reverse karne ka kaam karta hai aur bearish trend shuru kar sakta hai.
        - **Historical Significance:** Historical price data ke analysis se pata chalta hai ke price ne is level par previous mein bhi resistance liya tha.

        #### **Resistance Ka Analysis**

        - **Horizontal Resistance:** Isme price ek specific horizontal line ke saath repeatedly resistance leti hai. Yeh level clear aur prominent hota hai.
        - **Trendline Resistance:** Trendlines ko chart par draw karke bhi resistance levels identify kiye jate hain. Trendline resistance unko indicate karta hai jo ek trend ke saath price ko resist karte hain.
        - **Moving Averages:** Moving averages bhi resistance levels ke tarah kaam kar sakti hain. Short-term moving averages price ko resistance karte hain jab price moving average ke niche hoti hai.

        #### **Resistance Ka Trading Strategy**

        - **Entry Point:** Jab price resistance level par pohnchti hai aur wahan se reverse hoti hai, to sell entry point consider kiya jata hai.
        - **Stop-Loss Placement:** Stop-loss ko resistance level ke upar place karein taake agar price further increase kare to loss limit ho.
        - **Profit Target:** Profit targets ko previous support levels ya nearest support zones ke mutabiq set karein.

        ### 3. **Support Aur Resistance Ke Beech Farq**

        #### **Price Behavior**

        - **Support:** Price support level tak pohnchti hai aur wahan se upar ki taraf move karti hai. Support level price ke girne ko rokta hai.
        - **Resistance:** Price resistance level tak pohnchti hai aur wahan se niche ki taraf move karti hai. Resistance level price ke barhne ko rokta hai.

        #### **Market Sentiment**

        - **Support:** Support level market ke bullish sentiment ko indicate karta hai, jahan buyers zyada active hote hain.
        - **Resistance:** Resistance level market ke bearish sentiment ko indicate karta hai, jahan sellers zyada active hote hain.

        #### **Trading Opportunities**

        - **Support:** Support levels par buying opportunities milti hain jab price support level se reverse hoti hai.
        - **Resistance:** Resistance levels par selling opportunities milti hain jab price resistance level se reverse hoti hai.

        ### 4. **Practical Application**

        #### **Chart Analysis**

        - **Identify Levels:** Charts ko analyze karke support aur resistance levels ko identify karein. Yeh levels historical price data aur trendlines ke zariye identify kiye jate hain.
        - **Volume Analysis:** Volume analysis se confirm karein ke support aur resistance levels strong hain. High volume ke sath levels ka test hona zyada reliable hota hai.

        #### **Risk Management**

        - **Stop-Loss Orders:** Support aur resistance levels ko risk management ke liye use karein. Stop-loss orders ko support ya resistance levels ke aas paas set karein.
        - **Risk-Reward Ratio:** Trade entry aur exit points ko set karte waqt risk-reward ratio ko consider karein.

        ### 5. **Limitations Aur Considerations**

        #### **False Breakouts**

        - **False Signals:** Kabhi kabhi support aur resistance levels false breakouts generate karte hain. Yeh zaroori hai ke additional confirmation indicators aur analysis use ki jayein.

        #### **Dynamic Levels**

        - **Changing Levels:** Support aur resistance levels market conditions ke hisaab se change ho sakte hain. Market trends aur price movements ko regularly monitor karna zaroori hai.

        ### 6. **Conclusion**

        **Support** aur **Resistance** forex trading aur technical analysis ke fundamental concepts hain. Support level wo price level hota hai jahan price girti hai aur wahan rok jati hai, jabke resistance level wo price level hota hai jahan price barhti hai aur wahan resist hoti hai. In levels ko identify karna aur effectively use karna traders ko better trading decisions lene aur market opportunities ko maximize karne mein madad karta hai. Proper analysis aur risk management ke sath support aur resistance levels ko trading strategies mein implement karne se aap apni trading performance ko enhance kar sakte hain.
        • #5 Collapse

          What Is Resistance?

          Resistance ek important concept hai technical analysis mein, jo traders ko market ke trends aur price movements ko samajhne mein madad karta hai. Iska basic idea yeh hai ke resistance ek aisa level hai jahan par price ko upar jane se rok diya jata hai. Yeh ek psychological level bhi hota hai, jahan par sellers ka pressure badh jata hai aur buyers ka pressure kam ho jata hai.

          Resistance Ka Concept
          Resistance ka concept basicly yeh hai ke jab price ek specific level tak pahunchtay hai, to us level par ek selling pressure generate hota hai. Yeh level wo hota hai jahan par buyers ki strength kam hoti hai aur sellers ki strength zyada hoti hai. Is wajah se price upar nahi ja sakti aur ek baar phir se niche aa jati hai. Resistance levels market ke historical data aur price movements ke basis par identify kiye jate hain.

          Resistance Aur Support Ke Beech Ka Farq
          Resistance aur support dono hi key levels hain jo market analysis ke liye use kiye jate hain.

          Support: Support wo level hai jahan price niche aati hai aur buyers ki strength itni hoti hai ke price wahan se wapas upar chalti hai. Yeh level price ko niche jaane se rokta hai.

          Resistance: Resistance wo level hai jahan price upar jati hai lekin ek certain level ke baad sellers ki strength badh jati hai aur price wahan se phir se niche aa jati hai.

          Is tarah, support price ko niche jaane se rokta hai jabke resistance price ko upar jaane se rokta hai.

          Resistance Levels Identify Karne Ke Tariqe
          Resistance levels ko identify karne ke kai tarike hain. Yeh methods traders ko market ki trend aur price movement ko samajhne mein help karte hain.

          Historical Highs: Sabse common method historical highs dekh kar resistance levels identify kiye jate hain. Jab price pichle highs ko test karti hai aur wahan se wapas hoti hai, to yeh level resistance ka indication hota hai.

          Trendlines: Trendlines bhi resistance levels identify karne mein madad karte hain. Jab price ek upward trend ko follow kar rahi hoti hai, to trendline ke upar price ko resistance face karna padta hai.

          Moving Averages: Moving averages, jaise ke 50-day aur 200-day moving averages, bhi resistance levels indicate kar sakte hain. Jab price moving average ko test karti hai aur wahan se wapas hoti hai, to yeh moving average ek resistance level ban sakta hai.

          Technical Indicators: Kuch technical indicators, jaise ke Bollinger Bands aur RSI (Relative Strength Index), bhi resistance levels identify karne mein help karte hain. Bollinger Bands price ke extreme levels ko identify karte hain, aur RSI overbought conditions ko show karta hai, jo resistance indicate kar sakta hai.

          Resistance Ka Role In Market Trends
          Resistance market trends ko samajhne ke liye crucial hota hai. Jab price ek resistance level ko break karti hai, to yeh ek strong bullish signal hota hai, jo indicate karta hai ke buyers market par control gain kar rahe hain.

          Breakout: Agar price resistance level ko successfully break karti hai, to yeh breakout ka signal hota hai. Breakout ke baad price upar ki taraf move karti hai, aur new resistance levels ban sakte hain. Yeh signal hota hai ke market bullish trend mein hai.

          Reversal: Agar price resistance level ko break nahi karti, to yeh reversal ka signal ho sakta hai. Is case mein, price resistance level par reject hoti hai aur phir se niche move karti hai. Yeh market ke bearish trend ki indication ho sakti hai.

          Resistance Aur Market Psychology
          Resistance levels market psychology ka bhi ek part hain. Traders aur investors ke decision-making process mein psychological factors important role play karte hain.

          Psychological Levels: Resistance levels aksar psychological levels par ban jate hain, jaise ke round numbers (e.g., 1.2000 in forex). Traders aur investors in levels ko focus karte hain, jo price movements ko affect karte hain.

          Seller's Pressure: Resistance level par sellers ka pressure badh jata hai, kyunki traders expect karte hain ke price wahan se wapas aayegi. Yeh sellers ki selling activity ko increase kar deta hai, jo resistance ko strengthen karta hai.

          Resistance Aur Risk Management
          Resistance levels risk management ke liye bhi important hain. Traders apni trading strategies aur risk management plans ko resistance levels ke basis par design karte hain.

          Stop-Loss Orders: Resistance levels ke basis par stop-loss orders place kiye ja sakte hain. Agar price resistance level ko break kar deti hai, to traders apni positions ko loss se bachane ke liye stop-loss orders use karte hain.

          Entry Aur Exit Points: Resistance levels traders ko entry aur exit points determine karne mein madad karte hain. Agar price resistance level ko break karti hai, to yeh entry point ho sakta hai. Aur agar price resistance level ko test kar rahi hai, to yeh exit point ka signal ho sakta hai.

          Resistance Ka Practical Example
          Ek practical example se resistance ko samajhna aasan hota hai. Maan lijiye ke aap ek stock ko analyze kar rahe hain, jiska resistance level 100 USD hai. Agar stock price 100 USD tak pahunchti hai aur wahan se wapas girti hai, to yeh 100 USD ek strong resistance level hai.

          Test Aur Re-Test: Agar stock price baar-baar 100 USD ko test karti hai lekin break nahi karti, to yeh confirm ho jata hai ke yeh level strong resistance hai.

          Breakout: Agar stock price 100 USD ko successfully break kar leti hai aur 105 USD tak pahunchti hai, to yeh ek bullish signal hota hai aur new resistance level establish hota hai.

          Conclusion
          Resistance ek fundamental concept hai jo technical analysis aur market trends ko samajhne mein crucial role play karta hai. Yeh level price movements ko influence karta hai aur traders ko market ke dynamics ko better understand karne mein madad karta hai. Resistance levels ko identify karne ke liye historical data, trendlines, moving averages aur technical indicators use kiye jate hain. Market psychology aur risk management bhi resistance levels ke saath closely related hain. Resistance levels ko samajhna aur analyze karna trading strategies aur market decisions ko enhance kar sakta hai.
          • #6 Collapse

            **Resistance Kya Hai?**
            Forex trading aur stock markets mein "resistance" ek important concept hai jo price action aur market trends ko samajhne mein madad karta hai. Resistance ek price level ko refer karta hai jahan ek asset ki price ko upar jaane se rokne ki koshish hoti hai. Yeh level traders aur investors ke liye critical hota hai kyunki yeh price point market ki potential reversals aur trend changes ko indicate karta hai. Is post mein, hum resistance ke concept ko detail se samjhenge aur dekhenge ke yeh forex trading mein kis tarah se use hota hai.

            **Resistance Ka Concept**

            Resistance ek technical analysis term hai jo price charts par ek horizontal level ko denote karta hai jahan price aksar rok jati hai aur wapas gir jati hai. Yeh level market ke participants ke selling pressure ko reflect karta hai aur price ke upward movement ko limit karta hai.

            - **Price Barrier:** Jab asset ki price resistance level ko touch karti hai, toh yeh price level ek barrier ke roop mein kaam karti hai. Is point par, buyers ke comparison mein sellers ka pressure zyada hota hai, jo price ko upar jane se rokta hai.

            - **Historical Data:** Resistance levels ko identify karte waqt historical price data ko analyze kiya jata hai. Agar price pehle bhi is level par ruk chuki hai, toh yeh level future mein bhi ek significant resistance point ho sakta hai.

            **Resistance Aur Support**

            Resistance ko samajhne ke liye support level ko bhi samajhna zaroori hai. Support aur resistance dono market ke critical levels hain jo price movements aur trend reversals ko indicate karte hain.

            - **Support Level:** Support level woh price point hai jahan asset ki price girne ke bawajood ruk jati hai aur wapas increase hoti hai. Yeh level buyers ke buying pressure ko reflect karta hai aur price ko niche jaane se rokta hai.

            - **Resistance Level:** Resistance level woh price point hai jahan asset ki price increase hone ke bawajood ruk jati hai aur wapas girti hai. Yeh level sellers ke selling pressure ko reflect karta hai aur price ko upar jaane se rokta hai.

            **Resistance Ke Types**

            1. **Horizontal Resistance:** Yeh ek fixed price level hota hai jo historical data ke basis par identify kiya jata hai. Yeh level price chart par horizontal line ke roop mein nazar aata hai.

            2. **Trendline Resistance:** Trendline resistance ek sloping resistance level hota hai jo price trends ke saath move karta hai. Yeh trendline chart par ek diagonal line ke roop mein dikhayi jati hai.

            3. **Dynamic Resistance:** Dynamic resistance moving averages aur other technical indicators ke through identify kiya jata hai. Yeh level continuously change hota hai aur price movements ke saath adjust hota hai.

            **Trading Strategy Mein Resistance Ka Role**

            Resistance levels trading strategies ko develop karne mein important role play karte hain. Traders resistance levels ko identify karke entry aur exit points decide karte hain.

            - **Short Selling:** Agar price resistance level ko test kar rahi hai aur wahan se gir rahi hai, toh traders short selling opportunities dekhte hain. Yeh strategy resistance level ke near stop-loss ko set karke potential profits generate karne ke liye use ki jati hai.

            - **Breakout Trading:** Agar price resistance level ko successfully break karti hai, toh traders breakout trading strategy ko adopt karte hain. Yeh strategy upward price movement ke potential profits ko capture karne ke liye use ki jati hai.

            **Conclusion**

            Resistance forex trading aur stock markets mein ek crucial concept hai jo price levels aur market trends ko samajhne mein madad karta hai. Resistance level ek price point hota hai jahan price upward movement ko limit karti hai aur market ke selling pressure ko reflect karti hai. Effective trading strategies ke liye resistance levels ko identify karna aur analyze karna zaroori hai, jisse traders entry aur exit points ko optimize kar sakte hain aur successful trading outcomes achieve kar sakte hain.
            • #7 Collapse

              Resistance Kya Hai?


              Muqaddama

              Forex aur stock trading mein technical analysis ke tools aur concepts ka samajhna zaroori hai taake aap market trends ko accurately predict kar sakein. In tools mein se ek aham concept "Resistance" hai. Ye concept traders ko market ke key levels aur price movements ko analyze karne mein madad deta hai. Is article mein hum resistance ko detail se samjhenge aur iske importance ko explore karenge.

              Resistance Kya Hai?

              Resistance ek aisa price level hai jahan market mein sellers ki supply itni zyada hoti hai ke price us level ko break nahi kar pati. Is level par buyers ki demand kam ho jati hai aur selling pressure barh jata hai, jis wajah se price upar jane se ruk jati hai. Resistance ko aap ek ceiling ke taur par samajh sakte hain jo price ke upar jane ko rokta hai.

              Resistance Ka Identification
              1. Historical Data: Resistance levels ko identify karne ke liye aapko historical price data dekhna padta hai. Agar price baar baar ek specific level tak pahunchti hai aur wahan se girti hai, toh ye level resistance ban jata hai.
              2. Technical Tools: Technical analysis ke tools jaise moving averages, trend lines, aur Fibonacci retracements ko use karke bhi resistance levels identify kiye ja sakte hain. Ye tools market trends aur price movements ko analyze karne mein madadgar hote hain.

              Resistance Ka Importance
              1. Trading Decisions: Resistance levels trading decisions lene mein madadgar hote hain. Agar price resistance level tak pahunchti hai aur wahan se girti hai, toh ye sell signal generate kar sakta hai. Conversely, agar price resistance level ko break kar leti hai, toh ye bullish signal ho sakta hai.
              2. Risk Management: Resistance levels ko risk management ke liye bhi use kiya jata hai. Aap stop loss aur take profit levels ko resistance ke close mein set kar sakte hain, taake aap apne trades ko effectively manage kar sakein.
              3. Market Trends: Resistance levels market trends ko bhi indicate karte hain. Agar price resistance level ko break kar leti hai aur uske upar sustain karti hai, toh ye uptrend ka indication hota hai. Agar price resistance level par fail ho jati hai, toh ye downtrend ka signal ho sakta hai.

              Resistance Aur Support Ka Relation

              Resistance aur support ek doosre ke opposite hote hain. Jahan resistance price ke upar jane ko rokta hai, wahi support price ke neeche girne ko rokta hai. Jab price resistance level ko break kar leti hai, toh ye level future mein support ban sakta hai.

              Conclusion

              Resistance ek critical concept hai jo Forex aur stock trading mein market analysis aur trading decisions ko enhance karne mein madad karta hai. Is concept ko samajhkar aur effectively use karke aap market trends ko better predict kar sakte hain aur apne trading strategies ko optimize kar sakte hain. Har trader ke liye zaroori hai ke wo resistance levels ko identify kare aur apni trading decisions mein incorporate kare.
              • <a href="https://www.instaforex.org/ru/?x=ruforum">InstaForex</a>
              • #8 Collapse

                What Is Resistance?

                Trading aur technical analysis mein, "resistance" aik aisa level hota hai jahan stock ya asset ki price ko rukawat ka samna hota hai aur upar jaane mein mushkil hoti hai. Resistance level pe sellers zyada active ho jate hain aur selling pressure increase ho jata hai, jo price ko aur upar jaane se rokta hai.

                Resistance ka Concept:

                Resistance level aik aisa price point hota hai jahan investors aur traders asset ko bechne ka sochte hain. Ye level aksar isliye important hota hai kyunke is par bohot si sell orders accumulate ho jati hain, jo price ko further upar jaane nahi deti.

                Resistance ko Identify Karna:

                1. Previous Highs:


                Aksar resistance levels previous highs par hoti hain. Agar stock ki price pehle bhi ek specific level par ruki ho aur wahan se neeche ayi ho, to wo level resistance ban jata hai.

                2. Trendlines:

                Ascending ya descending trendlines bhi resistance levels ko identify karne mein madadgar hoti hain. Aik descending trendline jahan price ne pehle upar jaane ki koshish ki ho aur fail hui ho, wo resistance level ban sakti hai.

                3. Moving Averages:

                50-day, 100-day, ya 200-day moving averages bhi aksar resistance ka kaam karti hain. Jab price in averages ke upar jaane ki koshish karti hai aur fail hoti hai, to wo level resistance ban jata hai.

                Resistance ka Importance:

                1. Trading Decisions:


                Resistance levels ko samajh kar traders sahi entry aur exit points decide kar sakte hain. Agar stock resistance level ke qareeb ho, to traders selling ke bare mein soch sakte hain.

                2. Risk Management:

                Resistance levels ko use karke traders apne stop loss aur take profit levels ko set kar sakte hain. Agar stock resistance level ke upar break kare, to traders apne positions ko adjust kar sakte hain.

                3. Market Sentiment:

                Resistance levels market sentiment ko bhi show karte hain. Agar stock multiple times resistance level ko test kare aur break na kar sake, to ye signal hota hai ke market mein selling pressure zyada hai.

                Example:

                Agar aik stock $50 par ruk jaye aur us level ko multiple times test karne ke bawajood break na kar sake, to $50 resistance level ban jata hai. Jab tak stock is level ko convincingly break na kare, isko resistance mana jayega aur selling pressure wahan pe increase hoga.

                Conclusion:

                Resistance levels trading aur technical analysis ka aik essential part hain. Inko identify karna aur samajhna traders ko market trends aur price movements ko forecast karne mein madad karta hai. Proper analysis ke sath resistance levels ko use karke traders apne trading strategies ko enhance kar sakte hain aur better trading decisions le sakte hain.

                اب آن لائن

                Working...
                X