Bearish Inverted Hammer Kia Ha?
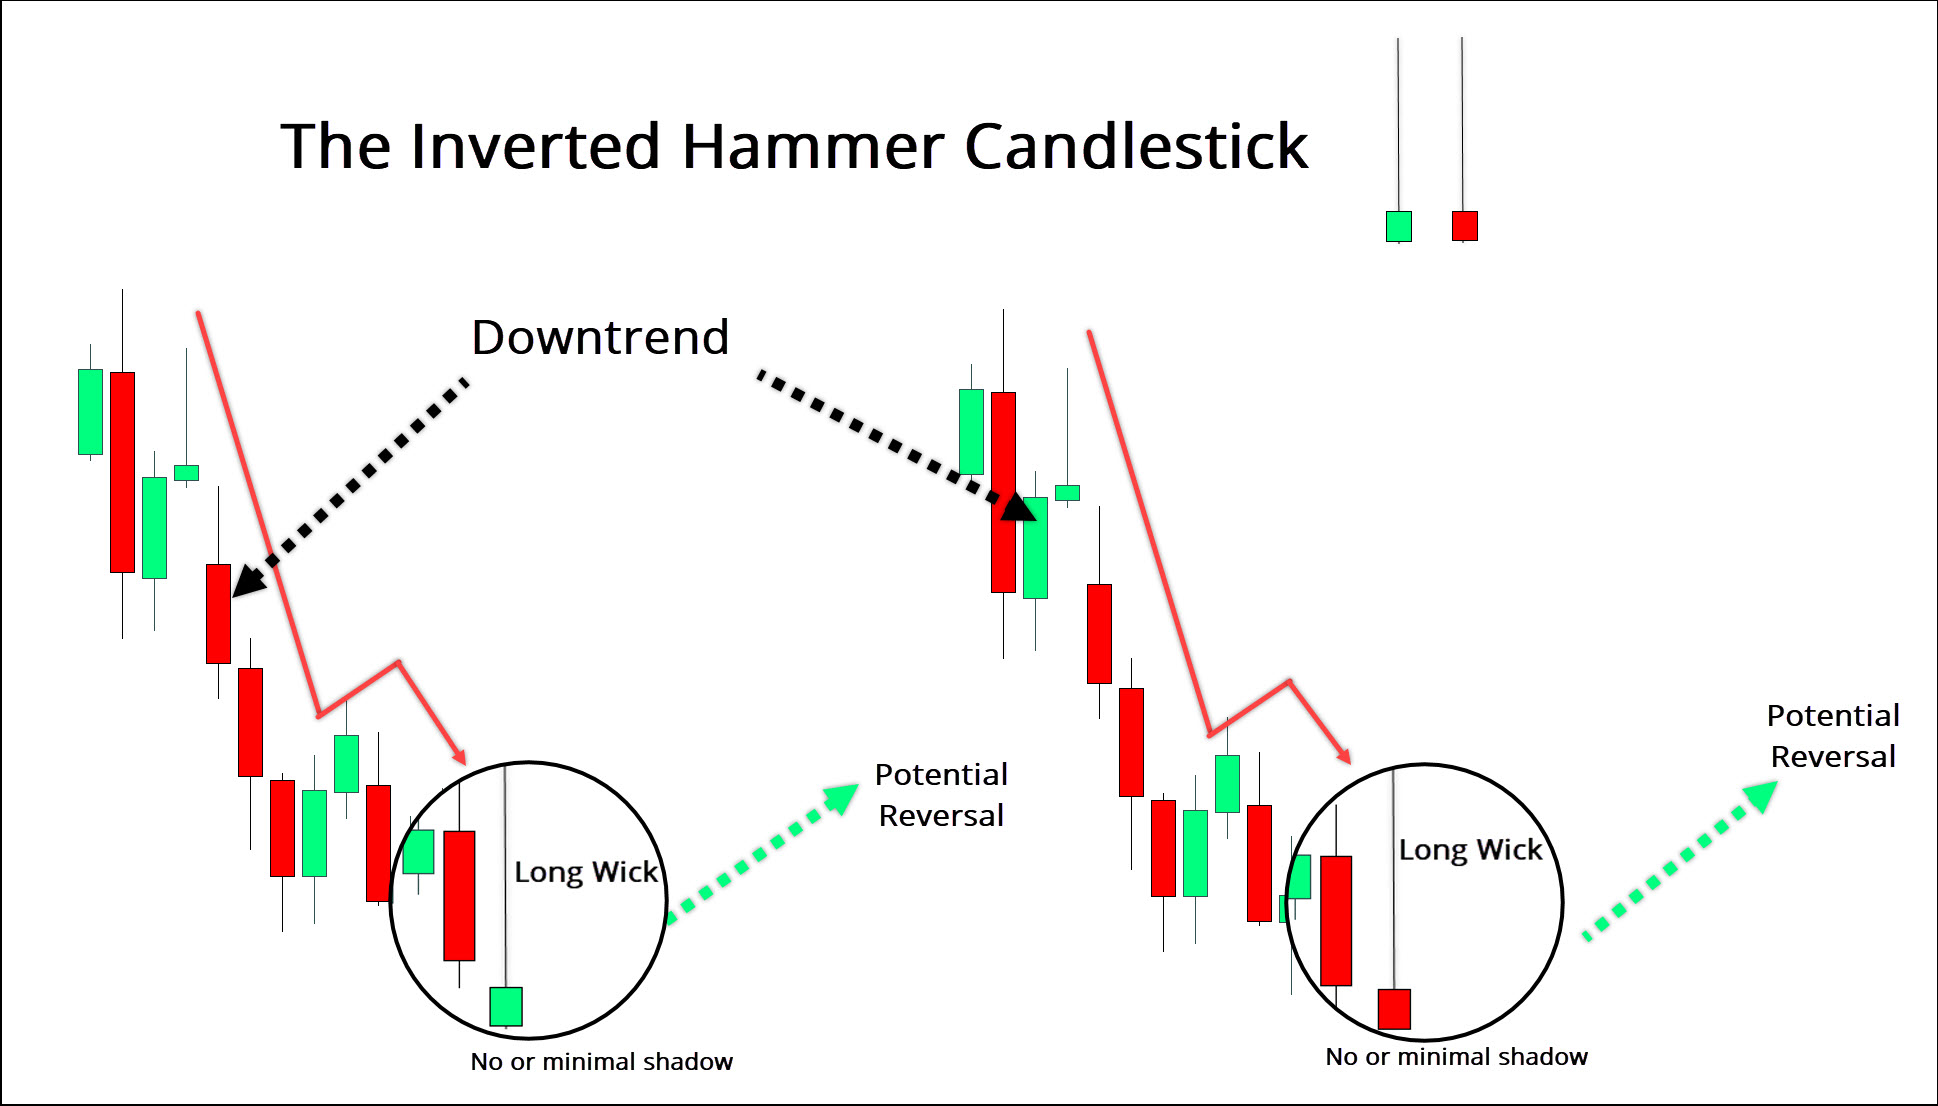
Bearish inverted hammer ek candlestick pattern hai jo technical analysis mein istemaal hota hai. Is mein candlestick ka ooper wala hissa chota hota hai aur lambi upper shadow hoti hai, jabki lower shadow kam ya bilkul nahi hoti hai. Ye pattern ek uptrend ki potential reversal ko indicate karta hai, matlab bearish trend shuru ho sakta hai. Traders bearish inverted hammer ko selling ya bearish position lenay ka signal samajhte hain. Lekin yaad rakhein ke sirf ek candlestick pattern par rely karna trading decisions ke liye theek nahi hai. Confirmations ke liye dusre technical indicators aur analysis techniques ka istemaal karna zaroori hai.

Bearish Inverted Hammer Calculation:
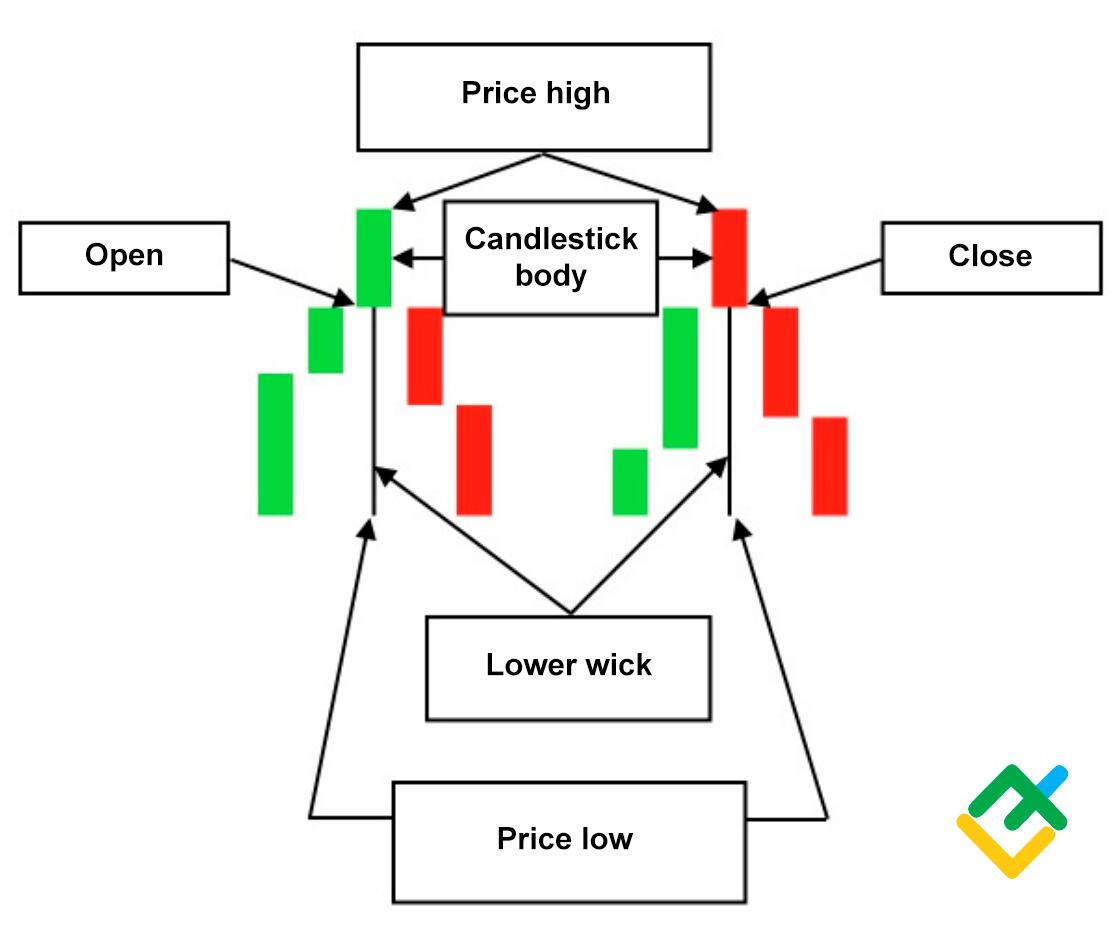
Bearish inverted hammer ka calculation karna specific mathematical formulas ya calculations se nahi hota hai. Yeh ek visual pattern hai jo price chart par dekha jata hai. Is pattern ko candlestick ke open, high, low, aur close prices ke basis par form kiya jata hai.
Bearish Inverted Hammer Identify:
Bearish inverted hammer ko pehchanne ke liye, aapko price action or candlestick formation ko analyze karna hoga. Yahaan kuch steps hain bearish inverted hammer ko recognize karne ke liye.
1. Ek candlestick search kreyn jismein ek chhota body ho jo candlestick ke upar wale hisse mein ho.
2. Note karo ki upper shadow (high) body se kaafi lambi honi chahiye.
3. Check karo ki lower shadow (low) kam ya bilkul na ho.
4. Confirm karo ki body red ya filled hai jisse bearish sentiment indicate hoti hai.
Bearish Inverted Hammer Example:

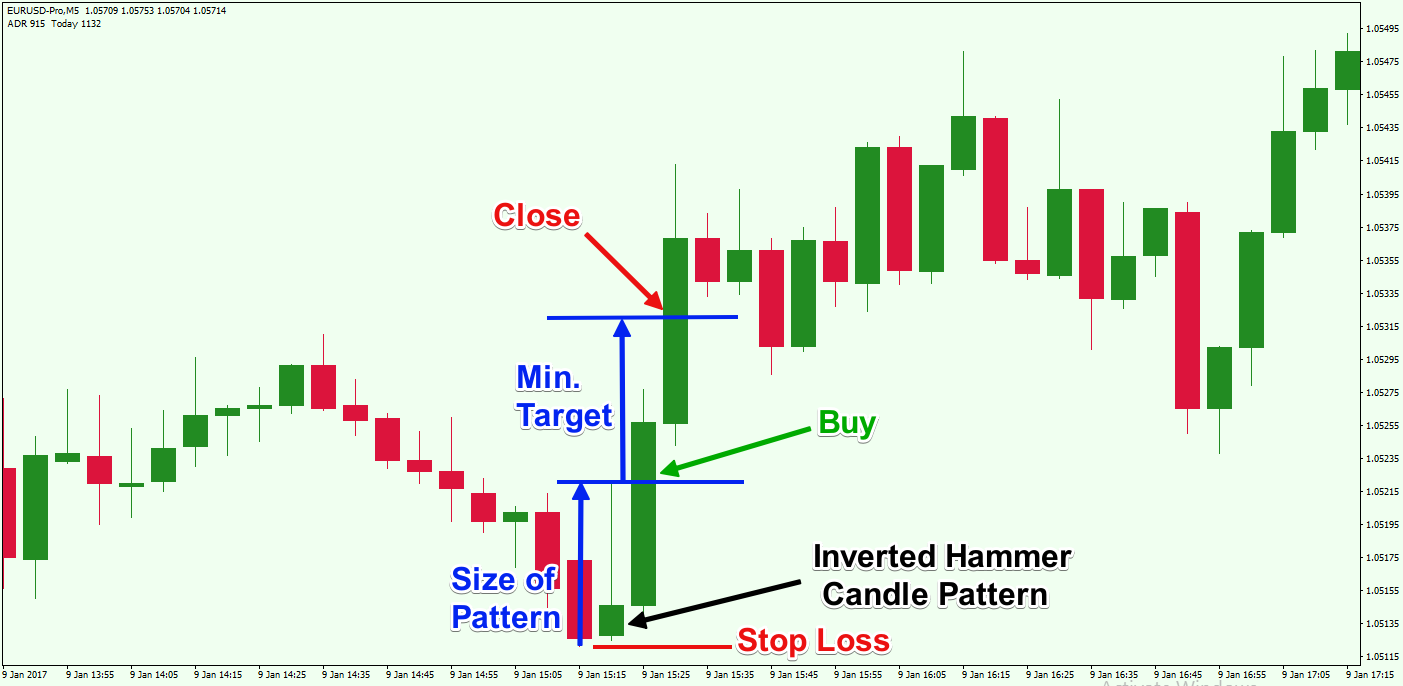
bearish inverted hammer ka ek example ha. Kay yeh hota hai jab ek candlestick chart par ek lambi upper shadow aur chota ooper wala hissa ho, jabki lower shadow kam ya bilkul nahi ho. Yeh pattern ek uptrend ke baad dikhta hai aur bearish trend ki shuruat ka indication deta hai.
Bearish inverted hammer ek candlestick pattern hai jo technical analysis mein istemaal hota hai. Is mein candlestick ka ooper wala hissa chota hota hai aur lambi upper shadow hoti hai, jabki lower shadow kam ya bilkul nahi hoti hai. Ye pattern ek uptrend ki potential reversal ko indicate karta hai, matlab bearish trend shuru ho sakta hai. Traders bearish inverted hammer ko selling ya bearish position lenay ka signal samajhte hain. Lekin yaad rakhein ke sirf ek candlestick pattern par rely karna trading decisions ke liye theek nahi hai. Confirmations ke liye dusre technical indicators aur analysis techniques ka istemaal karna zaroori hai.
Bearish Inverted Hammer Calculation:
Bearish inverted hammer ka calculation karna specific mathematical formulas ya calculations se nahi hota hai. Yeh ek visual pattern hai jo price chart par dekha jata hai. Is pattern ko candlestick ke open, high, low, aur close prices ke basis par form kiya jata hai.
Bearish Inverted Hammer Identify:
Bearish inverted hammer ko pehchanne ke liye, aapko price action or candlestick formation ko analyze karna hoga. Yahaan kuch steps hain bearish inverted hammer ko recognize karne ke liye.
1. Ek candlestick search kreyn jismein ek chhota body ho jo candlestick ke upar wale hisse mein ho.
2. Note karo ki upper shadow (high) body se kaafi lambi honi chahiye.
3. Check karo ki lower shadow (low) kam ya bilkul na ho.
4. Confirm karo ki body red ya filled hai jisse bearish sentiment indicate hoti hai.
Bearish Inverted Hammer Example:
bearish inverted hammer ka ek example ha. Kay yeh hota hai jab ek candlestick chart par ek lambi upper shadow aur chota ooper wala hissa ho, jabki lower shadow kam ya bilkul nahi ho. Yeh pattern ek uptrend ke baad dikhta hai aur bearish trend ki shuruat ka indication deta hai.


تبصرہ
Расширенный режим Обычный режим