Cup and handle candlestick pattern
X
  • وقت
  • دکھائیں
Clear All
new posts
  • #1 Collapse

    Cup and handle candlestick pattern
    Cup and Handle" candlestick pattern, forex trading mein ek bullish continuation pattern hai jo market trends ke context mein price movements ko represent karta hai. Yeh pattern cup aur handle ke formation se juda hota hai, aur jab market mein uptrend ke baad price ka temporary consolidation hota hai, toh cup and handle pattern ka formation hota hai.
    Cup and Handle Pattern Kya Hota Hai?

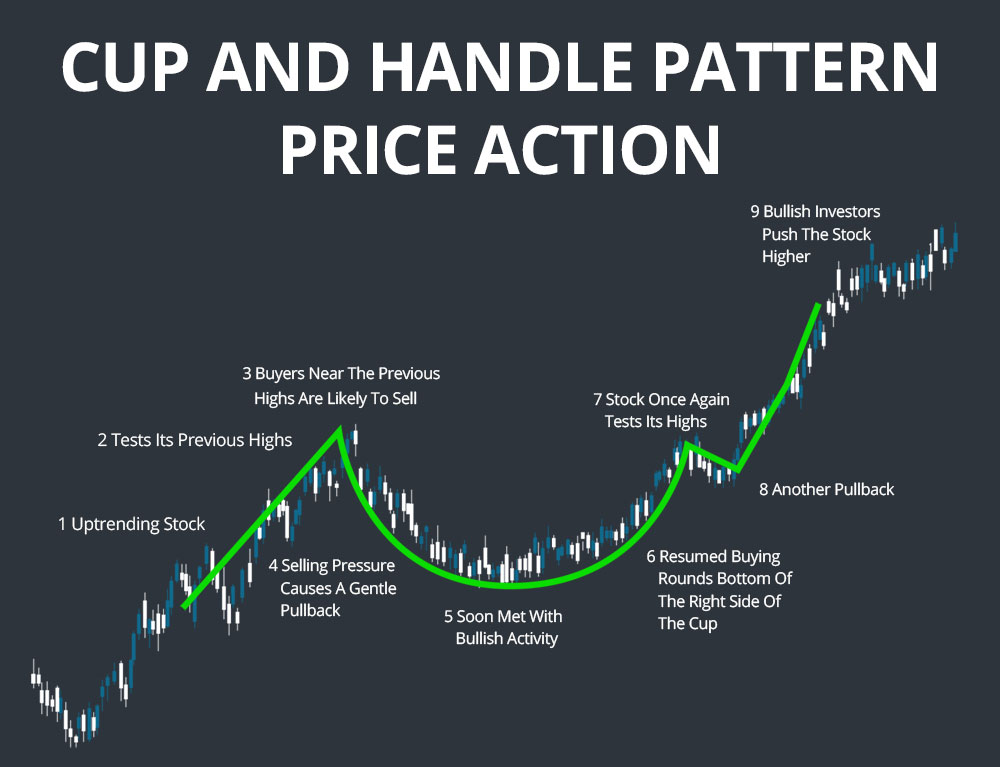
    Cup Formation (Cup Banane Ka Phase):

    Cup and Handle pattern ka pehla phase "Cup Formation" hota hai. Is phase mein price mein gradual decline hota hai, jisse ek "U" shape ki formation banti hai, jise "cup" kehte hain.
    Cup formation ke doran volume kam ho sakta hai, indicating ke market mein consolidation ho rahi hai.
    Handle Formation (Handle Banane Ka Phase):

    Cup banane ke baad aata hai "Handle Formation" ka phase. Is phase mein price mein ek downward move hota hai, lekin generally cup formation ke height tak neeche nahi jaata.
    Handle formation ke doran volume increase ho sakta hai, indicating ke market mein interest badh raha hai.
    Cup and Handle Pattern Ki Key Characteristics:

    Cup Shape:

    Cup formation mein price ka gradual decline hota hai, creating a rounded "U" shape.
    Cup shape ke sides smooth aur symmetric hote hain.
    Handle Shape:

    Handle formation mein price mein ek slight downward move hota hai, lekin overall trend ke context mein rehta hai.
    Handle shape ke sides bhi smooth hote hain aur handle cup ke center se neeche nahi jaata.
    Cup and Handle Pattern Ka Interpretation:

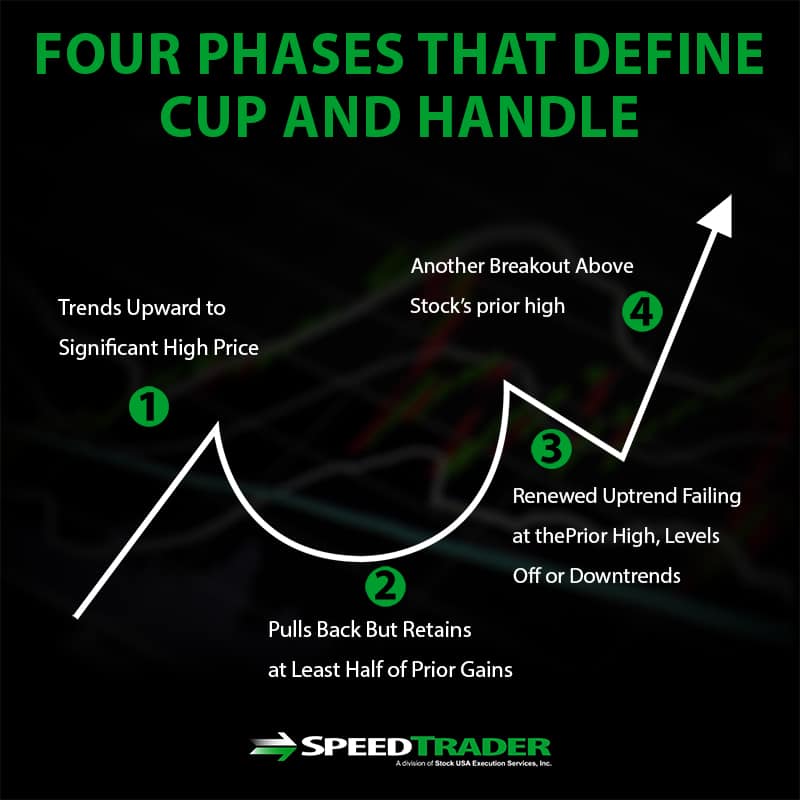
    Bullish Continuation Signal:

    Cup and Handle pattern market mein uptrend ke continuation ko darust karta hai.
    Handle ke baad breakout hone par bullish trend confirm hota hai.
    Volume Analysis:

    Pattern ke breakout ke samay volume analysis important hai. Agar breakout volume ke saath hota hai, toh pattern ka reliability badh jata hai.
    Cup and Handle Pattern Ka Trading Strategy:

    Entry Points:

    Traders cup and handle pattern ke breakout ke baad entry points tay karte hain. Agar price handle ke neeche se upar jaata hai, toh traders long positions le sakte hain.
    Stop-Loss and Take-Profit Levels:

    Stop-loss orders ko strategically place karna important hai taki traders apne positions ko protect kar sakein.
    Take-profit levels ko pattern ke height ya resistance levels ko consider karke tay kiya ja sakta hai.
    Cup and Handle Pattern Ka Dhyan Rakhein:

    Time Frame:

    Cup and handle pattern analysis time frame par depend karta hai. Different time frames par pattern ko confirm karna zaroori hai.
    Market Conditions:

    Overall market conditions ko dhyan mein rakhna important hai. Agar market choppy hai ya range-bound hai, toh pattern ka impact kam ho sakta hai.

    Click image for larger version

Name:	download (17).png
Views:	51
Size:	6.4 کلوبائٹ
ID:	12789030
    Conclusion:

    Cup and Handle pattern, forex trading mein bullish continuation points ko identify karne mein madad karta hai. Iska sahi istemal karke, traders apne trading decisions ko refine kar sakte hain. Hamesha dhyan rahe ke ek single pattern par bharosa karke trading decisions lene se pehle, market context, confirmatory indicators, aur risk management ko bhi madde nazar rakha jaye.


  • <a href="https://www.instaforex.org/ru/?x=ruforum">InstaForex</a>
  • #2 Collapse

    Cup and handle candlestick pattern


    Click image for larger version

Name:	c.png
Views:	47
Size:	46.1 کلوبائٹ
ID:	12789038


    Cup and Handle Candlestick pattern ek technical analysis tool hai jo ke financial markets mein istemal hota hai, khaas karke stock market mein. Yeh pattern ek specific price movement ko represent karta hai aur traders ko future price trends ka andaza lagane mein madad karta hai.

    Cup and Handle Pattern Ki Appearance:

    Cup and Handle pattern ka naam iske appearance se liya gaya hai. Is pattern mein do main parts hote hain: cup aur handle. Cup market mein ek round bottom ko darust karta hai, jabke handle ek chota sa consolidation period hota hai jo cup ke baad ati hai.
    1. Cup (Round Bottom): Cup ek rounded shape ka hota hai jise cup kehte hain. Is phase mein prices initially downtrend mein hoti hain, lekin phir gradual taur par upar ki taraf mud jaati hain, ek saucer ya cup ki tarah dikhai deti hain.
    2. Handle: Cup ke baad aata hai handle, jo ek choti si price consolidation ko represent karta hai. Handle mein prices phir se thoda sa neeche ja sakti hain lekin overall trend upar ki taraf rehta hai.

    Characteristics of Cup and Handle Pattern:
    1. Volume: Cup and handle pattern ke formation mein volume ka role important hota hai. Cup banne mein volume barh sakti hai, lekin handle ke doran volume thoda kam ho sakta hai.
    2. Duration: Cup and handle pattern banne mein thora waqt lag sakta hai. Cup ka formation handle ke formation se zyada waqt le sakta hai.
    3. Breakout: Traders cup and handle pattern ko dekhte hain jab price handle ke end mein upar ki taraf move karti hai, isse breakout kehte hain. Agar breakout strong hota hai, toh traders ko ye indication milti hai ke future mein prices mein upar ka movement hone wala hai.

    Cup and Handle pattern ko samajh kar traders apne trading decisions banate hain. Agar ye pattern sahi taur par identify hota hai aur breakout strong hota hai, toh traders isse future price movements ka andaza lagakar profitable trades kar sakte hain.
    • #3 Collapse

      Cup and handle candlestick pattern


      Click image for larger version

Name:	sn.png
Views:	42
Size:	67.1 کلوبائٹ
ID:	12789040


      "Cup and Handle" candlestick pattern ek aham tijarati chart pattern hai jo technical analysis mein istemal hota hai, aur yeh traders ko market ke future movements ke bare mein malumat farahem karne mein madad karta hai. Is pattern ka naam iske shape se liya gaya hai, jise ek cup aur handle ki tarah dekha ja sakta hai.


      Appearance:


      Cup and handle pattern do main hisson se milti hai:
      1. Cup: Pehla hissa ek curve ya semicircle ki tarah hota hai, jo ke market mein ek downtrend ko darust karta hai. Isme prices mein aahista aahista girawat hoti hai, jise ek cup ya katori ki tarah imagine kiya ja sakta hai.
      2. Handle: Dusra hissa ek chhota rectangle ya downward-sloping trend hota hai, jo ke cup ke upar hota hai. Handle market mein thora sa correction ko darust karta hai, lekin generally, iska level cup ke neeche rehta hai.

      Characteristics:
      1. Volume Analysis: Cup and handle pattern ke breakout mein volume ka bhi tafteesh hota hai. Breakout ke samay, agar volume tez hota hai, toh yeh signal ko aur bhi majboot banata hai.
      2. Timeframe: Cup and handle pattern banane mein kuch hafton ya mahinon ka waqt lag sakta hai. Is pattern ko samajhne aur pehchanne ke liye patience ki zarurat hoti hai.

      Interpretation:
      1. Bullish Reversal Signal: Cup and handle pattern ko aksar ek bullish reversal signal ke roop mein dekha jata hai. Yeh pattern market mein girawat ke baad se upar ki taraf hone ka ishara karta hai.
      2. Breakout Confirmation: Actual trading decision ke liye traders cup and handle ke breakout ka wait karte hain. Agar price handle ke upar chali jati hai, toh yeh breakout ko confirm karta hai.

      Trading Strategy:
      1. Entry Point: Traders generally apne positions ko handle ke breakout ke baad enter karte hain.
      2. Stop-Loss: Risk management ke liye, traders apne positions ke liye ek stop-loss level set karte hain, jise agar market opposite direction mein move karta hai, toh loss ko minimize kiya ja sake.

      Cup and handle pattern ek powerful tool ho sakta hai, lekin yeh hamesha 100% guarantee nahi deta. Isliye, har trading decision ko thorough analysis aur risk management ke saath lena chahiye.
      • #4 Collapse

        Cup and Handle candlestick pattern:

        Cup and handle pattern ek chart pattern hai jo bullish movement ko indicate karta hai. Isme price pehle upar jaata hai, phir ek hissa previous uptrend ka correct karta hai, phir wapas previous high ki taraf rebound karta hai, jisse "cup" banta hai. Phir price sideways trade karta hai, "handle" banate hue, jiska pura hone par breakout new highs ki taraf signal karta hai. Cup and handle indicator ek technical pattern hai jo crypto price charts par paya jata hai. Isse previous uptrend ki correction aur uski phirse shuruvaat signal hoti hai. Pattern mein entry aur risk levels clearly defined hote hain lekin crypto markets mein fragmented volume metrics ki wajah se iska interpretation mushkil ho sakta hai.

        Click image for larger version

Name:	cup_and_handle pattern.jpeg
Views:	41
Size:	38.1 کلوبائٹ
ID:	12789045

        Trade with cup and Handle pattern :

        Cup and handle pattern ke saath trade karne ke liye aap kuch steps follow kar sakte hain:

        1. Pattern ki identification:

        Sabse pehle, aapko cup and handle pattern ko identify karna hoga. Iske liye aap price charts ko analyze kar sakte hain aur is pattern ki formation ko dhundh sakte hain.

        2. Entry point ke liye wait karen:

        Jab aap cup and handle pattern ko identify kar lete hain, tab aapko entry point ke liye wait karna chahiye. Entry point usually handle ke breakout ke baad hota hai, jab price new highs ko touch karta hai.

        3. Stop loss aur target levels set karen:

        Trade ke liye stop loss aur target levels set karna bahut zaruri hai. Stop loss aapko protect karta hai agar trade opposite direction mein move karta hai. Target level aapko profit booking ke liye help karta hai.

        4. Risk management ka dhyan rakhen:

        Har trade mein risk management ka dhyan rakhna bahut zaruri hai. Apne risk tolerance ke hisaab se position size aur leverage ko set karen.

        5. Trend aur other indicators ka analysis karen:

        Cup and handle pattern ke saath trade karte waqt, trend aur other indicators ka bhi analysis karna zaruri hai. Isse aapko confirmation aur additional signals mil sakte hain.

        6. Practice aur experience gain karen:

        Cup and handle pattern ke saath trade karna practice aur experience maangta hai. Regularly practice karen, market ko observe karen aur apne trading skills ko improve karen.

        Yeh steps aapko cup and handle pattern ke saath trade karne mein help karenge. Lekin hamesha yaad rakhen ki trading mein risk hota hai, isliye apne financial goals aur risk tolerance ko samajhkar hi trade karen.

        Characteristics of cup and handle pattern :

        Cup and handle pattern ke characteristics niche diye gaye hain:

        1. Cup:

        Cup and handle pattern mein pehle "cup" banata hai, jisme price pehle upar jaata hai aur fir ek hissa previous uptrend ka correct karta hai. Cup ki shape generally rounded hoti hai, jisse ek cup jaisa appearance ban jata hai.

        2. Handle:

        Cup ke baad "handle" banata hai, jisme price sideways trade karta hai. Handle usually cup ke neeche hota hai aur price ka consolidation phase hota hai. Handle ki shape generally downward sloping hoti hai.

        3. Breakout:

        Handle ke completion ke baad, breakout hota hai. Breakout ka matlab hota hai ki price handle ke upper side se bahar nikal kar previous high ko touch karta hai. Breakout ke baad price mein bullish movement dekha ja sakta hai.

        4. Volume:

        Cup and handle pattern ke formation ke dauran volume analysis bhi important hoti hai. Generally, handle formation ke dauran volume kam hota hai aur breakout ke samay volume increase hota hai. High volume breakout pattern ko confirm karta hai.
        Last edited by ; 09-12-2023, 09:32 AM.
        • #5 Collapse

          Cup aur Handle Candlestick Pattern: Ek Taqatwar Technical Analysis Tool

          Candlestick patterns ek aham hissa hain jab hum stock market ya anya financial markets ka technical analysis karte hain. In patterns mein se aik popular aur tezi se istemal hone wala pattern hai, "Cup aur Handle." Yeh pattern traders aur investors ke darmiyan hone wale trends ko samajhne mein madad karta hai.Click image for larger version

Name:	cup-and-handle-pattern-how-to-verify-and-use-efficiently.jpg
Views:	39
Size:	91.9 کلوبائٹ
ID:	12789048

          Cup aur Handle Kya Hai?

          "Cup aur Handle" ek specific type ka chart pattern hai jo market mein trend reversal ya trend continuation ko darust karnay mein madad karta hai. Iska naam isliye hai kyunki iski formation ek chamakti hui cup jaise lagti hai, jiska neechaek chhota sa "handle" hota hai.

          Cup Formation:

          Cup formation market mein ek down trend ke baad aati hai. Isme price initially girta hai, phir stabilize hota hai aur phir dheere dheere wapas upar chala jata hai. Jab yeh movement hota hai, toh chart ek cup ki tarah dikhai deta hai. Is "cup" ki shape saaf hoti hai, jisme price pehle gir rahi hoti hai aur phir gradual taur par upar chadh rahi hoti hai.

          Handle Formation:

          Jab cup complete ho jata hai, toh ek chhota sa down movement hota hai, jise hum "handle" kehte hain. Handle usually kam trading volume ke saath hota hai. Is phase mein price thoda neeche ja sakta hai, lekin overall trend positive rehta hai.

          Kyun Hai Yeh Important?

          Cup aur Handle pattern ka istemal traders aur investors is liye karte hain kyunki yeh ek potential trend reversal ya trend continuation ko signal karta hai. Agar yeh pattern sahi taur par form ho raha hai, toh traders ise ek buying opportunity samajh sakte hain.

          Trading Strategy:

          Cup aur Handle pattern dekh kar traders apne trading strategy ko tajwez dete hain. Agar pattern sahi taur par dikhai de raha hai aur confirmatory signals bhi mil rahe hain, toh traders long positions le sakte hain. Handle ke baad hone wala upar ki taraf ka movement, agar volume ke saath ho, toh yeh ek strong buy signal bhi ho sakta hai.

          Hoshiyarana Nigrani:

          Hamesha yaad rakhein ke har ek technical analysis tool ki tarah, Cup aur Handle bhi 100% perfect nahi hota. Market mein hamesha risk hota hai aur isliye yeh zaroori hai ke aap apni research ko mazboot taur par karein aur doosre confirming indicators ka bhi istemal karein.

          In conclusion, Cup aur Handle candlestick pattern ek powerful tool hai jo traders ko market trends ko samajhne mein madad karta hai. Yeh ek visual representation hai jise dekh kar traders apni trading decisions ko refine kar sakte hain, lekin hamesha hoshiyarana approach rakhein aur risk management ka khayal rakhein.

          • #6 Collapse


            CUP AND HANDLE CANDLESTICK PATTERN DEFINITION

            Cup and handle candlestick pattern Ek technical analysis ka indicator hai Jo is time Hota Hai Jab Kisi asset ki price ka chart horizontal line ke sath u shape se resemble Hai generally tea cup Ki Tarah down Trend yah Ek bullish ka continuation hai Jiska mean hai ki pattern complete hone ke bad yah usually price Mein increase ki taraf indicate karta hai cup and handle candlestick pattern ka istemal karte hue successful trades ke liye pattern ki correctly Mein identify karna logical entry point per asset Buying karna risk ke management ke liye stop loss set karna and profit able trade se exiting ke liye price kya target Hasil karna zaruri hota hai


            ENTERING A CUP AND HANDLE TRAD

            Price ki level ke alava kuch trader cup and handle pattern Ke Bad trade Mein entering hone se pahle asset Mein trading volume ko bhi dekhte hain higer volume Ne indicate Kiya Hai ke more investor is asset ko buying rahe hain and zyada demand future near main higher price ka bais Ban sakti hai aapane cup and handle ke pattern ki identified Kar Li Hai but trade Mein jump Se Pahle aapko handle ke completely banne Ka vate Karna chahie handle aksar sideway descending channel pattern ki form akhtiyar karta hai Jab price handle se bahar Ho Jaati Hai to pattern ko complete consider jata hai and price Mein rise ki expected ki Jaati Hai


            PROTECT YOUR TRADE WITH A STOP LOSS

            Handle ke sabse lowest point se below Ek Stop loss Rakhe Ek price handle ke andar Kai bar up and down hoti hai to Ek Stop loss ko bhi recent swing ke Low Rakha Ja sakta hai cup and handle formation se break out kharidne ke bad stop loss order Ek trader ko trade se bahar kar deta hai Agar price barhane ke instead Gir jaati hai agar price pattern ko invalidate karne ke liye enough decline ho jaaye to stop loss position selling trade par risk ko control karta hai
            • #7 Collapse

              It seems there might be a slight confusion in your terminology. The "Cup and Handle" pattern is a classic chart pattern used in technical analysis, especially in the context of stock market trading. However, it is not a candlestick pattern; rather, it is a pattern formed by the price movement on a price chart.

              The Cup and Handle pattern typically consists of two parts:

              Cup Formation:

              This is a rounded bottom that resembles the shape of a tea cup. It is formed when the price moves downward, then makes a rounded turn and starts moving upward.

              Handle Formation:

              Following the cup, there is a consolidation or a slight retracement in the price forming a handle-like structure, which is typically a smaller downward price movement.

              The pattern is considered bullish, and traders often look for a breakout to the upside after the handle formation. It's essential to note that not all cup and handle patterns result in a bullish breakout, and traders often use other technical indicators or confirmatory signals to make more informed decisions.

              On the other hand, candlestick patterns refer specifically to the shapes formed by candlesticks on a price chart. Examples of candlestick patterns include Doji, Hammer, Shooting Star, and Engulfing patterns. Each of these patterns provides insight into potential market reversals or continuations based on the price action during a specific time period.When traders refer to trading the Cup and Handle pattern, they are looking at the overall structure formed by the price movement on a chart. Here's a simplified guide to trading the Cup and Handle pattern:

              Identify the Cup: Look for a rounded bottom formation in the price chart, resembling the shape of a tea cup. This indicates a potential reversal from a downtrend to an uptrend.

              Identify the Handle: After the cup formation, there is often a consolidation or a slight retracement in the price, forming a handle. This part is typically smaller in size compared to the cup.

              Entry Point: Traders often look for an entry point after the handle formation. The entry is usually just above the resistance level formed by the top of the cup. This is because a breakout above this level is considered a bullish signal.

              Stop-Loss: Place a stop-loss order below the low of the handle. This is to protect against potential reversals or failed breakouts.

              Target Price: Calculate a target price by measuring the height of the cup from the bottom to the top. This distance is then added to the breakout point.

              It's important to note that no trading strategy is foolproof, and false breakouts can occur. Therefore, traders often use additional technical analysis tools and indicators to confirm signals and manage risks.
              • #8 Collapse

                Cup and handle candlestick pattern


                Click image for larger version

Name:	download (5).png
Views:	48
Size:	11.4 کلوبائٹ
ID:	12789138


                Cup aur Handle Candlestick Pattern:

                Cup aur Handle candlestick pattern ek technical analysis pattern hai jo market mein trend reversal ko darust karnay mein madad karti hai. Yeh pattern ek cup aur handle jaise structure ko represent karta hai, jo traders ko indicate karta hai ke market mein bullish reversal hone ke chances hain.

                2. Cup (Chai Ka Cup):

                Cup (چائے کا کپ):

                Pehla hissa pattern ka "Cup" hota hai, jo market mein pehle downtrend ko darust karnay ki koshish karta hai. Is stage mein prices ne neeche ki taraf ja kar ek rounded bottom banaya hota hai, jise "Cup" kehte hain. Yeh bottom normaly smooth aur rounded hota hai, aur volume kam hota hai.

                3. Handle (Haath ka Hissa):

                Handle (ہاتھ کا حصہ):

                Dusra hissa pattern ka "Handle" hota hai, jo Cup ke upar banaya jata hai. Is stage mein prices mein thori si girawat hoti hai lekin overall trend upar ki taraf rehta hai. Handle straight ya slightly downward sloping hota hai aur volume mein girawat hoti hai. Yeh phase market mein consolidation aur traders ki tayyari ko darust karnay ka waqt hota hai.

                4. Breakout (Tutao):

                Breakout (تُوتاؤ):

                Jab handle ka construction mukammal hota hai, aur prices ek specific resistance level ko cross karti hain, to yeh "Breakout" stage kehlata hai. Breakout ka matlab hai ke market ab bullish trend mein ja sakta hai. Traders ko is stage par entry karnay ka mauka milta hai.

                5. Trading Strategy (Trading Tadbeer):

                Trading Strategy (ٹریڈنگ تدبیر):

                Traders is pattern ko dekh kar samajh saktay hain ke market mein bullish reversal hone ke chances hain. Entry point handle ke breakout ke baad hota hai, aur stop-loss order ko set karna important hai taki nuksan se bacha ja sake. Profit target ko bhi set karna zaroori hai.

                Cup aur Handle candlestick pattern ek powerful tool hai jo traders ko market trends ko samajhnay mein madad karta hai. Lekin hamesha yaad rahe ke kisi bhi pattern ki success 100% nahi hoti, is liye risk management ko hamesha priority dein.

                • #9 Collapse

                  Cup aur Handle candlestick pattern

                  Assalamualaikum! Umeed hai k ap sb khariyat sy hongy. R apky trading sessions achy jaa rhy hongy. Aj ka hmra discussion topic "Cup aur Handle candlesti".
                  Dekhty hain k ye hmein Kya information deta hai r hmry ilam Mai Kesy ezafa krta hai.

                  Cup aur Handle candlestick pattern
                  Cup and handle candlestick pattern forex trading aur dusre maaliyat market mein potential bullish trend reversals ya continuations pehchaan ne ke liye istemal hone wala aik maqbool technical analysis pattern hai. Ye pattern traders ko apni trading strategies aur entry/exit points ke baare mein malumati fayslay karne ke liye istemal hota hai. Cup and handle pattern ka shape ek mukhtalif taur par hota hai, jo aik chai ka cup handle ke saath yaad dilaata hai. Is pattern mein teen mukhya hisse hote hain: cup, handle, aur breakout.

                  Explanation
                  Cup: Hello dear buddies Cup and handle pattern ka pehla hisa khud cup hota hai. Is hise mein market mein ek lambe uptrend ya bullish movement ke baad cup banta hai. Is daur mein qeemat dheere-dheere kam hoti hai, jis se aik gol aur hadood se U shakl wali curve banti hai. Is gol shakl ki is daur mein qeemat mein temporary taur pe kami hoti hai, jise aam taur par munafa hasil karne ya market ki hamayatiyat ke sabab hoti hai. Is tawazun ki muddat aur gehrai tafreeq se mukhtalif ho sakti hai, aur is hisse ko sahi tarah se pehchaanne ke liye tareekhi qeemat data ka jaanch karna ahem hai. Handle: Cup formation mukammal hone ke baad, market ek consolidation daur mein dakhil hota hai jismein qeemat mein thori kami hoti hai. Is choti kamzor tashweesh ki wajah se handle kehte hain. Handle is baat se mutasir hota hai ke qeemat mein mazeed qami hoti hai, jisse aik chota U-shape ya zara neeche ki taraf jhukaav wali movement ban jati hai. Handle qeemat ke zyada hisse ko wapas le jaane ki koshish karta hai, lekin iski gehrai cup ki upward movement ki kam se kam 50% ko wapas nahi leni chahiye. Is hisse ka matlab hai ke market ek thori der ke liye dam ghutne ke baad apni upar ki taraf rukhsat hone wala hai. Breakout: Breakout cup and handle pattern ka akhri hisa hota hai aur traders ke liye aksar sab se dilchasp hota hai. Jab handle formation mukammal hojata hai, to qeemat ko oopar ki taraf bharne ki tawaqo hoti hai, jisse bullish trend ki taqat ki tasdeeq hoti hai. Breakout tab hota hai jab qeemat handle formation ke upper resistance level ko paar kar leti hai. Iska matlab hai ke consolidation period mukammal ho chuki hai aur kharidne walon
                  ko market pe dobara qabza mil raha hai. Traders aksar breakout ke sath mazboot volume ki taraf dekhte hain, kyunke is se pattern ki darust

                  Trading strategies
                  Cup and handle pattern ko mainly bullish continuation ya reversal pattern ke tor par istemal kya jata hai. Traders jo is pattern ko pehchante hain, wo tawaqao rakht hain ke consolidation period ke baad upar ki taraf tawanai dobara shuru hogi. Is pattern ko trade karte waqt kuch ahem cheezen zehan mein rakhni chahiye: 1. Tasdeeq: Pattern ki tasdeeq ke liye breakout ka intezar karna intehai ahem hai. Agar breakout nazar andaz kiya jaye to nuqsan ho sakta hai agar breakout waqai mein nazar nahi aata. 2. Volume: Volume breakout ki taqat ke bare mein qeemati maloomat faraham kar sakta hai. Breakout ke doran zyada volume ka matlab hai ke traders ki taraf se zyada yaqeen hai aur is se breakout ki qamiyabi ke imkanat barh jate hain. 3. Maqsood Ki Pemaeesh: Traders aksar breakout ke maqsood ki qeemat ka andaza lene ke liye cup ki unchi (cup ke neechay se dhaala) ko breakout point mein shamil karte hain. Is se andaza hota hai ke breakout ke baad qeemat kitni door ja sakti hai. 4. Ghalat Breakouts: Har cup and handle pattern ka matlab nahin hota ke breakout kamiyab hojaye. Ghalat breakouts bhi ho sakte hain, jahan qeemat briefly resistance level ko paar karti hai lekin phir wapas consolidation range mein laut jati hai. Is rizk ko qam karne ke liye, kuch traders resistance level ke oper close hone ka intezar karte hain phir trade mein shamil hote hain. 5. Timeframe: Cup and handle pattern mukhtalif timeframes pe nazar aa sakta hai, intraday se lekar hafteyana charts tak. Traders ko apni trading strategy timeframe ke mutabiq tayar karni chahiye. Ikhtetam mein, cup and handle candlestick pattern forex traders ke liye aik wazeh pehchaan ka zariya hai jisse potential bullish trend continuations ya reversals ko pehchana ja sakta hai. Ye pattern teen marhalon mein mukhtalif hota hai: cup, handle, aur breakout. Traders ko ehtiyat aur sabr se kaam lena chahiye, breakout ki tasdeeq ka intezar karna chahiye aur volume aur maqsood ki pemaeesh jaise factors ko madde nazar rakhte hue. Cup and handle pattern qeemati maloomat faraham kar sakta hai, lekin yaad rahe ke koi trading strategy mukammal nahi hoti, aur nuqsanat ka nizaam kaamyabi ke liye ahem hai.
                  • #10 Collapse

                    Cup and handle candlestick pattern


                    "Cup and Handle" Candlestick Pattern, ek bullish continuation pattern hai jo market charts par dikhai deta hai. Ye pattern market mein hone wale bullish trends ko identify karne mein madad karta hai. Is pattern ko "Cup and Handle" is liye kaha jata hai kyunki iski appearance ek cup aur handle jaisi hoti hai.

                    Cup and Handle Candlestick Pattern Ki Khaas Baatein:
                    1. Cup Formation (Cup Banawat):
                      • Cup and Handle pattern ke pehle phase mein, market mein ek rounded bottom formation hoti hai, jise hum "Cup" kehte hain. Is cup ke andar price mein pehle se zyada recovery hoti hai.
                    2. Handle Formation (Handle Banawat):
                      • Cup formation ke baad, ek small consolidation ya retracement hoti hai, jo ek small downtrend ko darust karti hai. Yeh second phase ko hum "Handle" kehte hain.
                    3. Handle Ke Upar Breakout:
                      • Handle ke baad, price mein ek upward movement hota hai aur jab price cup ke upper level ko break karta hai, toh ye ek bullish breakout ko darust karta hai.
                    4. Volume Analysis (Volume Tafseel):
                      • Cup and Handle pattern ke trading volume ko bhi analyze kiya jata hai. Breakout ke waqt, agar volume bhi badh jaata hai, toh ye breakout ko confirm karta hai.
                    5. Target Price Calculation (Maqsood Keemat Hisaab):
                      • Cup and Handle pattern ke breakout ke baad, traders target price ko calculate karte hain. Yeh calculation cup ki depth ko handle ke upar add karke hoti hai.
                    6. Timeframe (Waqt Darust):
                      • Cup and Handle pattern thoda sa waqt leta hai develop hone mein. Traders ko patience rakhna important hai is pattern ko sahi tarah se pehchanne ke liye.
                    "Cup and Handle" Candlestick Pattern, ek bullish continuation pattern hai jo market charts par dikhai deta hai. Is pattern mein sabse pehle ek rounded bottom formation hoti hai, jise hum "Cup" kehte hain, aur phir uske baad ek small consolidation ya retracement hoti hai jo "Handle" ko banati hai. Jab price handle ke upar break karti hai, toh ye ek bullish trend ko darust karta hai. Is pattern ko confirm karne ke liye volume analysis bhi important hai. Hamesha yaad rahe ke kisi bhi pattern ka istemal karne se pehle doosre confirmatory signals aur market analysis bhi zaroori hai.
                    • #11 Collapse

                      Cup and handle candlestick pattern

                      Click image for larger version

Name:	nt.jpg
Views:	61
Size:	91.9 کلوبائٹ
ID:	12789370


                      Cup and handle candlestick pattern ek technical analysis tool hai jo stock market mein istemal hota hai taki traders ko market trends ka pata chale aur unhe future price movements ke liye hint mile. Yeh pattern bullish continuation pattern ke taur par jaana jata hai, jo indicate karta hai ke ek uptrend ke baad aane wala hai.


                      Cup and handle pattern do mukhtalif phases mein hota hai. Sabse pehle, "Cup Formation" hoti hai jisme price ek rounded ya U-shaped bottom banati hai, jo ki ek cup ya coffee mug ki tarah dikhti hai. Is phase mein, initial downtrend ke baad price recover hone lagti hai aur ek gradual curve banati hai. Cup ka left side initial decline ko darust karta hai, jabki right side price recovery ko darust karta hai.


                      Dusri phase hai "Handle Formation" jisme price cup ke baad ek consolidation phase mein chali jaati hai. Handle ek chhota sa pattern hota hai jo price ko sideways ya thoda niche ki taraf le jata hai. Handle ka duration generally short hota hai aur important hai ke handle cup ke gains ka zyada hissa na ghata sake.


                      Ant mein, "Breakout" hota hai jisme price cup ke top dwara banaye gaye resistance level ko break karti hai. Jab yeh breakout hota hai, iska matlab hai ke market mein bullish momentum aa gaya hai aur uptrend shuru hone wala hai.


                      Traders cup and handle pattern ka istemal karte hain taki woh market ka trend samajh sake aur sahi waqt par entry aur exit points tay kar sakein. Yeh pattern market psychology ko reflect karta hai aur traders ko future price movements ke liye tayari karne mein madad karta hai.
                      • #12 Collapse

                        Cup and handle candlestick pattern kai hai

                        Click image for larger version

Name:	download (24).png
Views:	69
Size:	6.4 کلوبائٹ
ID:	12789596

                        "Cup and Handle" ek bullish continuation pattern hai jo candlestick charts par dikhai deta hai. Ye pattern market mein ek temporary pause ke baad hone wale bullish trend continuation ko indicate karta hai. Is pattern ko "Cup and Handle" isliye kaha jata hai kyunki iske chart structure ko dekh kar ek cup aur handle ki tarah imagine kiya ja sakta hai.

                        Cup and Handle Pattern Ka Structure:
                        1. Cup Formation:
                          • Cup and Handle pattern ka pehla hissa hota hai "cup" formation. Isme price ek rounded bottom banata hai, jise "cup" kehte hain. Cup formation ke dauran price initially downtrend mein hota hai, lekin phir gradual recovery hoti hai, aur ek rounded shape create hoti hai jiska center point initial downtrend ke bottom ke pass hota hai.

                          markdownCopy code
                          ____

                        /
                        | | ______/

                        markdownCopy code
                        2. **Handle Formation:** - Cup ban jane ke baad, ek small consolidation ya retracement hota hai, jise "handle" kehte hain. Handle formation ek downward or sideways price movement ko represent karta hai.
                        markdownCopy code
                        ____
                        /
                        | | ______/
                        \

                        vbnetCopy code
                        **Cup and Handle Trading Strategy:** - Entry Point: Traders generally enter a bullish trade when the price breaks above the resistance level formed by the handle. Yani ke jab handle ke upper breakout hota hai. - Stop-Loss: A stop-loss order can be placed below the handle's low to manage risk. - Target: The target is often set based on the depth of the cup, extrapolating the distance from the cup's bottom to its rim. **Key Points:** - Cup and Handle pattern ka formation thoda waqt le sakta hai, isliye patience ka hona important hai. - Volume analysis bhi important hai. Normally, handle formation ke dauran volume low hota hai, aur jab breakout hota hai, toh volume increase hota hai, confirming the bullish move. - Cup and Handle pattern ki accuracy badhane ke liye, doosre technical indicators aur analysis tools ka bhi istemal karna chahiye. Ye pattern traders ke beech popular hai aur agar sahi taur par identify kiya jaye, toh ye ek strong bullish trend ke indication ke roop mein kaam karta hai. Hamesha yaad rahe ke market mein koi bhi pattern 100% guarantee nahi deta, isliye risk management ka bhi khayal rakhna important hai.


                        • <a href="https://www.instaforex.org/ru/?x=ruforum">InstaForex</a>
                        • #13 Collapse

                          Cup and handle candlestick pattern

                          Click image for larger version

Name:	CupandHandleDefinition1-c721e47fd1f7451997d0d5d941f6e174 (1).png
Views:	36
Size:	46.1 کلوبائٹ
ID:	12789618
                          "Cup and Handle" candlestick pattern ek technical analysis ka concept hai, jo ke financial markets, jaise ke stock market, mein istemal hota hai. Yeh pattern usually price charts par dekha jata hai, aur traders ise trend reversal ya trend continuation ka indication samajhte hain.

                          Is pattern mein do main parts hote hain: "cup" aur "handle."

                          Cup (Pyala): Cup ek rounded shape ka hota hai, jise price chart par dekha jata hai. Yeh shape market mein downward trend ke baad aata hai aur price levels mein gradual increase dikhata hai. Cup ke formation ke baad, price levels mein ek sharp decline hota hai jo handle ke shuru hone par rok jata hai.

                          Handle (Dasta): Handle ek short-term consolidation phase hota hai, jisme price levels mein stability dikhti hai. Handle formation ke doran volume kam ho sakta hai. Handle usually cup ke opposite direction mein show hota hai, matlab agar cup upward hai to handle downward hoga, aur agar cup downward hai to handle upward hoga.

                          Cup and handle pattern ko traders price reversal ka sign samajhte hain, aur jab handle complete hota hai, toh woh entry points ke liye dekhte hain. Yadi price handle ke baad phir se upward move karta hai, toh yeh ek bullish signal hai aur traders long positions le sakte hain.

                          Yeh pattern market mein hone wale price movements ko predict karne mein madad karta hai, lekin hamesha yaad rahe ke kisi bhi trading strategy ya pattern ka istemal risk ke saath hota hai. Technical analysis ke liye market trends aur patterns ko samajhna zaroori hai, lekin yeh guarantee nahin karta ke future mein bhi waise hi movements honge.

                          اب آن لائن

                          Working...
                          X