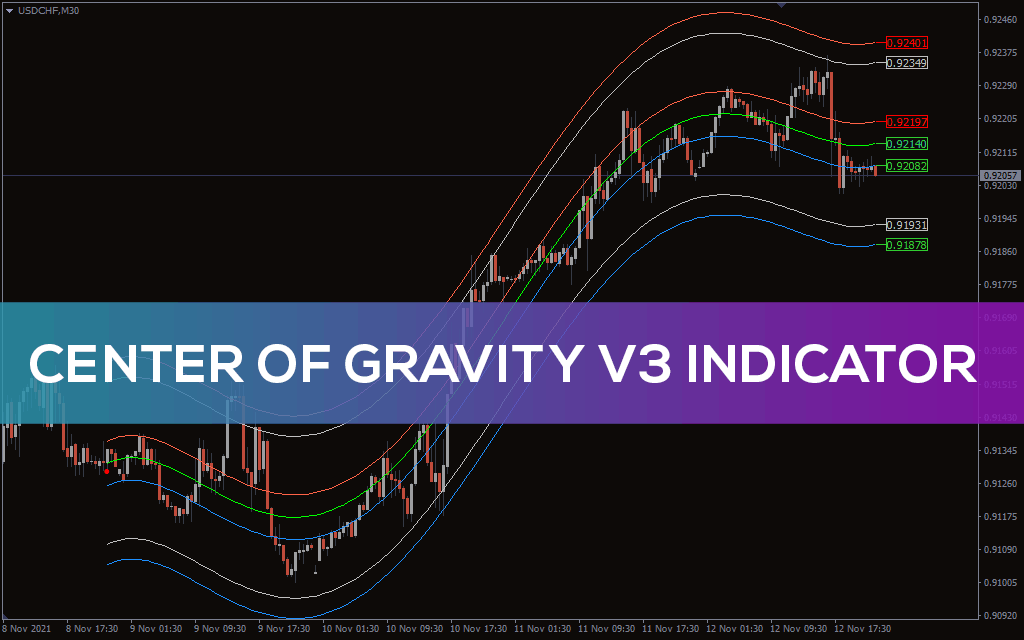
Dear friends, Center of Gravity Indicator market trends aur potential reversals ko identify karne mein madad karta hai. Yeh indicator market ki average price ko calculate karta hai aur iska istemal market ke trend direction aur strength ko samajhne mein hota hai.
Center of Gravity Indicator ki explanation:
Center of Gravity Indicator market ke price movements ko analyze karne ka zariya hai. Is indicator ka maqsad market ki current trend ko aur potential reversals ko tay karna hai, is Indicator ka istemal price ka weighted average calculate karne ke liye hota hai, jo ke market ke average price ko darust karta hai.

Formula for Center of Gravity Indicator:
Center of gravity Indicator ka formula complex hota hai lekin ise samajhna zaroori hai agar aap iska istemal karna chahte hain. Yeh formula is tarah ka hota hai:
Center of gravity = sum of candlestick closing prices (n+1) / sum of candlestick close prices
Yahan n price points ka total hai, Jab aap is formula ko calculate karte hain, aap ko weighted average milta hai jo market ke center of gravity ko darust karta hai.
Center of Gravity Indicator ki Calculation:
Is Indicator ko calculate karne ke liye aap ko kuch steps follow karne hote hain:
- Collection of Price Points:
Sabse pehle, aap ko market ke specific time period ke liye price points collect karne hote hain. Aap daily, weekly, ya monthly basis par is indicator ko calculate kar sakte hain.
- Find Weighted Average:
Collect kiye gaye price points ko istemal karke aap ko weighted average nikalna hoga, jise formula ke mutabiq calculate kiya ja sakta hai.
- Center of Gravity Plot Karein:
Calculate kiye gaye weighted average ko istemal karke aap Center of Gravity Indicator ko plot kar sakte hain. Isse aap ko market ke center of gravity ka visual representation milta hai
Center of Gravity Indicator Ke Trading Strategies:
- Trend Confirmation:
Center of Gravity Indicator ka istemal karke traders market ke trend ko confirm kar sakte hain. Agar center of gravity line price ke qareeb hai, toh yeh indicate karta hai ke trend strong hai.
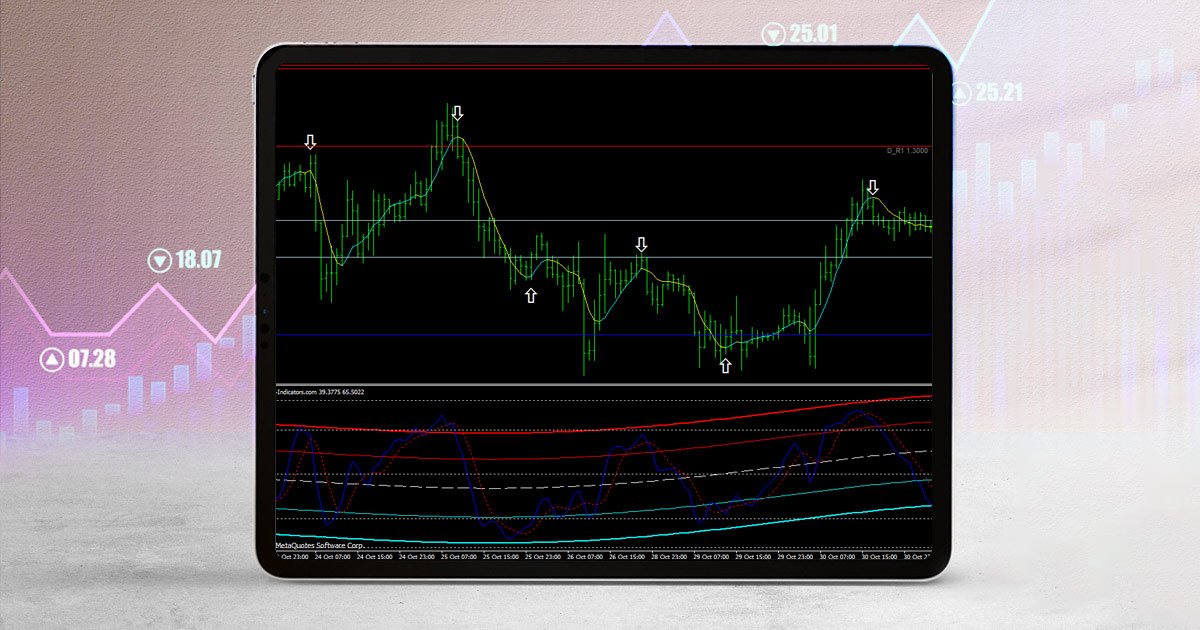
- Reversal Signals:
Jab center of gravity line price se door jaati hai, toh yeh reversal signals provide karta hai. Traders is information ka istemal kar ke potential reversals ko pehchan sakte hain.
- Support aur Resistance Levels:
Center of gravity Indicator ka istemal support aur resistance levels tay karne mein bhi kiya ja sakta hai. Jab center of gravity line kisi specific level ke qareeb hoti hai, toh yeh indicate karta hai ke woh level important ho sakta hai.
Divergence Analysis using center of gravity indicator:
Is indicator ki divergence analysis se traders market ke price movements aur center of gravity ke beech mein kisi bhi inconsistency ko identify kar sakte hain, jo potential trading opportunities banasakti hain.
Center of Gravity Indicator ki explanation:
Center of Gravity Indicator market ke price movements ko analyze karne ka zariya hai. Is indicator ka maqsad market ki current trend ko aur potential reversals ko tay karna hai, is Indicator ka istemal price ka weighted average calculate karne ke liye hota hai, jo ke market ke average price ko darust karta hai.
Formula for Center of Gravity Indicator:
Center of gravity Indicator ka formula complex hota hai lekin ise samajhna zaroori hai agar aap iska istemal karna chahte hain. Yeh formula is tarah ka hota hai:
Center of gravity = sum of candlestick closing prices (n+1) / sum of candlestick close prices
Yahan n price points ka total hai, Jab aap is formula ko calculate karte hain, aap ko weighted average milta hai jo market ke center of gravity ko darust karta hai.
Center of Gravity Indicator ki Calculation:
Is Indicator ko calculate karne ke liye aap ko kuch steps follow karne hote hain:
- Collection of Price Points:
Sabse pehle, aap ko market ke specific time period ke liye price points collect karne hote hain. Aap daily, weekly, ya monthly basis par is indicator ko calculate kar sakte hain.
- Find Weighted Average:
Collect kiye gaye price points ko istemal karke aap ko weighted average nikalna hoga, jise formula ke mutabiq calculate kiya ja sakta hai.
- Center of Gravity Plot Karein:
Calculate kiye gaye weighted average ko istemal karke aap Center of Gravity Indicator ko plot kar sakte hain. Isse aap ko market ke center of gravity ka visual representation milta hai
Center of Gravity Indicator Ke Trading Strategies:
- Trend Confirmation:
Center of Gravity Indicator ka istemal karke traders market ke trend ko confirm kar sakte hain. Agar center of gravity line price ke qareeb hai, toh yeh indicate karta hai ke trend strong hai.
- Reversal Signals:
Jab center of gravity line price se door jaati hai, toh yeh reversal signals provide karta hai. Traders is information ka istemal kar ke potential reversals ko pehchan sakte hain.
- Support aur Resistance Levels:
Center of gravity Indicator ka istemal support aur resistance levels tay karne mein bhi kiya ja sakta hai. Jab center of gravity line kisi specific level ke qareeb hoti hai, toh yeh indicate karta hai ke woh level important ho sakta hai.
Divergence Analysis using center of gravity indicator:
Is indicator ki divergence analysis se traders market ke price movements aur center of gravity ke beech mein kisi bhi inconsistency ko identify kar sakte hain, jo potential trading opportunities banasakti hain.
تبصرہ
Расширенный режим Обычный режим