Introduction to the Pipe Top and Pipe Bottom Pattern:
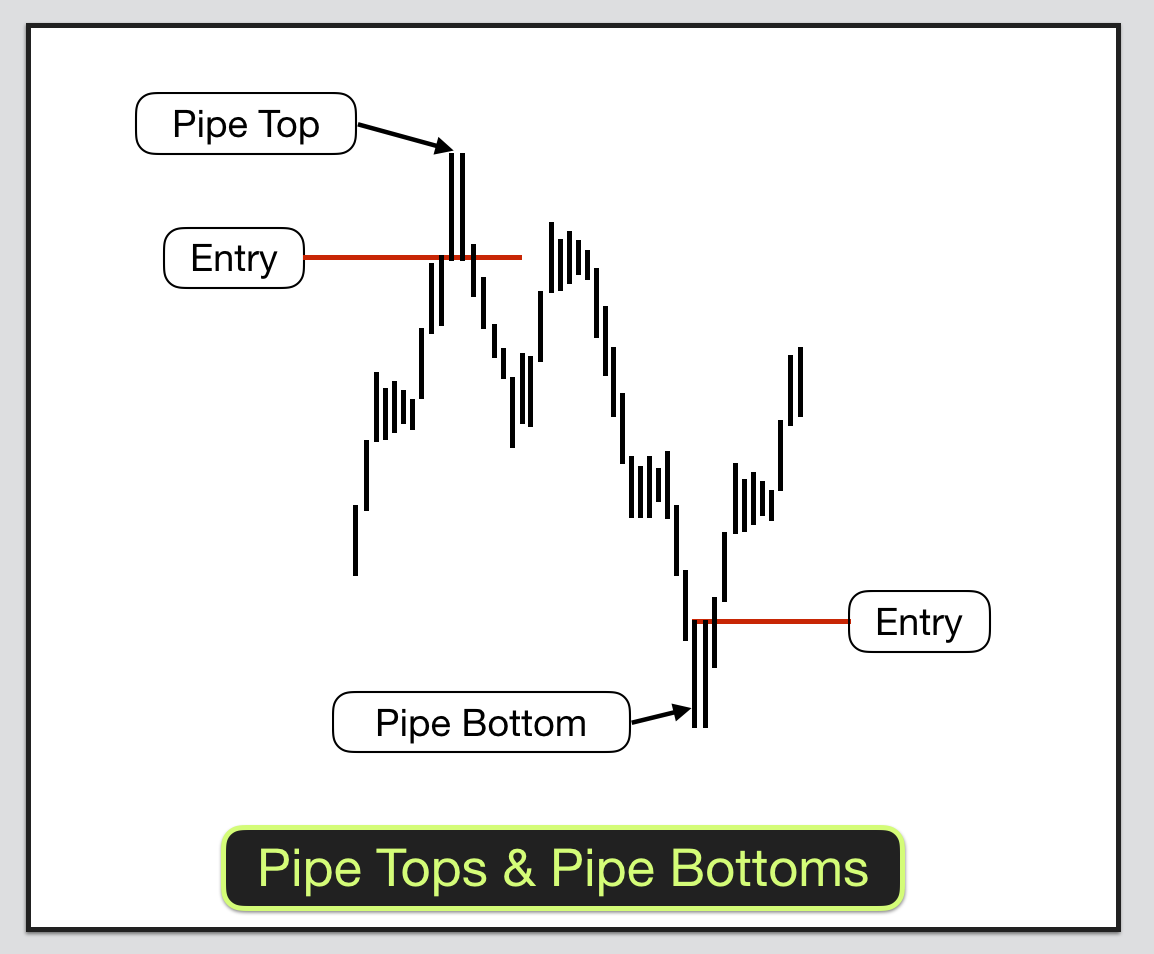
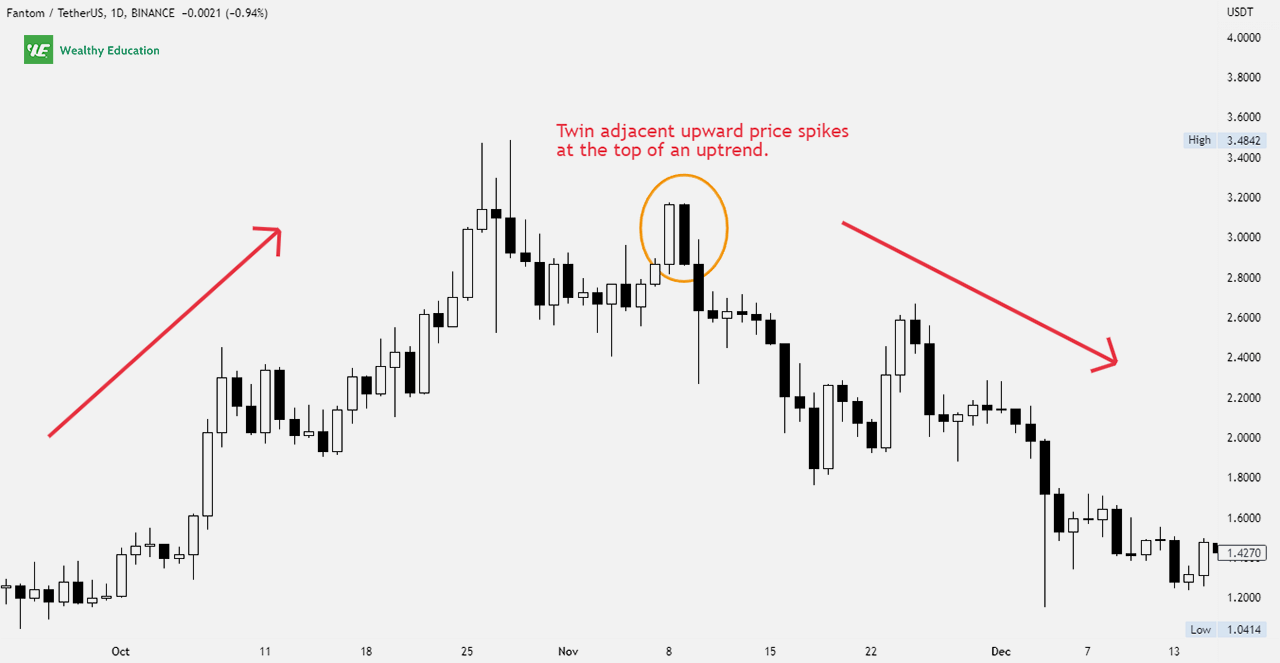
Pipe Top aur Pipe Bottom pattern forex trading mein istemal hone wale aham technical patterns hain jo potential trend reversals ko pehchanne ke liye istemal kiye jate hain. Ye patterns lambe samay tak chalte hue uptrend ya downtrend ke baad ban jate hain aur market sentiment ka ulta chinh hote hain. Pipe Top pattern banne par, prices ek naye high tak pahunchte hain, uske baad tezi se girti hain aur pichhle support level ko dobara test karti hain. Wahi Pipe Bottom pattern tab ban jata hai jab prices naye low tak jaate hain, uske baad majboot tezi se badhte hain aur pichhle resistance level ko dobara test karte hain.
Characteristics of the Pipe Top and Pipe Bottom Pattern:
Pipe Top pattern generally tab ban jata hai jab market participants ne apni buying power khatam kar di hoti hai, jiske karan bikri dabav mein teji aati hai. Isse prices teji se gire aur sellers control me aa kar prices ko niche dhakelte hain. Market dwara pichhle support level ko dobara test karna potential trend reversal ka sanket deta hai. Traders bearish candlestick patterns ya dusre technical indicators ki madad se pattern ko further validate kar sakte hain.
Dusri taraf, Pipe Bottom pattern tab ban jata hai jab market participants ne apni selling power khatam kar di hoti hai, jiske karan kharidari dabav mein teji aati hai. Iss se prices mein majboot teji aa jati hai aur buyers control me aa kar prices ko upar dhakelte hain. Market dwara pichhle resistance level ko dobara test karna prevaling downtrend ka potential reversal signal deta hai. Traders bullish candlestick patterns ya dusre technical indicators ki madad se pattern mein vishwas ko badha sakte hain.
Identifying and Trading the Pipe Top and Pipe Bottom Pattern:
Pipe Top pattern ko pehchanne ke liye, traders ko dekhna chahiye ki kya ek naya high banane ke baad prices tezi se gire aur pichhle support level ko dobara test kiya hai. Isko price chart par naye high points aur retested support level ko connect karke visually identify kiya jaa sakte hai. Traders ko iske baad bearish candlestick pattern ya support level ke break ki aashanka ke baad short position me enter karne ka signal mil sakta hai.
Pipe Bottom pattern ko pehchanne ke liye, traders ko dekhna chahiye ki kya naye low banane ke baad prices majboot tezi se badhi hai aur pichhle resistance level ko dobara test kiya hai. Lowest points aur retested resistance level ko connect karne se is pattern ko visualize kiya jaa sakta hai. Confirmation ke liye traders bullish candlestick pattern ya resistance level ke break ki aashanka ke baad long position me enter kar sakte hain.
Benefits and Limitations of the Pipe Top and Pipe Bottom Pattern:
Pipe Top aur Pipe Bottom pattern forex traders ko kuchh fayde pradan karte hain. Pehle toh, ye potential trend reversals ka early signal dete hain, jiski wajah se traders naye trend ke shuruat me positions le sakte hain. Iske alawa, ye patterns clear stop-loss levels bhi pradan karte hain, jis se risk management ki madad milti hai. Traders Pipe Top pattern ke case mein support level ke niche stop-loss order rakhte hain aur Pipe Bottom pattern ke case mein resistance level ke upar stop-loss order rakhte hain.
Lekin ahmiyat rakhta hai ke jaisa ke har technical pattern ki tarah, Pipe Top aur Pipe Bottom patterns bhi bulproof nahi hote aur kabhi kabhi jhoothay signals bhi de sakte hain. Traders ko ihtiyat se kaam karna chahiye aur mazeed tasdiq tools ka istemal karke jhootay breakout ke risk ko kam karna chahiye. Is ke ilawa, market ki bunyadiyat aur khabar events jaise factors ko bhi ghor se samajhna zaroori hai, jo price movements par asar dal sakte hain.
Conclusion:
Pipe Top aur Pipe Bottom pattern forex traders ke liye qeemti technical tool hai jo potensial trend reversal ki pehchan karna chahte hain. Ye patterns naye trend ki shuruaat ke baad ban jate hain aur market sentiment mein tabdeeli ka aalaam hote hain. In patterns ko hawasni tor par pehchan karke aur dusre technical indicators ke saath tasdiq karke, traders naye trend mein jald se jald positions le sakte hain jahan risk management bhi wazeh ho. Lekin ihtiyat se kaam karna aur mazeed tasdiq tools ka istemal karna jhootay breakout se bachne ke liye ahmiyat rakhta hai.


تبصرہ
Расширенный режим Обычный режим