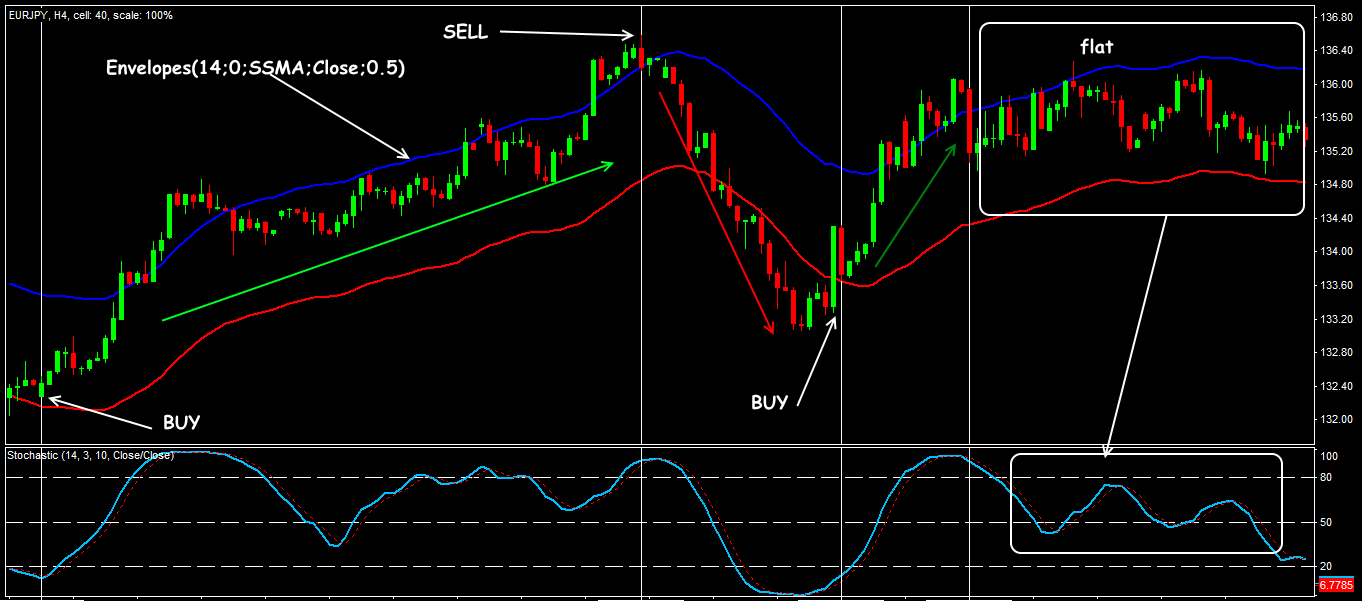
Envelope indicator ek technical analysis ka tool hai jo price chart mein overbought aur oversold levels maloom karne ke liye istemal hota hai. Isay Keltner Channel ya Keltner Band bhi kehte hain. Envelope indicator ko Chester Keltner ne 1960s mein develop kia tha aur ye ek popular Bollinger Bands ka alternative hai. Envelope indicator do bands se bana hota hai jo price chart ke upar aur neeche plot kiye jate hain. Ye bands moving average aur uske standard deviation ka multiple istemal karke calculate kiye jate hain. Upper band ko moving average mein kuch standard deviations add karke calculate kiya jata hai, jabke lower band ko moving average se wahi standard deviations subtract karke calculate kiya jata hai. Default setting envelope indicator ki hoti hai ke 20-period MA aur do standard deviations istemal kie jayein. Lekin traders apne trading style aur market conditions ke mutabiq in settings ko adjust kar sakte hain.

Envelope Indicator Working
Envelope indicator ka kaam ye hai ke woh price levels ko pehchan leta hai jo normal price fluctuations ke range ke bahar hote hain. Jab price upper band ke upar move karta hai, to ye darust karta hai ke market overbought hai, aur ek pullback ya correction hone wala hai. Ulta, jab price lower band ke neeche move karta hai, to ye darust karta hai ke market oversold hai, aur ek uptrend shuru ho sakta hai.
Envelope indicator ko trading strategy mein potential entry aur exit points ko pehchanne ke liye bhi istemal kiya ja sakta hai. Jab price kisi bhi band ko chhuta hai, to isay potential reversal point ke taur par interpret kiya ja sakta hai, jo traders ko trade enter ya exit karne ka mauka deta hai. Traders in bands ko apne risk ko manage karne ke liye stop-loss levels ke tor par bhi istemal kar sakte hain.
Benefits of Using Envelope Indicator
Limitations of Using Envelope Indicator

Envelope Indicator Working
Envelope indicator ka kaam ye hai ke woh price levels ko pehchan leta hai jo normal price fluctuations ke range ke bahar hote hain. Jab price upper band ke upar move karta hai, to ye darust karta hai ke market overbought hai, aur ek pullback ya correction hone wala hai. Ulta, jab price lower band ke neeche move karta hai, to ye darust karta hai ke market oversold hai, aur ek uptrend shuru ho sakta hai.
Envelope indicator ko trading strategy mein potential entry aur exit points ko pehchanne ke liye bhi istemal kiya ja sakta hai. Jab price kisi bhi band ko chhuta hai, to isay potential reversal point ke taur par interpret kiya ja sakta hai, jo traders ko trade enter ya exit karne ka mauka deta hai. Traders in bands ko apne risk ko manage karne ke liye stop-loss levels ke tor par bhi istemal kar sakte hain.
Benefits of Using Envelope Indicator
- Identifying Overbought and Oversold Levels: Envelope indicator traders ko price chart mein overbought aur oversold levels pehchanne mein madad karta hai, jo potential reversals ya trend changes ke bare mein malumat faraham kar sakte hain. Ye malumat traders ko trades enter ya exit karne ke bare mein faislay karne mein madad kar sakti hai.
- Providing Dynamic Support and Resistance Levels: Envelope bands dynamic support aur resistance levels faraham karte hain jo market conditions ke mutabiq adjust hote hain. Ye feature traders ko price action ke mutabiq potential entry aur exit points ko pehchanne mein asani faraham karta hai.
- Reducing False Signals: Dusre indicators jaise ke Moving Averages ya MACD ke mukable, jo sideways ya ranging markets mein false signals generate kar sakte hain, envelope indicator false signals kam dene mein kamzor hota hai kyunki isne fixed values ke bajaye standard deviations ka istemal kiya hota hai bands calculate karne ke liye. Ye feature ise trend changes aur potential reversals ko pehchane mein zyada reliable banata hai.
- Customizable Settings: Traders envelope indicator ki settings ko customize karke period length aur standard deviations ki tadad ko adjust kar sakte hain. Ye flexibility traders ko indicator ko apne khaas trading style aur market conditions ke mutabiq customize karne mein madad karta hai.

Limitations of Using Envelope Indicator
- High False Positive Rate: Dusre indicators ke mukable, envelope indicator mein bhi false signals ka zyada rate hota hai kyunki isne standard deviations ka istemal historical price data ke bajaye bands calculate karne ke liye kiya hota hai. Ye feature volatile market conditions ya jab prices normal ranges ke bahar tezi se move kar rahi hain, to false signals ko paida kar sakta hai.
- Over-reliance on Indicator: Traders ko chahiye ke woh apne trading faislay ke liye sirf envelope indicator par pura bharosa na karein, kyun ke ye market analysis ka sirf ek pahlu faraham karta hai. Isay indicator signal par trading faislay se pehle dusre factors jaise ke fundamental analysis, chart patterns aur news events ko bhi mad e nazar rakhein.
- Lack of Historical Data: Envelope indicator dusre indicators jaise Moving Averages ya MACD ke mukable naye hai, jinhe historical data ke sath extensively test kia gaya hai. Is wajah se iske liye kam historical data available hai jisse iski effectiveness ko test aur validate kia ja sake.


تبصرہ
Расширенный режим Обычный режим