Bull Flag Chart Pattern ki wazahat tafseel ka sth wazahat

No announcement yet.
`
X
  • وقت
  • دکھائیں
Clear All
new posts
  • #1 Collapse

    Bull Flag Chart Pattern ki wazahat tafseel ka sth wazahat


    Bull flag chart pattern ek bullish trend continuation pattern hota hai jo market mein uptrend ke dauran dikhai deta hai. Yeh ek price action pattern hai jo market ke momentum aur trend ko reflect karta hai. Bull flag pattern typically price consolidation ke baad uptrend mein hota hai, suggesting a brief pause before the uptrend resumes.

    Yeh pattern usually do parts mein hota hai:
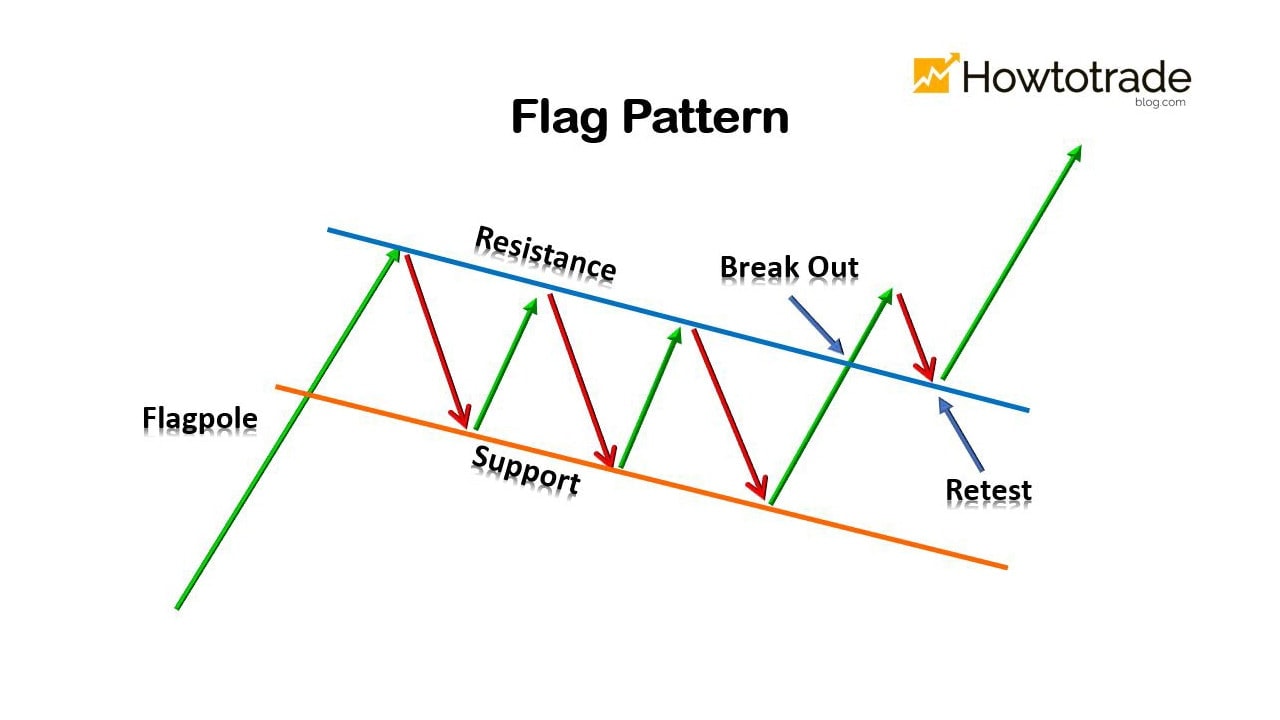
    1. Pole (Upar ki Raish): Bull flag pattern ki shuruaat ek steep price increase se hoti hai, jo ek pole ki tarah dikhta hai. Is pole mein price mein sudden significant increase hota hai jo flag pattern ki formation ko shuru karta hai.
    2. Flag (Jhanda): Pole ke baad, price mein consolidation hoti hai jo ek downward sloping trend line ke saath hoti hai, creating a flag-like pattern. Yeh trend line typically parallel hoti hai, price ke sath slope karke neeche ki taraf jaati hai. Volume is phase mein usually kam hota hai, indicating a temporary pause in the market before the next potential upward move.

    Bull flag pattern ki pehchaan kaise hoti hai aur kyun yeh important hai:
    • Price Action: Bull flag pattern mein pole ke baad price consolidation hoti hai, jise trend line se represent kiya jata hai. Is consolidation phase mein price stable hoti hai aur trend line ke andar rehti hai.
    • Volume: Is phase mein usually volume kam hota hai jo indicate karta hai ke market mein activity slow ho gayi hai. Yeh price ke temporary pause ka indication hai.
    • Continuation Pattern: Bull flag pattern ek trend continuation pattern hota hai, iska matlab hai ke jab trend upward hota hai aur bull flag pattern form hota hai, toh woh indicate karta hai ke uptrend continue hone ki possibility hai.

    Bull flag pattern ko samajhna aur trade karna trading mein beneficial ho sakta hai, lekin isko accurately identify karna aur false signals ko avoid karna important hai. Always confirm the pattern with other technical indicators aur current market conditions ke saath.



  • <a href="https://www.instaforex.org/ru/?x=ruforum">InstaForex</a>
  • #2 Collapse


    Bull flag pattern market analysis mein ek crucial pattern hai jo uptrend ke dauran dikhta hai. Iski pehchaan aur importance ko samajhna traders ke liye significant hota hai. Yeh kuch important steps hote hain jinse bull flag pattern ko pehchana ja sakta hai:
    1. Pole Ki Uchchai: Bull flag pattern ki pehli pehchaan hoti hai steep uptrend mein, jise "pole" kehte hain. Isme price mein sudden significant increase hoti hai, jisse market mein strong buying pressure indicate hoti hai.
    2. Price Consolidation: Pole ke baad, price mein ek consolidation phase aata hai jise "flag" kehte hain. Is phase mein price ke andar ek flag jaisa pattern ban jata hai, jisme price stable rehti hai aur slope downward hoti hai.
    3. Trend Lines Ki Identification: Bull flag pattern ko identify karne ke liye trend lines ka use hota hai. Pole ke highest point se draw ki gayi line ko upper trend line kehte hain, jo price increase ko represent karti hai. Flag ke baad draw ki gayi line ko lower trend line kehte hain, jo price consolidation ko represent karti hai.
    4. Volume Analysis: Bull flag pattern ke identification mein volume bhi important hota hai. Pole ke dauran high volume hota hai, indicating strong buying or selling pressure. Flag phase mein volume usually decrease hota hai, indicating price stabilization.
    5. Breakout Confirmation: Pattern ke end mein breakout ki confirmation ki jarurat hoti hai. Agar price flag ke upper trend line ko break karke wapas uptrend mein jaati hai, tab bull flag pattern confirm hota hai.

    Yeh pattern important hai kyunki isse uptrend continuation ke possibilities aur potential entry points ko identify kiya ja sakta hai. Agar yeh pattern sahi tarike se recognize kiya gaya hai, toh traders iske sath trading strategies formulate kar sakte hain, jisse market ke movements ke saath align ho sakte hain. Iske saath hi, yeh pattern false signals aur market ki movements ko samajhne mein madad karta hai.


    • <a href="https://www.instaforex.org/ru/?x=ruforum">InstaForex</a>
    • #3 Collapse


      Introduction:

      Bull flag ek technical analysis pattern hai jo market charts par paya jata hai aur ye trend continuation pattern hota hai. Yeh pattern traders ko indicate karta hai ke ek uptrend ke baad market mein choti si rukawat (consolidation) ho sakti hai, lekin phir se bullish movement expected hai.

      Bull Flag Kya Hai:

      Bull flag ek bullish continuation pattern hai jo uptrend ke dauran aksar dekha jata hai. Yeh pattern ek rectangle ya parallelogram ki tarah dikhta hai, jismein flagpole (jhande ka danda) ke baad ek choti si flat region hoti hai.


      Bull Flag Components:


      Flagpole Yeh hota hai jab price mein ek sudden upward movement hota hai. Is movement ko flagpole kehte hain aur iski length, trading range ya price range ko represent karta hai.

      Flag Flagpole ke baad, price mein thoda sa consolidation hota hai aur ek rectangle ya parallelogram ki tarah ek flat region ban jata hai. Is flat region ko "flag" kehte hain.


      Bull Flag Formation:


      Bull flag formation, jab price ek strong uptrend ke baad thoda sa neeche aata hai aur ek horizontal ya ascending trendline ke around trading range create karta hai. Yeh consolidation phase bull flag pattern ka hissa hoti hai. Flagpole ke movement ke baad, price ko stability milti hai aur traders ko ek potential bullish breakout ka indication milta hai.


      Bull Flag Pattern ke Tafseelat:


      Volume Analysis: Bull flag pattern mein volume analysis bhi important hai. Flagpole ke dauran high volume hota hai, lekin jab flag ban raha hota hai, toh volume normally thoda kam hota hai. Jab price breakout karta hai, toh volume phir se increase hota hai, indicating a strong bullish move.

      Breakout Confirmation: Bull flag ko successfully trade karne ke liye breakout confirmation ka wait karna zaroori hai. Agar price flag ke upper side break karta hai, toh yeh bullish breakout ko confirm karta hai aur traders ko buying opportunities provide karta hai.

      Target Calculation: Bull flag ka target calculate karne ke liye, traders flagpole ki length ko measure karte hain aur phir usi length ko flag breakout point se upar extend karte hain. Yeh target area hota hai jahan traders apne trades ko exit kar sakte hain ya phir profits book kar sakte hain.

      Conclusion:

      Bull flag chart pattern ek powerful tool hai jo traders ko uptrend ke continuation aur potential buying opportunities ke liye guide karta hai. Is pattern ki sahi tafseelat aur breakout confirmation ke sath, traders apne trading strategies ko improve karke market movements ka behtar taur par faida utha sakte hain.


      There is a time to go long, a time to go short and a time to go fishing.
      ​​​​​​​

      ​​​​​​​

      اب آن لائن

      Working...
      X