Concept of Parabolic SAR:
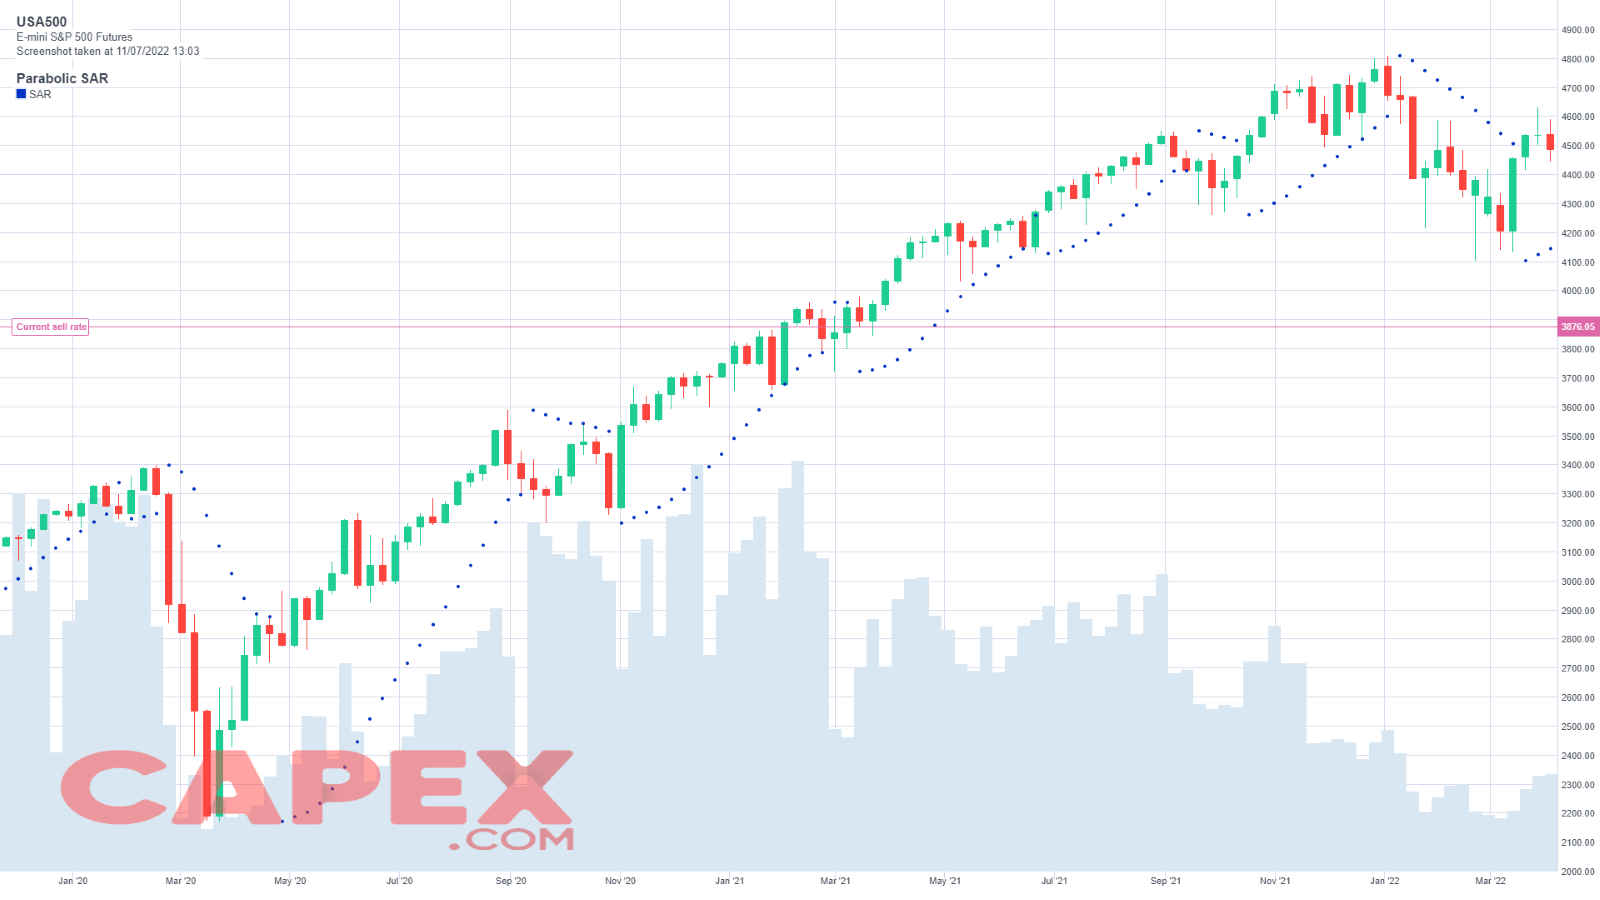
Parabolic SAR (Stop aur Reverse) indicator forex trading mein istemal hone wala aik technical analysis tool hai jo trend ke reversals ka pata lagane ke liye istemal hotajata hai. Isko price chart par plot kiya jata hai aur yeh dots price bars ke neeche ya upar appear hote hain. Yeh indicator traders ko entry aur exit signals provide karta hai aur current trend ka direction visually show karta hai. Jab dots price bars ke neeche hote hain, toh yeh uptrend ko indicate karta hai, jabki dots price bars ke upar hone par yeh downtrend ko indicate karte hain. Dots ayr trailing stop-loss levels ke taur par bhi kaam karte hain, jo trend ke progress ke saath price ke qareeb move karte hain. Yeh indicator market ke concept par based hai ke uptrends mein markets tend to make higher highs and downtrends mein lower lows, aur iska aim hai in trend reversals ko capture kar profitable trading opportunities create karne ka.
Calculation of Parabolic SAR:
Parabolic SAR indicator ko calculate karne ke liye ek formula istemal hota hai, jo previous period ke SAR value ko aur acceleration factor (AF) ko account mein rakhta hai. AF ek multiplier hai jo market mein naye extreme point tak pohochne par increase hota hai. Ek uptrend mein, initial SAR value previous period ke lowest low ke neeche set kiya jata hai. Aane wale periods mein, SAR value ko recalculate kiya jata hai jismein AF current period ke highest high aur previous period ke SAR value ke difference ko multiply karke add kiya jata hai. Acceleration factor ko traders apni preference aur trading strategy ke hisaab se adjust kar sakte hain.
Interpretation of Parabolic SAR:
Traders Parabolic SAR indicator ka istemal kar potential trend reversals ko identify karne aur entry aur exit points determine karne ke liye karte hain. Jab dots price bars ke neeche hote hain, toh iska matlab uptrend hai aur traders buying opportunities dhoondh sakte hain ya apne existing long positions hold kar sakte hain. Jab dots price bars ke upar hote hain, toh iska matlab downtrend hai aur traders selling consider kar sakte hain ya short positions hold kar sakte hain. Dots aur price bars ke darmiyaan ki distance bhi trend ki strength ke baare mein information provide karte hai. Jitna dots price bars ke qareeb hote hain, utna stronger trend hai.
Limitations of Parabolic SAR:
Parabolic SAR indicator ki bhi kuch limitations hoti hain jinhe traders ko janna chahiye. Pehli baat toh yeh effective nahi hota choppy ya sideways markets mein jahan yeh false signals generate karne tend karta hai. Dusra, indicator volatile market conditions mein late signals bhi de sakta hai, jisse traders potential entry ya exit points miss kar sakte hain. Akhri mein, Parabolic SAR akele mein trading decisions ke liye sufficient nahi hai, isliye recommended hai ke isko other technical analysis tools ke saath combine karke istemal kiya jaye confirmations ke liye.
Strategies using Parabolic SAR:
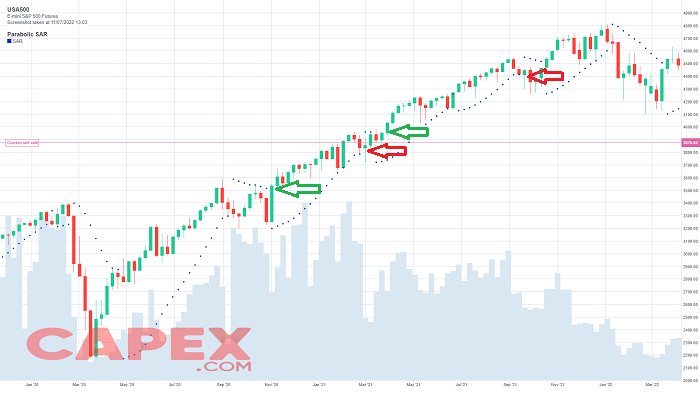
Traders ne Parabolic SAR indicator ka istemal karke apni trading approach ko enhance karne ke liye various strategies develop kiye hain. Ek popular strategy SAR crossover hai, jahan traders long position enter karte hain jab price SAR dots ke upar se cross karti hai aur short position enter karte hain jab price SAR dots ke neeche se cross karti hai. Ek aur strategy SAR trailing stop hai, jahan traders apne stop-loss levels ko SAR dots ke movement ke basis par adjust karte hain. Yeh unhe apne profits protect karne aur trend continue hone tak trade mein rehne ka mouqa deti hai. Additionally, Parabolic SAR ko moving averages ya oscillators jaisi aur indicators ke saath combine kiya jaa sakta hai signals ko filter karne aur trading strategy ke accuracy ko improve karne ke liye.
Parabolic SAR (Stop aur Reverse) indicator forex trading mein istemal hone wala aik technical analysis tool hai jo trend ke reversals ka pata lagane ke liye istemal hotajata hai. Isko price chart par plot kiya jata hai aur yeh dots price bars ke neeche ya upar appear hote hain. Yeh indicator traders ko entry aur exit signals provide karta hai aur current trend ka direction visually show karta hai. Jab dots price bars ke neeche hote hain, toh yeh uptrend ko indicate karta hai, jabki dots price bars ke upar hone par yeh downtrend ko indicate karte hain. Dots ayr trailing stop-loss levels ke taur par bhi kaam karte hain, jo trend ke progress ke saath price ke qareeb move karte hain. Yeh indicator market ke concept par based hai ke uptrends mein markets tend to make higher highs and downtrends mein lower lows, aur iska aim hai in trend reversals ko capture kar profitable trading opportunities create karne ka.
Calculation of Parabolic SAR:
Parabolic SAR indicator ko calculate karne ke liye ek formula istemal hota hai, jo previous period ke SAR value ko aur acceleration factor (AF) ko account mein rakhta hai. AF ek multiplier hai jo market mein naye extreme point tak pohochne par increase hota hai. Ek uptrend mein, initial SAR value previous period ke lowest low ke neeche set kiya jata hai. Aane wale periods mein, SAR value ko recalculate kiya jata hai jismein AF current period ke highest high aur previous period ke SAR value ke difference ko multiply karke add kiya jata hai. Acceleration factor ko traders apni preference aur trading strategy ke hisaab se adjust kar sakte hain.
Interpretation of Parabolic SAR:
Traders Parabolic SAR indicator ka istemal kar potential trend reversals ko identify karne aur entry aur exit points determine karne ke liye karte hain. Jab dots price bars ke neeche hote hain, toh iska matlab uptrend hai aur traders buying opportunities dhoondh sakte hain ya apne existing long positions hold kar sakte hain. Jab dots price bars ke upar hote hain, toh iska matlab downtrend hai aur traders selling consider kar sakte hain ya short positions hold kar sakte hain. Dots aur price bars ke darmiyaan ki distance bhi trend ki strength ke baare mein information provide karte hai. Jitna dots price bars ke qareeb hote hain, utna stronger trend hai.
Limitations of Parabolic SAR:
Parabolic SAR indicator ki bhi kuch limitations hoti hain jinhe traders ko janna chahiye. Pehli baat toh yeh effective nahi hota choppy ya sideways markets mein jahan yeh false signals generate karne tend karta hai. Dusra, indicator volatile market conditions mein late signals bhi de sakta hai, jisse traders potential entry ya exit points miss kar sakte hain. Akhri mein, Parabolic SAR akele mein trading decisions ke liye sufficient nahi hai, isliye recommended hai ke isko other technical analysis tools ke saath combine karke istemal kiya jaye confirmations ke liye.
Strategies using Parabolic SAR:
Traders ne Parabolic SAR indicator ka istemal karke apni trading approach ko enhance karne ke liye various strategies develop kiye hain. Ek popular strategy SAR crossover hai, jahan traders long position enter karte hain jab price SAR dots ke upar se cross karti hai aur short position enter karte hain jab price SAR dots ke neeche se cross karti hai. Ek aur strategy SAR trailing stop hai, jahan traders apne stop-loss levels ko SAR dots ke movement ke basis par adjust karte hain. Yeh unhe apne profits protect karne aur trend continue hone tak trade mein rehne ka mouqa deti hai. Additionally, Parabolic SAR ko moving averages ya oscillators jaisi aur indicators ke saath combine kiya jaa sakta hai signals ko filter karne aur trading strategy ke accuracy ko improve karne ke liye.


تبصرہ
Расширенный режим Обычный режим