Pin bar candlestick pattern
X
  • وقت
  • دکھائیں
Clear All
new posts
  • #16 Collapse

    Pin bar candlestick pattern kai hy


    "Pin Bar" ya "Pinocchio Bar" ek popular candlestick pattern hai jo market mein trend reversal ya trend continuation ko indicate karta hai. Ye pattern ek single candlestick se bana hota hai aur traders ke liye significant information provide karta hai. Chaliye is pattern ko detail mein samajhte hain:

    Pin Bar Candlestick Pattern ki Khasoosiyat:
    1. Formation (Banawat):
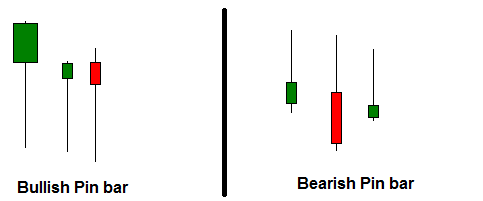
      • Pin bar ek single candlestick pattern hai jo do main parts se milta hai: body aur wicks (ya shadows).
      • Is pattern mein candle ki body chhoti hoti hai aur uski wicks lambe hoti hain. Body ke ek side par lambi wick hoti hai aur doosri side par chhoti wick hoti hai.
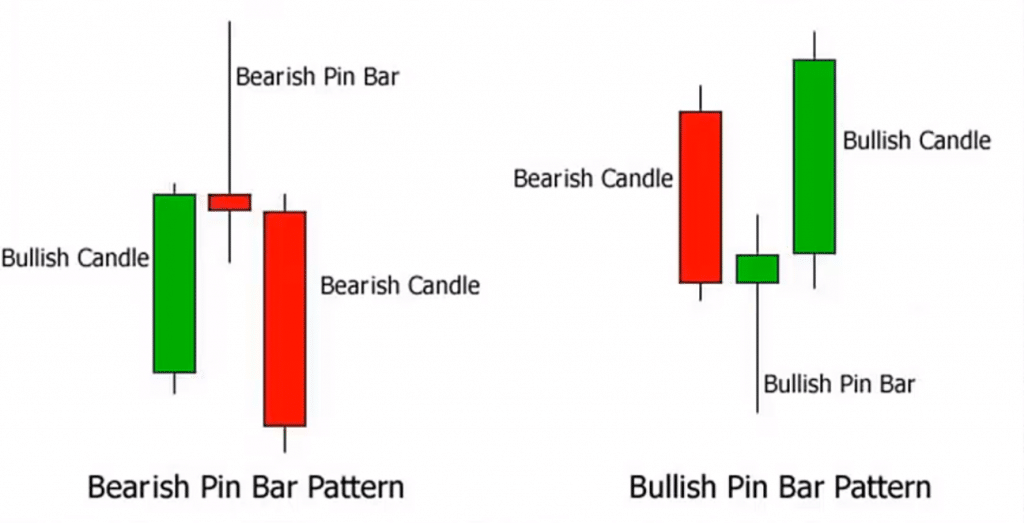
      • Agar pin bar bullish reversal ke liye form hota hai, toh lambi wick candle ki bottom (neeche) hoti hai aur chhoti wick top (ooper) hoti hai. Agar pin bar bearish reversal ke liye form hota hai, toh lambi wick candle ki top hoti hai aur chhoti wick bottom hoti hai.
    2. Signal (Ishara):
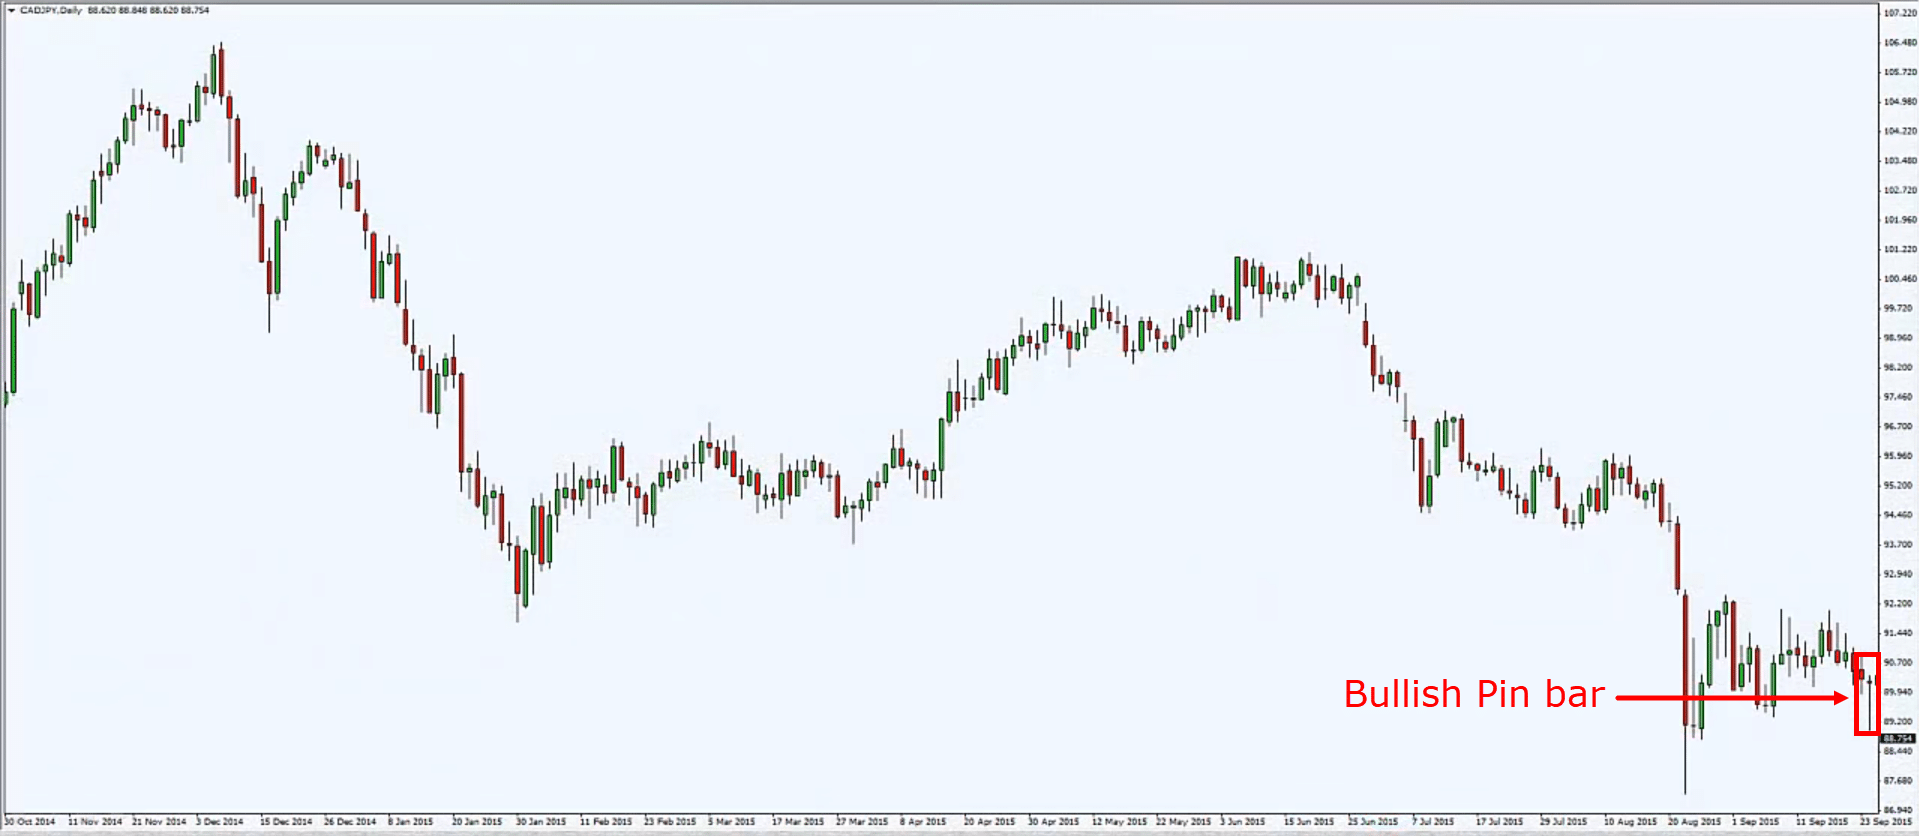
      • Bullish pin bar (jab lambi wick neeche hoti hai) bullish reversal ko indicate karta hai aur bearish trend ke end ya reversal ko suggest karta hai.
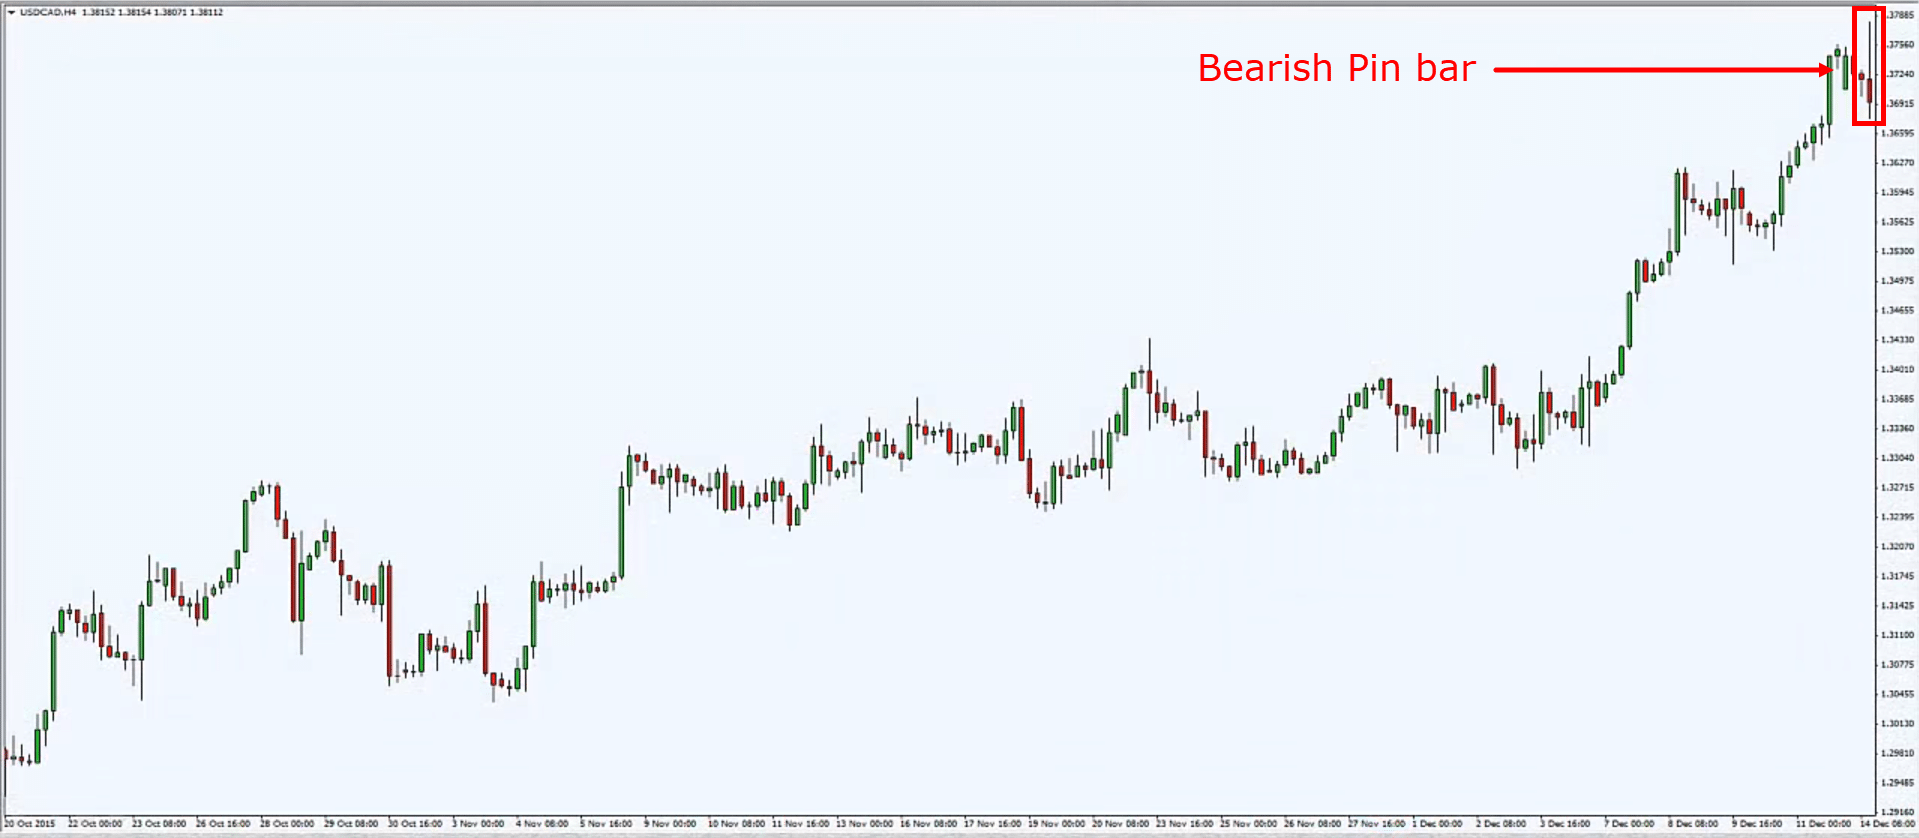
      • Bearish pin bar (jab lambi wick ooper hoti hai) bearish reversal ko indicate karta hai aur bullish trend ke end ya reversal ko suggest karta hai.
      • Pin bar ko confirm karne ke liye, traders doosre technical indicators ka istemal karte hain aur market context ko bhi dekhte hain.
    3. Volume Analysis (Mawad Tahlil):
      • Pin bar ke saath volume analysis bhi important hai. Agar pin bar ke sath high volume hai, toh ye pattern ki authenticity ko badha sakta hai.
    4. Confirmation (Tasdeeq):
      • Pin bar ko confirm karne ke liye, traders ko doosre technical indicators ka bhi istemal karna chahiye, jaise ki moving averages, RSI, ya MACD.

    Pin Bar Candlestick Pattern Trading Guide:
    1. Identify the Pattern:
      • Pehle toh traders ko pin bar pattern ko identify karna hota hai. Is pattern ko aasani se candlestick charts par dekha ja sakta hai.
    2. Wait for Confirmation:
      • Pattern ko confirm karne ke liye, traders ko doosre technical indicators ka istemal karna chahiye aur market ke overall context ko bhi dekhna chahiye.
    3. Entry Point aur Stop Loss:
      • Agar pin bar ko confirm kiya gaya hai, toh traders entry point par trade kar sakte hain, ideally wicks ke high ya low ke near.
      • Stop loss order ko thayati tarah se set karna chahiye, jisse ki nuksan ka risk minimize ho sake.
    4. Target Setting:
      • Target setting ke liye, traders previous support aur resistance levels ko dekh sakte hain, jahan price ko rukawat milti hai.
    5. Risk Management:
      • Har trade mein risk management ka dhyan rakhna zaroori hai. Position size aur stop loss ka sahi istemal karna chahiye.

    Pin bar ek powerful candlestick pattern hai jo traders ko potential trend reversals ya continuations ke bare mein important information deta hai. Lekin hamesha yaad rahe ke kisi bhi pattern ko trading decision mein istemal karte waqt, market context aur doosre factors ko bhi madde nazar rakhein.
    • <a href="https://www.instaforex.org/ru/?x=ruforum">InstaForex</a>
    • #17 Collapse

      NR7 trading strategy.

      NR7 trading strategy pattern, jise Narrow Range 7 bhi kaha jata hai, ek bahut hi popular trading strategy pattern hai. Ye pattern aam taur par short-term traders dwara istemal kiya jata ha.


      NR7 pattern ka matlab hota hai ki market mein 7 dinon tak ka range bahut hi narrow tha, yani ki market mein bahut kam movement hua tha. Is pattern mein traders ye dekhte hain ki market mein range narrow hai aur iske baad market mein koi big move hone ki sambhavna hai. Isi big move ko traders apni advantage ke liye istemal karte hain.

      NR7 pattern ki trading strategy mein traders, market mein ek breakout ka wait karte hain. Jab market mein breakout hota hai, to traders long ya short positions lete hain. Agar breakout upward hota hai, to traders long positions lete hain aur agar breakout downward hota hai, to traders short positions lete hain.

      NR7 trading strategy pattern ki shuruat mein traders ko market ka trend aur momentum dekhna chahiye. Agar market mein trend aur momentum strong hai, to NR7 pattern ki koi guarantee nahi hai. Isliye traders ko market ke conditions ko dhyan mein rakhna bahut hi important hai.

      NR7 pattern ki trading strategy mein traders stop loss ka istemal karna na bhule. Stop loss ki madad se traders apni loss ko control kar sakte hain.
      NR7 pattern ki trading strategy mein traders ko market ke movement ko closely monitor karna chahiye. Agar market mein koi big move hone ki sambhavna nahi hai, to NR7 pattern ki trading strategy ko istemal nahi karna chahiye.

      NR7 pattern trading.

      Is tarah se NR7 pattern ki trading strategy ka istemal karke traders market mein apni trading performance ko improve kar sakte hain.
      منسلک شدہ فائلیں
      • #18 Collapse

        Pin bar candlestick pattern


        Click image for larger version

Name:	5.jpg
Views:	35
Size:	94.7 کلوبائٹ
ID:	12862723


        Pin bar candlestick pattern ek popular technical analysis tool hai jo traders dwara price action ko analyze karne ke liye istemal kiya jata hai. Ye pattern single candlestick se bana hota hai aur market sentiment ko represent karta hai.

        Pin bar candlestick pattern ko "pin bar" isliye kaha jata hai kyunki iski body ke dono sides mein ek lambi wick hoti hai, jise "pin" ya "tail" kehte hain, aur ek chhoti body hoti hai. Ye wick ya tail candlestick ke open ya close level se kafi lambi hoti hai, jabki body ke size chhoti hoti hai.

        Pin bar ko dono bullish aur bearish market conditions mein identify kiya ja sakta hai:
        1. Bullish Pin Bar: Bullish pin bar pattern jab market downtrend mein hota hai, tab form hota hai aur yeh ek potential trend reversal signal provide karta hai. Ismein candle ki body neeche ki taraf hoti hai aur lambi upper wick hoti hai. Ye indicate karta hai ki sellers initially control mein the, lekin phir buyers ne price ko upar le jaya.
        2. Bearish Pin Bar: Bearish pin bar pattern jab market uptrend mein hota hai, tab form hota hai aur yeh ek potential trend reversal signal provide karta hai. Ismein candle ki body upar ki taraf hoti hai aur lambi lower wick hoti hai. Ye indicate karta hai ki buyers initially control mein the, lekin phir sellers ne price ko niche le jaya.

        Pin bar patterns ko identify karne ke liye traders price charts ko closely observe karte hain. In patterns ko confirm karne ke liye, traders volume aur market context ko bhi consider karte hain. Agar pin bar candlestick ko significant support ya resistance levels ke near dekha jata hai, ya phir kisi important trend line ke pass, toh iska significance aur bhi badh jata hai.

        Pin bar patterns ko trading strategies mein incorporate karke traders trend reversals ko identify karte hain aur entry aur exit points ko define karte hain. Ye ek powerful tool hai jo traders ko market sentiment ko samajhne mein madad karta hai.


        • #19 Collapse

          Pin bar candlestick pattern:

          Dear trading partners Pin bar candlestick pattern yeh sarhad ki candle,aik aham technical analysis tool hai jo stick market aur forex trading mein use hota hai. Is pattern ka maqsad market ki mazid tafseelat maloom karna hai,khaas karke reversal points ko pehchanna.Yeh pattern aik single candlestick se banta hai,jo ke doosri candles se mukhtalif hoti hai.


          Bullish Pin bar candlestick pattern:

          Dear forex members Bullish Pin Bar pattern ki prabhavshilata aur sapatikaran ke liye ise dusre technical indicators aur market analysis ke saath use karein. Yeh pattern zaruri nahi hai ki hamesha safalta laye,isliye risk prabandhan aur stop-loss orders ka use zaroori hai.Bullish Pin Bar pattern ke alawa bhi market context aur trend ki madad se trade ka nirnay lein. Yadi aap Bullish Pin Bar Candlestick Pattern ko samjhte hain aur use karna chahte hain, to yeh ek sambhav bullish reversal signal ho sakta hai, lekin hamesha possible signal ko anya technique suchnaon aur risk prabandhan ke saath use karein.

          Bearish Pin bar candlestick pattern:

          Dear my friends Bearish pin bar candlestick pattern aik taqatwar muddat ki nishani hai jo aksar aik uptrend ke top par payi jati hai, aur ye aik potential trend reversal ki taraf ishara karti hai jo aik bearish direction ki taraf hota hai.Is pattern ki khasusiyat hai ke is mein aik choti si body aur lambi upper shadow ya wick hoti hai, jo body se kafi lambi hoti hai. Lower shadow ya wick ya toh maujood nahi hoti hai ya bahut choti hoti hai.Body ka rang bullish ya bearish ho sakta hai,lekin puri pattern bearish sentiment ko darshata hai.Pin bar candlestick ka chota sa body market mein indecision ko darshata hai, jahan na kharidne wale aur na bechne wale ko control mil paya hai. Lambi upper shadow ishara karti hai ke bears trading session mein price ko uncha karne mein kamyab rahe, lekin price close karne se pehle opening price ke pas ya usse niche ho gaya. Market ke participants ke dwara unchi keematon ka inkar ka ishara,aik mazboot bearish pressure ki tayari ka taseer rakhta hai.
          shadows.


          • #20 Collapse

            Pin bar candlestick pattern

            Click image for larger version

Name:	download - 2024-03-14T182022.419.png
Views:	36
Size:	2.2 کلوبائٹ
ID:	12864795


            Pin bar candlestick pattern ek popular technical analysis tool hai jo traders aur investors market analysis mein istemal karte hain. Ye pattern market mein potential reversals ya trend changes ko identify karne mein madadgar hota hai.

            Pin bar pattern ek single candlestick se bana hota hai aur iski key characteristics hain:
            1. Body aur Tails: Pin bar mein choti si body hoti hai, jo upper aur lower tails ke darmiyan hoti hai. Upper tail candlestick ke top se extend hoti hai aur lower tail candlestick ke bottom se extend hoti hai.
            2. Upper Tail: Upper tail ya shadow lambi hoti hai aur downward direction mein extend hoti hai. Ye indicate karta hai ke price ek point pe up

            ar gaya tha lekin phir se neeche gaya.
            1. Lower Tail: Lower tail bhi shadow ya tail hoti hai jo candlestick ke bottom se extend hoti hai, lekin iska direction upward hota hai. Ye indicate karta hai ke price ne neeche gira lekin phir se recover kiya.
            2. Body: Pin bar ka body chota hota hai aur ideally upper tail ke opposite side pe hota hai. Ye body buyers aur sellers ke darmiyan ki price range ko represent karta hai.

            Pin bar pattern bullish ya bearish ho sakta hai, depending on its location aur context. Bullish pin bar pattern jab market ke downtrend ke baad form hota hai, indicate karta hai ke buyers ne control lena shuru kiya hai aur trend reversal ho sakta hai. Oppositely, bearish pin bar pattern jab market ke uptrend ke baad form hota hai, suggest karta hai ke sellers ne control lena shuru kiya hai aur trend reversal ho sakta hai.

            Traders pin bar pattern ko confirm karne ke liye volume aur other technical indicators ka istemal karte hain. Agar yeh pattern high volume ke sath form hota hai, toh iska significance zyada hota hai. Lekin hamesha yaad rahe ke kisi bhi single indicator ya pattern pe rely na karein aur hamesha risk management ka khayal rakhein.


            • #21 Collapse

              What is Pin bar candlestick pattern.

              Dear trading partners Pin bar candlestick pattern yeh sarhad ki candle,aik aham technical analysis tool hai jo stick market aur forex trading mein use hota hai. Is pattern ka maqsad market ki mazid tafseelat maloom karna hai,khaas karke reversal points ko pehchanna.Yeh pattern aik single candlestick se banta hai,jo ke doosri candles se mukhtalif hoti hai.

              Bullish Pin bar candlestick pattern.

              Dear forex members Bullish Pin Bar pattern ki prabhavshilata aur sapatikaran ke liye ise dusre technical indicators aur market analysis ke saath use karein. Yeh pattern zaruri nahi hai ki hamesha safalta laye,isliye risk prabandhan aur stop-loss orders ka use zaroori hai.Bullish Pin Bar pattern ke alawa bhi market context aur trend ki madad se trade ka nirnay lein. Yadi aap Bullish Pin Bar Candlestick Pattern ko samjhte hain aur use karna chahte hain, to yeh ek sambhav bullish reversal signal ho sakta hai, lekin hamesha possible signal ko anya technique suchnaon aur risk prabandhan ke saath use karein.


              Bearish Pin bar candlestick pattern.

              Dear my friends Bearish pin bar candlestick pattern aik taqatwar muddat ki nishani hai jo aksar aik uptrend ke top par payi jati hai, aur ye aik potential trend reversal ki taraf ishara karti hai jo aik bearish direction ki taraf hota hai.Is pattern ki khasusiyat hai ke is mein aik choti si body aur lambi upper shadow ya wick hoti hai, jo body se kafi lambi hoti hai. Lower shadow ya wick ya toh maujood nahi hoti hai ya bahut choti hoti hai.Body ka rang bullish ya bearish ho sakta hai,lekin puri pattern bearish sentiment ko darshata hai.Pin bar candlestick ka chota sa body market mein indecision ko darshata hai, jahan na kharidne wale aur na bechne wale ko control mil paya hai. Lambi upper shadow ishara karti hai ke bears trading session mein price ko uncha karne mein kamyab rahe, lekin price close karne se pehle opening price ke pas ya usse niche ho gaya. Market ke participants ke dwara unchi keematon ka inkar ka ishara,aik mazboot bearish pressure ki tayari ka taseer rakhta hai.


              • #22 Collapse

                Pin bar candlestick pattern
                Click image for larger version

Name:	pinbar.png
Views:	37
Size:	3.6 کلوبائٹ
ID:	12867545

                I. Pin Bar Candlestick Pattern ki Introduction

                A. Pin Bar Ki Tafseeli Tashreeh - Pin bar ek popular price action pattern hai jo forex trading mein dekha jata hai. - Ye pattern market mein trend reversals aur trend continuations ko indicate karta hai.

                B. Pin Bar Ki Anatomy - Pin bar ek single candlestick pattern hota hai jisme ek lambi tail (ya shadow) hoti hai aur chhoti body hoti hai. - Tail high aur low prices ko represent karta hai aur body open aur close prices ko show karta hai.

                II. Pin Bar Pattern Ki Understanding

                A. Market Context - Pin bar pattern market ke trend reversals ya continuations ke signals ke roop mein dekha jata hai. - Ye pattern traders ko market sentiment aur price action ka insight deta hai.

                B. Psychological Aspects - Pin bar pattern ki formation market mein indecision aur reversal ke beech ki psychological battle ko represent karta hai. - Is pattern ke formation ke baad, traders ka sentiment reversal ya continuation ki taraf shift ho sakta hai.

                III. Key Characteristics of Pin Bar Pattern

                A. Long Tail - Pin bar pattern mein lambi tail ya shadow hoti hai jo indicate karta hai ki price movement mein sharp rejection hui hai. - Tail high ya low se exceed hoti hai aur price reversal ko indicate karti hai.

                B. Small Body - Pin bar pattern mein chhoti body hoti hai jo open aur close prices ke beech mein hoti hai. - Body ke chhotepan ka matlab hai ki market mein strong consensus nahi hai.

                IV. Trading Strategies with Pin Bar Pattern

                A. Entry Points - Agar pin bar pattern uptrend ke baad form hota hai, to traders selling positions enter kar sakte hain. - Agar pattern downtrend ke baad form hota hai, to traders buying positions enter kar sakte hain.

                B. Stop Loss aur Take Profit Levels - Stop loss orders ko pin bar ki high (in case of short positions) ya low (in case of long positions) ke above ya below lagaya jata hai. - Take profit levels ko support levels, resistance levels, ya previous swing highs/lows ke near tay kiya jata hai.

                V. Confirmation aur Validation

                A. Volume Analysis - Volume analysis pin bar pattern ko confirm karne mein madad karta hai. - Agar pattern ke formation ke waqt volume high hoti hai, to pattern ka validity increase hota hai.

                B. Other Technical Indicators - Other technical indicators jaise ki RSI, MACD, aur moving averages ka istemal pin bar pattern ko validate karne mein kiya ja sakta hai.

                VI. Practical Application

                A. Real-Life Examples - Real-life examples aur case studies traders ko pin bar pattern ka istemal samajhne mein madad karte hain. - Ye examples traders ko sahi samay par trades lenay aur exit karne mein guide karte hain.

                VII. Conclusion
                • Pin bar pattern ek powerful price action pattern hai jo traders ko market mein trend reversals aur continuations ka indication deta hai.
                • Proper confirmation aur validation ke sath, traders pin bar pattern ka istemal karke apne trading strategies ko improve kar sakte hain.
                • Risk management ke sath, traders is pattern ka sahi istemal karke profitable trades kar sakte hain aur apne trading performance ko enhance kar sakte hain.


                • #23 Collapse


                  What is Pin bar candlestick pattern in forex trading.

                  Dear trading partners Pin bar candlestick pattern yeh sarhad ki candle,aik aham technical analysis tool hai jo stick market aur forex trading mein use hota hai. Is pattern ka maqsad market ki mazid tafseelat maloom karna hai,khaas karke reversal points ko pehchanna.Yeh pattern aik single candlestick se banta hai,jo ke doosri candles se mukhtalif hoti hai.

                  Bullish Pin bar candlestick pattern and trade with bullish pin bar candlestick pattern.

                  Dear forex members Bullish Pin Bar pattern ki prabhavshilata aur sapatikaran ke liye ise dusre technical indicators aur market analysis ke saath use karein. Yeh pattern zaruri nahi hai ki hamesha safalta laye,isliye risk prabandhan aur stop-loss orders ka use zaroori hai.Bullish Pin Bar pattern ke alawa bhi market context aur trend ki madad se trade ka nirnay lein. Yadi aap Bullish Pin Bar Candlestick Pattern ko samjhte hain aur use karna chahte hain, to yeh ek sambhav bullish reversal signal ho sakta hai, lekin hamesha possible signal ko anya technique suchnaon aur risk prabandhan ke saath use karein.
                  example:


                  Bearish Pin bar candlestick pattern and trade with bearish candlestick pattern.

                  Dear my friends Bearish pin bar candlestick pattern aik taqatwar muddat ki nishani hai jo aksar aik uptrend ke top par payi jati hai, aur ye aik potential trend reversal ki taraf ishara karti hai jo aik bearish direction ki taraf hota hai.Is pattern ki khasusiyat hai ke is mein aik choti si body aur lambi upper shadow ya wick hoti hai, jo body se kafi lambi hoti hai. Lower shadow ya wick ya toh maujood nahi hoti hai ya bahut choti hoti hai.Body ka rang bullish ya bearish ho sakta hai,lekin puri pattern bearish sentiment ko darshata hai.Pin bar candlestick ka chota sa body market mein indecision ko darshata hai, jahan na kharidne wale aur na bechne wale ko control mil paya hai. Lambi upper shadow ishara karti hai ke bears trading session mein price ko uncha karne mein kamyab rahe, lekin price close karne se pehle opening price ke pas ya usse niche ho gaya. Market ke participants ke dwara unchi keematon ka inkar ka ishara,aik mazboot bearish pressure ki tayari ka taseer rakhta hai.


                  • #24 Collapse

                    **Pin Bar Candlestick Pattern: Forex Trading Mein Reversal Signal**
                    Forex trading mein candlestick patterns ka use market trends aur potential reversals ko identify karne ke liye kiya jata hai. In patterns mein se ek prominent pattern hai Pin Bar. Pin Bar pattern price reversals ko indicate karta hai aur trading decisions ko inform karne mein madad karta hai. Is post mein hum Pin Bar candlestick pattern ko detail mein samjhenge, iski characteristics, aur trading mein isko kaise use kiya jaye.

                    ### **Pin Bar Candlestick Pattern Ka Introduction:**

                    Pin Bar ek single candlestick pattern hota hai jo price reversal ko signal karta hai. Yeh pattern distinctive appearance rakhta hai, jisme ek lambi wick aur chhoti body hoti hai. Pin Bar ki body generally ek end par hoti hai aur iska ek long wick opposite direction mein hota hai. Yeh pattern ko identify karna aur samajhna zaroori hota hai, kyunki yeh market ke potential reversal points ko indicate karta hai.

                    ### **Pin Bar Ki Characteristics:**

                    1. **Long Wick:** Pin Bar ki sabse prominent feature uski lambi wick hoti hai. Wick market ke high aur low points ko represent karti hai aur price rejection ko indicate karti hai. Lambi wick ke hone se yeh pata chalta hai ke market ne ek certain level par reject kiya hai.

                    2. **Small Body:** Pin Bar ki body chhoti hoti hai aur generally ek end par hoti hai. Body ke chhote size se yeh indicate hota hai ke open aur close prices ke beech difference minimal hai, aur price rejection dominant hai.

                    3. **Reversal Signal:** Pin Bar pattern market ke potential reversal ko signal karta hai. Agar Pin Bar bullish trend ke end par appear hota hai, toh yeh bearish reversal ko indicate kar sakta hai, aur agar bearish trend ke end par appear hota hai, toh yeh bullish reversal ko indicate karta hai.

                    ### **Pin Bar Ka Trading Mein Use:**

                    1. **Identifying Reversal Points:** Pin Bar ko reversal points ko identify karne ke liye use kiya jata hai. Jab yeh pattern ek strong trend ke end par appear hota hai, toh yeh potential reversal ka signal hota hai. Traders is pattern ko dekh kar trade decisions le sakte hain.

                    2. **Support/Resistance Levels:** Pin Bar pattern ko support aur resistance levels ke around analyze karna zaroori hota hai. Agar Pin Bar support level ke near create hota hai aur lambi wick neeche hoti hai, toh yeh bullish reversal ka signal ho sakta hai. Similarly, agar yeh resistance level ke near hota hai aur lambi wick upar hoti hai, toh yeh bearish reversal ka signal hota hai.

                    3. **Confirmation:** Pin Bar ki effectiveness ko confirm karne ke liye additional indicators aur patterns ka use karna zaroori hai. For example, aap Moving Averages ya RSI (Relative Strength Index) se confirmation le sakte hain. Agar Pin Bar pattern ke saath ek strong indicator confirmation hota hai, toh yeh signal zyada reliable hota hai.

                    ### **Conclusion:**

                    Pin Bar candlestick pattern Forex trading mein ek important tool hai jo market reversals ko identify karne mein madad karta hai. Lambi wick aur chhoti body is pattern ki distinctive features hain jo price rejection aur potential reversal ko signal karte hain. Is pattern ko support/resistance levels aur additional indicators ke sath analyze karke aap apne trading decisions ko enhance kar sakte hain. Pin Bar pattern ko sahi tareeqe se samajh kar aur use karke aap market trends ko better predict kar sakte hain aur successful trades execute kar sakte hain.
                    • #25 Collapse

                      **Pin Bar Candlestick Pattern**
                      Pin Bar ek popular candlestick pattern hai jo trend reversal ya continuation ka signal deta hai. Yeh pattern market ke sharp price movements aur potential reversals ko highlight karta hai. Pin Bar ki details ko samajhne ke liye yeh points zaroori hain:

                      1. **Formation**:
                      - Pin Bar pattern ek single candlestick se banta hai jo ek distinctive shape banata hai.
                      - **Body**: Pin Bar ki body chhoti hoti hai aur candle ke ek end par located hoti hai.
                      - **Wick**: Candle ke doosre end par ek lamba wick (shadow) hota hai jo price ke significant movement ko show karta hai. Wick ki length body ke size se zyada hoti hai.
                      - **Tail**: Pin Bar ke tail ya wick ki length trend reversal ya price rejection ko dikhati hai.

                      2. **Types**:
                      - **Bullish Pin Bar**: Yeh pattern tab form hota hai jab market ek downtrend ke baad ek large lower wick aur chhoti body ke saath close hoti hai. Yeh bullish reversal ka signal deta hai.
                      - **Bearish Pin Bar**: Yeh pattern tab form hota hai jab market ek uptrend ke baad ek large upper wick aur chhoti body ke saath close hoti hai. Yeh bearish reversal ka signal deta hai.

                      3. **Significance**:
                      - Pin Bar pattern market ke price rejection aur trend reversal ko indicate karta hai. Yeh pattern traders ko market ke potential reversal points identify karne mein madad karta hai.
                      - Bullish Pin Bar market ke selling pressure se rejection ko dikhata hai aur buying pressure ke entry ka signal hota hai.
                      - Bearish Pin Bar market ke buying pressure se rejection ko dikhata hai aur selling pressure ke entry ka signal hota hai.

                      4. **Trading Strategy**:
                      - **Entry Point**: Pin Bar pattern ke formation ke baad, traders entry point consider karte hain. Bullish Pin Bar ke liye entry point typically wick ke highest point ke upar hota hai, aur Bearish Pin Bar ke liye entry point wick ke lowest point ke niche hota hai.
                      - **Stop-Loss**: Stop-loss ko Pin Bar ke opposite end par set kiya jata hai, jahan se market ki movement ko detect kiya gaya hai.
                      - **Profit Target**: Profit target ko market ke key support ya resistance levels ke around set kiya jata hai. Traders market ki price action aur previous levels ko dekh kar targets set karte hain.

                      5. **Limitations**:
                      - Pin Bar pattern ko confirm karne ke liye additional confirmation signals aur volume analysis zaroori hai.
                      - Pattern ke formation ke baad market ki overall behavior aur volatility ko bhi consider karna chahiye.
                      - Single Pin Bar pattern kabhi kabhi false signals bhi de sakta hai, isliye caution aur additional analysis zaroori hai.

                      Pin Bar candlestick pattern market ke reversal signals ko identify karne ke liye ek effective tool hai. Is pattern ko sahi tarike se use karne ke liye additional confirmation aur market analysis zaroori hai.
                      • <a href="https://www.instaforex.org/ru/?x=ruforum">InstaForex</a>
                      • #26 Collapse

                        Pin Bar Candlestick Pattern in Forex Trading

                        Forex trading mein, pin bar candlestick pattern ek bohot important tool hai jo traders ko market ki direction aur price action ko samajhne mein madad deta hai. Pin bar ek single candlestick hai jo ek specific structure aur formation rakhta hai, aur yeh market reversal ka indication de sakta hai.

                        Pin Bar Structure

                        Pin bar ka structure khas taur par ek lambi shadow (tail or wick) aur chhoti body se mil kar banta hai. Yeh shadow price ke rejection ko zahir karti hai, yani market ne ek specific price level ko accept nahi kiya. Pin bar ki direction uski body se indicate hoti hai. Agar pin bar bullish hai, toh iska matlab hai ke niche se shadow lambi hai aur upar ki taraf body chhoti hai. Wahi bearish pin bar mein upar se shadow lambi hoti hai aur niche ki taraf body chhoti hoti hai.

                        Identification

                        Pin bar ko identify karne ke liye traders kuch factors ko dekhte hain:

                        1. Long Tail (Shadow): Yeh market rejection ko darust tareeqe se dikhata hai. Jitni lambi tail hogi, utna hi price rejection ka indication mazboot hoga.

                        2 Short Body: Body ka size chhota hota ha, jo is baat ka indication deta hai ke opening aur closing prices ek dusre ke kareeb hain.

                        3. Context in the Trend: Pin bar ka trend ke sath context mein hona bohot zaroori hai. Yeh ya toh ek trend ke reversal ko zahir kar sakta hai ya phir ek strong support ya resistance level se price reversal ko indicate kar sakta hai.

                        Types of Pin Bars

                        1. Bullish Pin Bar: Yeh usually downtrend ke end mein banta hai aur price ke upar ki taraf reversal ka indication deta hai. Ismein lower tail lambi hoti hai.

                        2. Bearish Pin Bar: Yeh uptrend ke end mein banta hai aur price ke niche ki taraf reversal ka indication deta hai. Ismein upper tail lambi hoti hai.

                        Trading Pin Bars

                        Traders pin bar patterns ko identify karne ke baad kuch trading strategies apna sakte hain:

                        - Entry: Pin bar ke formation ke baad market ke trend ko dekhtay hue entry ki ja sakti hai. Bullish pin bar ke liye, price ki closing ke baad buy position li ja sakti hai, aur bearish pin bar ke liye, price ki closing ke baad sell position.

                        - Stop Loss: Stop loss order pin bar ke tail ke opposite end par lagana chahiye, taake agar market unexpected direction mein chala jaye toh zyada loss na ho.

                        - Take Profit: Profit targets market structure aur support/resistance levels ko dekh kar set kiye ja sakte hain.

                        Pin bar candlestick pattern Forex trading mein bohot valuable tool hai, lekin isse tanha istamal karne ke bajaye, doosre technical indicators aur analysis ke sath combine karke dekha jaye toh behtar results milte hain. Yeh pattern market ki psychology aur price action ko samajhne mein madadgar hota hai, jo kisi bhi trader ke liye faida mand ho sakta hai.

                        اب آن لائن

                        Working...
                        X