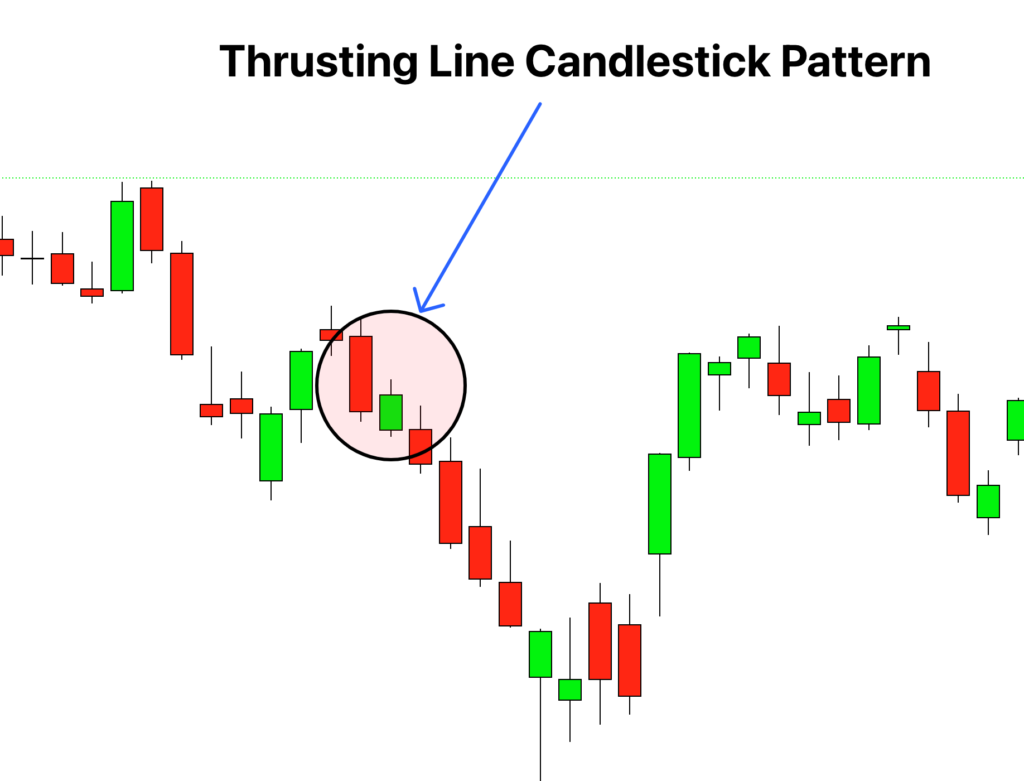
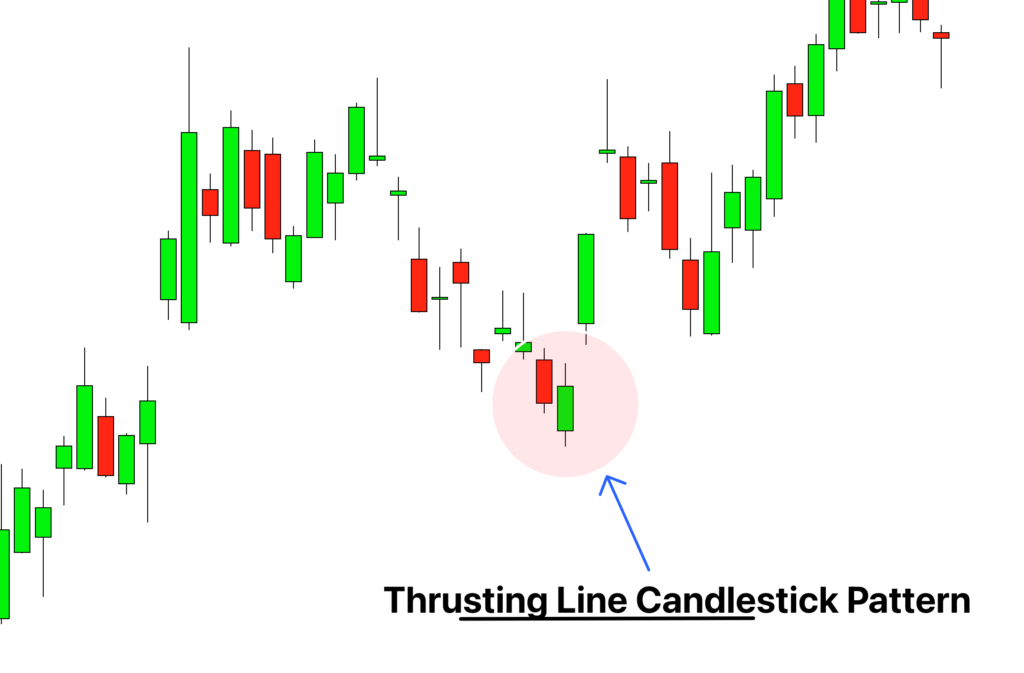
Thrusting Line Candlestick Pattern:

No announcement yet.
`
X
  • وقت
  • دکھائیں
Clear All
new posts
  • #1 Collapse

    Thrusting Line Candlestick Pattern:
    Overview of Thrusting Line Candlestick Pattern:


    Thrusting line candlestick pattern forex market mein chal rahe downtrend ke dauran hone wala ek takatwar reversal pattern hota hai. Ye pattern do consecutive candlestickska mil kar banta hai: ek bearish candle, jisme typically bada size aur lamba body hota hai, jo strong selling pressure ko darshata hai, aur ek bullish candle, jo pehle candle ke close se neeche khulta hai, lekin bearish candle ki body ka midpoint se oopar close karta hai. Isse samajh me aata hai ki despite initial selling pressure, buyers ne prices ko upar push kar liya hai.


    Interpretation of the Thrusting Line Candlestick Pattern:


    Thrusting line pattern yeh dikhata hai ki buyers takatwar ho rahe hai aur current downtrend ko reverse kar sakte hai. Jab yeh pattern banata hai, toh iska matlab hai ki selling pressure khatam hone wala hai aur buyers aa rahe hai. Lekin trading decisions lene se pehle dusre technical indicators aur price action confirmation ko bhi dhyan me rakhna zaroori hai.


    Confirmation and Filtering Factors for the Thrusting Line Candlestick Pattern:


    Thrusting line pattern ko trade karne se pehle confirmation ka intezar karna zaroori hai. Traders often aur technical tools aur patterns ka istemaal karte hai thrusting line signal ko validate karne ke liye. For example, traders bullish candlestick patterns ko dekh sakte hai, jaise bullish engulfing ya piercing patterns, jo reversal ko confirm karte hai. Additionally, traders technical indicators jaise moving averages aur trendlines ka istemaal karte hai pattern ki validity ko confirm karne ke liye.


    Stop Loss Placement and Take Profit Targets for the Thrusting Line Candlestick Pattern:


    Thrusting line pattern trade karte waqt sahi risk management measures ko set karna zaroori hai. Aam taur par stop loss order bearish candlestick ki low ke neeche place kiya jata hai, jisse market volatility ke liye ek chota buffer ho. Take profit targets ke liye, traders aksar previous support ya resistance levels ko exit points ke taur par use karte hai. Additionally, traders trailing stops ka istemaal kar sakte hai agar market favorable direction me move karti hai, takay further gains capture kiye ja sake.


    Trade Example Using the Thrusting Line Candlestick Pattern:


    Chaliye ek example ke through samjhte hai ki thrusting line pattern ko trade kaise kiya jata hai. Sochiye market consistent downtrend me hai aur ek thrusting line pattern ban raha hai. Traders wait kar sakte hai ki agle candle bearish candle ke midpoint ke upar close ho jaane ke baad long trade me enter ho. Vo stop loss order bearish candle ki low ke neeche place karenge aur take profit target pehle resistance level pe set karenge. Traders closely trade ko monitor karenge aur stop loss ya take profit levels ko market progress ke hisaab se adjust karenge. Ye zaroori hai ki proper risk management aur confirmation dusre technical tools se hamesha dhyan me rakha jaaye jab thrusting line pattern trade kiya jaaye.
  • <a href="https://www.instaforex.org/ru/?x=ruforum">InstaForex</a>
  • #2 Collapse

    Assalamu Alaikum Dosto!

    Thrusting Line Candlestick Pattern


    Thrusting Line Pattern forex trading mein ek continuation pattern hai. Is pattern mein ek uptrend ya downtrend ke baad ek candlestick formation hoti hai, jise thrusting line pattern kehte hain. Is pattern ka interpretation price movement aur market sentiment ko samajhne mein madad karta hai. Thrusting Line Pattern, jo ke technical analysis mein use hota hai, candlestick charts par dikhne wala strong indication deta hai. Yeh pattern bullish ya bearish trend ke beech mein dikhta hai aur price movement ko predict karne mein madad karta hai. Thrusting Line Pattern ek do-candlestick pattern hota hai, jismein do consecutive candles shamil hoti hain.

    Click image for larger version

Name:	images - 2024-01-21T104400.017.png
Views:	56
Size:	14.0 کلوبائٹ
ID:	12811858

    Bullish & Bearish Thrusting Line Pattern


    Bullish thrusting line pattern uptrend ke baad dikhai deta hai. Is pattern mein ek uptrend ke baad do consecutive candlesticks hote hain. Pehla candlestick ek strong bullish candle hota hai, jabki dusra candlestick bearish hai. Bullish thrusting line pattern mein dusri candlestick pehli candlestick ke andar open hoti hai aur bullish candlestick ke closing price se neeche close karti hai. Yeh pattern bullish trend ki continuation ko suggest karta hai, jiska matlab hai ki uptrend jari rahega. Pattern ek bullish continuation pattern hota hai, jiska matlab hai ke market mein bullish trend continue hone ki indication hai. Is pattern mein pehli candle red (bearish) hoti hai, jo ke ek downtrend ko indicate karti hai. Dusri candle green (bullish) hoti hai aur iski closing price pehli candle ke midpoint se kam distance par rehti hai. Bullish candle ki body, pehli candle ki body ke andar rehti hai, lekin iske high pehli candle ki high se oopar hota hai.
    Bearish thrusting line pattern downtrend ke baad dikhai deta hai. Is pattern mein ek downtrend ke baad do consecutive candlesticks hote hain. Pehla candlestick ek strong bearish candle hota hai, jabki dusra candlestick bullish hai. Bearish thrusting line pattern mein dusri candlestick pehli candlestick ke andar open hoti hai aur bearish candlestick ke closing price se upar close karti hai. Yeh pattern bearish trend ki continuation ko suggest karta hai, jiska matlab hai ki downtrend jari rahega. Pattern ek bearish continuation pattern hota hai, jiska matlab hai ke market mein bearish trend continue hone ki indication hai. Is pattern mein pehli candle green (bullish) hoti hai, jo ke ek uptrend ko indicate karti hai. Dusri candle red (bearish) hoti hai aur iski closing price pehli candle ke 50% se kam distance par rehti hai. Bearish candle ki body, pehli candle ki body ke andar rehti hai, lekin iske low pehli candle ki low se neeche hota hai.


    Explaination Thrusting Line Pattern


    Forex trading me Thrusting Line Pattern, ya Thrusting Line analysis, ek trend continuation pattern hai jo k baaz awqat trend reversal k leye bhi use kiya jata hai. Ye pattern do candlestick se mel kar banta hai jo ek existing trend mein aata hai. Is candlestick ke opening price gaping away hote hain, prevailing trend ki taraf. Lekin is candlestick ke closing price window (gap) immediately close kar jata hai aur real body of the previous candlestick mein penetrate kar jata hai. Kadam-e-kam, is candlestick ke closing ke baad, bohot si shadow bhi aata hai, jisse wo Opening Bozu ban jata hai. Bullish Thrusting Line Pattern, ye pattern ek existing downtrend mein aata hai. Lekin ye pattern ek bullish trend ko bhi signal kar sakta hai, jab wo ek uptrend mein aata hai. Traders is pattern ko apni technical analysis ke hisab se istemal karke potential entry aur exit points ko identify kar sakte hain. Isko wo doosre technical indicators aur risk management strategies ke saath istemal karke informed trading decisions aur risk ko effectively manage kar sakte hain. Lekin yeh bhi important hai ke no single pattern or indicator should be used in isolation, aur traders ko always doosre factors ko consider karna chahiye aur multiple forms of analysis ko use karna chahiye jab trading decisions liye jayein.

    Pattern Characteristics

    Bullish Thrusting Line candlestick pattern ek trend continuation pattern hai jo kabhi-kabhi trend reversal pattern ke taur par istemal kiya ja sakta hai. Is mein do candles shamil hote hain, jisme pehli candle bearish hoti hai aur dusri candle bullish hoti hai jo ke pehle candle ke close se neeche khulta hai lekin pehle candle ke real body ke midpoint se upar band hoti hai. Dusri candlestick ko bhi lambi real body aur chhoti upper shadow honi chahiye. Yeh pattern yeh darust kar sakta hai ke bullish momentum itna majboot hai ke woh bearish dabav ko paar karke upward trend ko continue kar sakta hai. Magar traders ko is pattern par pura bharosa nahi karna chahiye aur isey doosre technical indicators aur analysis ke saath mila kar istemal karna chahiye taake woh zyada soch samajh kar trading faislay le saken. Yeh bhi ahem hai ke yaad kiya jaye ke yeh pattern hamesha bharosa mand nahi hota aur ise ek zyada comprehensive analysis ka hissa banane ke liye istemal karna chahiye takay potential entry aur exit points ko pehchan sakein aur risk ko behtar taur par manage kar sakein.

    Click image for larger version

Name:	images - 2024-01-21T104343.853.png
Views:	52
Size:	1.8 کلوبائٹ
ID:	12811859

    Difference Between Continuation & Reversal Patterns


    Thrusting Line candlestick pattern ko continuation, neutral, ya reversal pattern mein categorize kiya ja sakta hai. Continuation pattern mein, doosri candle pehli candle ke close se kafi neeche khulti hai aur uske close ke qareeb band hoti hai, jise yeh darust karta hai ke ek kamzor bullish move hai aur downward trend ka jari rakhna mumkin hai. Neutral pattern mein, doosri candle neeche khulti hai lekin phir pehli candle ke close se oopar chali jati hai, jo ek neutral se le kar bullish thrusting pattern ko sujhata hai aur iske baad ke candles mein price ke upar jane ki mumkinat ko darust karta hai. Reversal pattern mein, doosri candle pehli candle ke close se kafi neeche khulti hai aur uske close ke qareeb band hoti hai, jise yeh darust karta hai ke ek kamzor bullish move hai aur downward trend ka jari rakhna mumkin hai. Is liye, continuation aur reversal thrusting line candlestick pattern mein farq future price movement ke lehaz se hota hai: continuation pattern current trend ka jari rakhne ki mumkinat ko sujhata hai, jabke reversal pattern trend mein tabdeeli ki mumkinat ko darust karta hai. Traders in patterns ka istemal buying ya selling pressure ki taqat ka andaza lagane aur potential price movements ko anayat karnay ke liye karte hain.

    Trading


    Thrusting line pattern trading mein traders is pattern ka istemal karte hain market ke future direction ko predict karne ke liye. Is pattern ko samajhne ke liye traders candlestick chart analysis aur technical indicators ka istemal karte hain. Agar ek trader bullish thrusting line pattern observe karta hai, toh wo ek long position le sakta hai ya existing long position ko hold kar sakta hai. Is pattern ki presence bullish trend ki continuation ko indicate karti hai, jiske karan traders ko ek potential buying opportunity mil sakti hai. Vaise hi, agar bearish thrusting line pattern observe kiya jata hai, toh trader ek short position le sakta hai ya existing short position ko hold kar sakta hai. Is pattern ki presence bearish trend ki continuation ko indicate karti hai, jiske karan traders ko ek potential selling opportunity mil sakti hai. Thrusting line pattern trading mein stop loss aur target levels ka sahi istemal karna bhi zarrori hota hai. Traders ko risk management ka dhyan rakhna chahiye aur stop loss levels ko properly set karna chahiye taaki unki trades ko protect kiya ja sake.

    • #3 Collapse

      Trusting Line Candlestick pattern

      Introduction:
      Dear forex members, Thrusting Line candlestick Pattern forex trading main continuation pattern hy. Is pattern main ik uptrend ya downtrend ke baad aik candlestick formation hoti hy, jise thrusting line pattern kehte hain. Is pattern ka interpretation price movement aur market sentiment ko samajhne main madad karta hy. Thrusting Line Pattern, jo ke technical analysis main use hota hy, candlestick charts par dikhne wala strong indication deta hy. Ye pattern bullish ya bearish trend ke beech main dikhta hy aur price movement ko predict karne main madad karta hy. Thrusting Line Pattern ik do-candlestick pattern hota hy, jismain do consecutive candles shamil hoti hain.


      Importance of Trusting line candlestick pattern:
      Dear buddies, Forex trading me Thrusting Line Pattern, ya Thrusting Line analysis, ik trend continuation pattern hy jo k baaz awqat trend reversal k leye bhi use kiya jata hy. Ye pattern do candlestick se mel kar banta hy jo ik existing trend main aata hy. Is candlestick ke opening price gaping away hote hain, prevailing trend ki taraf. Likin is candlestick ke closing price window (gap) immediately close kar jata hy aur real body of the previous candlestick main penetrate kar jata hy. Kadam-e-kam, is candlestick ke closing ke baad, bohot si shadow bhi aata hy, jis se wo Opening Bozu ban jata hy. Bullish Thrusting Line Pattern, ye pattern ik existing downtrend main aata hy.

      How can we use Bearish Trusting Line:

      Dear friends, Bearish Thrusting Line pattern ka istemal market trend reversal ke liye hota hy. Agar aap is pattern ko sahi tarah se samajh lete hain, to ye aapko behtar trading decisions lene main madadgar ho sakta hy. Neeche diye gaye tareeqay se Bearish Thrusting Line ka istemal kiya ja sakta hy.
      • #4 Collapse

        Click image for larger version  Name:	download.png Views:	0 Size:	2.7 کلوبائٹ ID:	12812722

        Thrusting Line Candlestick Pattern, ek reversal candlestick pattern hai jo market trends ko indicate karta hai. Yeh pattern typically downtrend ke dauran aata hai. Niche diye gaye mukammal tafseeli points mein iski wazehat hai:
        Shuruaat:

        Thrusting Line pattern ek downtrend ke baad aata hai.Pehle candlestick bearish hoti hai.

        Dusri Candle (Bullish):

        Dusri candle bullish hoti hai, yani ke price me izafah hota hai.Lekin, iski closing price pehle bearish candle ki closing price se neeche hoti hai.

        Bearish Candle ki Closing:

        Thrusting Line ka jo bearish candle hota hai, uski closing price bullish candle ke upper shadow (wicks) ke andar rehti hai.Volume:Volume ki bhi madad se is pattern ko confirm kiya ja sakta hai. Agar dusri candle ke sath badh raha hai, toh ye pattern aur bhi majboot hota hai.

        Confirmation:

        Is pattern ko samajhne ke liye, traders ko dusre technical indicators ka bhi istemal karna chahiye. Jaise ke RSI, MACD, ya moving averages.

        ​​​​​​Reversal Signal:

        Thrusting Line, bearish trend ko kamzor hone ka signal deta hai, lekin ye confirmatory signals ke sath istemal karna zaroori hai.Yeh points traders ko market ke trend mein hone wale possible reversals ke bare mein agah karte hain, lekin hamesha yaad rakhein ke kisi bhi pattern ki mukammal tafseelat aur confirmation ke liye market analysis ki zarurat hoti hai.

        Thrusting Line Candlestick Pattern, ya pattern market mein jab price downtrend mein hoti hai aur ek bearish candle ke baad ek bullish candle aati hai, lekin ye bullish candle pehle wale bearish candle ke closing price se neeche close hoti hai. Ye pattern indicate karta hai ke bearish momentum kamzor ho sakta hai, lekin confirmatory signals ki zarurat hoti hai.
        • #5 Collapse

          Thrusting Line Candlestick pattern.

          Introduction:

          Dear forex members, Thrusting Line candlestick Pattern forex trading main continuation pattern hy. Is pattern main ik uptrend ya downtrend ke baad aik candlestick formation hoti hy, jise thrusting line pattern kehte hain. Is pattern ka interpretation price movement aur market sentiment ko samajhne main madad karta hy. Thrusting Line Pattern, jo ke technical analysis main use hota hy, candlestick charts par dikhne wala strong indication deta hy. Ye pattern bullish ya bearish trend ke beech main dikhta hy aur price movement ko predict karne main madad karta hy. Thrusting Line Pattern ik do-candlestick pattern hota hy, jismain do consecutive candles shamil hoti hain.


          Importance of Thrusting line candlestick pattern:

          Dear buddies, Forex trading me Thrusting Line Pattern, ya Thrusting Line analysis, ik trend continuation pattern hy jo k baaz awqat trend reversal k leye bhi use kiya jata hy. Ye pattern do candlestick se mel kar banta hy jo ik existing trend main aata hy. Is candlestick ke opening price gaping away hote hain, prevailing trend ki taraf. Likin is candlestick ke closing price window (gap) immediately close kar jata hy aur real body of the previous candlestick main penetrate kar jata hy. Kadam-e-kam, is candlestick ke closing ke baad, bohot si shadow bhi aata hy, jis se wo Opening Bozu ban jata hy. Bullish Thrusting Line Pattern, ye pattern ik existing downtrend main aata hy.

          How can we use Bearish Thrusting Line:

          Dear friends, Bearish Thrusting Line pattern ka istemal market trend reversal ke liye hota hy. Agar aap is pattern ko sahi tarah se samajh lete hain, to ye aapko behtar trading decisions lene main madadgar ho sakta hy. Neeche diye gaye tareeqay se Bearish Thrusting Line ka istemal kiya ja sakta hy.


          The psychology behind the thrusting line candlestick pattern is explained in two steps.
          ​​​​​


          • #6 Collapse

            Bullish Thrusting Line pattern uptrend ke baad nazar aata hai. Is pattern mein do consecutive candlesticks hote hain. Pehla candlestick ek strong bullish candle hota hai, jabki dusra candlestick bearish hota hai. Bullish Thrusting Line pattern mein dusri candlestick pehli candlestick ke andar open hoti hai aur bullish candlestick ke closing price se neeche close karti hai. Yeh pattern bullish trend ki continuation ko suggest karta hai, jiska matlab hai ki uptrend jari rahega.

            Yeh pattern ek bullish continuation pattern hai, jiska matlab hai ki market mein bullish trend continue hone ki indication hai. Is pattern mein pehli candle red (bearish) hoti hai, jo ek downtrend ko darust karti hai. Dusri candle green (bullish) hoti hai aur iski closing price pehli candle ke midpoint se kam distance par rehti hai. Bullish candle ki body, pehli candle ki body ke andar rehti hai, lekin iske high pehli candle ki high se oopar hota hai.

            Bearish Thrusting Line pattern downtrend ke baad dikhai deta hai. Is pattern mein ek downtrend ke baad do consecutive candlesticks hote hain. Pehla candlestick ek strong bearish candle hota hai, jabki dusra candlestick bullish hota hai. Bearish Thrusting Line pattern mein dusri candlestick pehli candlestick ke andar open hoti hai aur bearish candlestick ke closing price se upar close karti hai. Yeh pattern bearish trend ki continuation ko suggest karta hai, jiska matlab hai ki downtrend jari rahega.

            Yeh pattern ek bearish continuation pattern hai, jiska matlab hai ki market mein bearish trend continue hone ki indication hai. Is pattern mein pehli candle green (bullish) hoti hai, jo ek uptrend ko darust karti hai. Dusri candle red (bearish) hoti hai aur iski closing price pehli candle ke 50% se kam distance par rehti hai. Bearish candle ki body, pehli candle ki body ke andar rehti hai, lekin iske low pehli candle ki low se neeche hota hai.

            Thrusting Line Pattern forex trading mein ek trend continuation pattern hai, jo existing trend ke sath judta hai. Traders is pattern ko technical analysis mein istemal karke potential entry aur exit points ko pehchan sakte hain. Lekin yaad rahe ke kisi single pattern ya indicator ko tanha mein istemal nahi karna chahiye, aur hamesha doosre factors aur analysis forms ko bhi mad-e-nazar rakha jaye.
            • #7 Collapse

              Thrusting line candlestick pattern ek technical analysis tool hai jo market trends aur price movements ko samajhne me madad karta hai. Is pattern ka istemal traders aur investors market ke future movements ka andaza lagane ke liye karte hain, iski kuch important details yeh hain,

              1. Thrusting Line Candlestick Pattern:

              Thrusting line pattern ek bullish continuation pattern hai jo bearish trend ke beech me aata hai. Is pattern me do consecutive candlesticks hote hain, jis me pehla candle bearish hota hai aur dusra candle usko follow karta hai lekin pura bearish candle ko cover nahi karta,

              2. Pattern ki Formation:

              Thrusting line pattern banane ke liye, pehle din ka candle bearish hoti hai aur doosre din ki candle bhi bearish open hoti hai lekin throughout the day bullish movement hoti hai aur candle ka close pehle din ke bearish candle se neeche hota hai,

              Click image for larger version

Name:	images(8).jpg
Views:	63
Size:	11.1 کلوبائٹ
ID:	12813021

              3. Thrusting Line Pattern Ka Significance:

              Thrusting line pattern ka hona yeh darust karne me madad karta hai ke bearish trend ke baad market me buying interest bani hui hai aur bullish trend shuru hone wala hai,

              4. Technical Analysis Ke Liye Ahmiyat:

              Is pattern ko samajh kar traders aur investors market me hone wale future movements ko predict kar sakte hain, jo ke unke trading decisions par asar daal sakta hai,

              5. Thrusting Line Pattern Ka use:

              Traders ko chahiye ke is pattern ko sahi tarah se samajh kar, market conditions ke mutabiq istemal karein aur apne trading plan ko iske mutabiq adjust karein,

              6. Examples of Thrusting Line Patterns:

              Historical charts par thrusting line patterns ke examples dekhein aur samjhein ke kaise yeh pattern market movements ko predict karne me madadgar ho sakta hai,

              7. Thrusting Line Pattern Ke Challenges:

              Yeh bhi dekha jaye ke thrusting line pattern ke istemal me kya challenges aa sakte hain aur traders ko kaise inka samna karna chahiye.
              • #8 Collapse


                Trusting Line Candlestick pattern

                Introduction:
                Dear forex members, Thrusting Line candlestick Pattern forex trading main continuation pattern hy. Is pattern main ik uptrend ya downtrend ke baad aik candlestick formation hoti hy, jise thrusting line pattern kehte hain. Is pattern ka interpretation price movement aur market sentiment ko samajhne main madad karta hy. Thrusting Line Pattern, jo ke technical analysis main use hota hy, candlestick charts par dikhne wala strong indication deta hy. Ye pattern bullish ya bearish trend ke beech main dikhta hy aur price movement ko predict karne main madad karta hy. Thrusting Line Pattern ik do-candlestick pattern hota hy, jismain do consecutive candles shamil hoti hain.


                Importance of Trusting line candlestick pattern:
                Dear buddies, Forex trading me Thrusting Line Pattern, ya Thrusting Line analysis, ik trend continuation pattern hy jo k baaz awqat trend reversal k leye bhi use kiya jata hy. Ye pattern do candlestick se mel kar banta hy jo ik existing trend main aata hy. Is candlestick ke opening price gaping away hote hain, prevailing trend ki taraf. Likin is candlestick ke closing price window (gap) immediately close kar jata hy aur real body of the previous candlestick main penetrate kar jata hy. Kadam-e-kam, is candlestick ke closing ke baad, bohot si shadow bhi aata hy, jis se wo Opening Bozu ban jata hy. Bullish Thrusting Line Pattern, ye pattern ik existing downtrend main aata hy.

                How can we use Bearish Trusting Line:
                Dear friends, Bearish Thrusting Line pattern ka istemal market trend reversal ke liye hota hy. Agar aap is pattern ko sahi tarah se samajh lete hain, to ye aapko behtar trading decisions lene main madadgar ho sakta hy. Neeche diye gaye tareeqay se Bearish Thrusting Line ka istemal kiya ja sakta hy.
                • #9 Collapse

                  Thrusting Line Candlestick Pattern

                  Forex market participants often rely on technical analysis to make informed trading decisions. One of the candlestick patterns frequently observed is the "Main Thrusting Line." This pattern holds significance as it provides insights into potential market reversals. Let's delve into a detailed explanation of the Main Thrusting Line Candlestick Pattern.

                  Click image for larger version

Name:	images.png
Views:	48
Size:	7.5 کلوبائٹ
ID:	12816359


                  Understanding Candlestick Patterns
                  Candlestick patterns are graphical representations of price movements in financial markets, indicating the psychological dynamics between buyers and sellers. The Main Thrusting Line is a two-candle pattern that typically occurs during a market downtrend, suggesting a potential shift in sentiment.

                  Identification of the Main Thrusting Line Pattern
                  Downtrend Scenario
                  The Main Thrusting Line is most relevant in a prevailing downtrend.
                  Traders should identify a series of bearish candles preceding the pattern.

                  First Candle - Bearish
                  The pattern begins with a long bearish candle, signifying the dominance of sellers.
                  This candle reinforces the existing downtrend sentiment.

                  Second Candle - Bullish
                  The following candle is a bullish candle that opens lower than the previous close.
                  It then rallies, closing above the midpoint of the first bearish candle.

                  Interpreting the Main Thrusting Line Pattern
                  Bearish Momentum Exhaustion
                  The Main Thrusting Line indicates a potential exhaustion of bearish momentum.
                  The fact that the second candle closes above the midpoint of the first suggests a weakening bearish stance.

                  Market Reversal Signal
                  Traders view this pattern as a potential signal for a trend reversal.
                  The shift from a strong bearish sentiment to a bullish candle closing higher signals a possible change in market directions.

                  Key Considerations and Best Practices
                  Confirmation with Other Indicators
                  Successful trading involves considering multiple factors. Confirm the Main Thrusting Line with other technical indicators for increased reliability.

                  Volume Analysis
                  Analyze trading volume alongside the pattern. A surge in volume during the bullish candle adds credibility to the potential reversal.

                  Risk Management
                  Implement effective risk management strategies, such as setting stop-loss orders, to mitigate potential losses.

                  Applying the Main Thrusting Line
                  Consider a currency pair experiencing a prolonged downtrend. The Main Thrusting Line pattern emerges, consisting of a strong bearish candle followed by a bullish candle closing above the midpoint of the bearish one. Traders interpret this as a signal to reassess their bearish bias, potentially preparing for a bullish reversal.

                  Limitations of the Main Thrusting Line Pattern
                  False Signals
                  Like any technical analysis tool, the Main Thrusting Line is not foolproof. False signals may occur, emphasizing the importance of supplementary analysis.

                  Market Conditions
                  Market conditions can influence the pattern's effectiveness. High volatility or news events may impact its reliability.
                  • #10 Collapse

                    Thrusting Line Candlestick Pattern: kai hai

                    Click image for larger version

Name:	download (29).png
Views:	51
Size:	8.0 کلوبائٹ
ID:	12816366

                    "Thrusting Line" ek candlestick pattern hai jo market analysis mein istemal hota hai aur ye bearish trend continuation ko indicate karta hai. Ye pattern do candlesticks se banta hai aur market mein downward move ko darust karta hai.

                    Key Features of Thrusting Line:
                    1. Appearance (Zahiri Surat):
                      • Thrusting Line pattern do candlesticks se banta hai. Pehli candlestick ek bearish (downward) candle hoti hai, jabki dusri candlestick ek bullish (upward) candle hoti hai.
                    2. Candles' Relationship:
                      • Pehli candle ki range (high se low) ke andar hone ke baad, dusri candle ke opening price lower hoti hai pehli candle ke closing price se, lekin closing price pehle candle ke halfway ke pass hoti hai.
                    3. Color of Candles:
                      • Pehli candle bearish (downward) hoti hai aur dusri candle bullish (upward) hoti hai. Dusri candle ki body pehli candle ki body ke andar hoti hai.
                    4. Volume Analysis:
                      • Thrusting Line pattern ko confirm karne ke liye, traders volume analysis bhi karte hain. Agar dusri candle ki volume significant hai, toh pattern ki strength increase hoti hai.

                    Interpretation of Thrusting Line:

                    Thrusting Line pattern bearish trend ke continuation ko darust karta hai. Is pattern ke appearance ke baad, traders expect karte hain ke market mein downtrend jaari rahega.

                    Trading with Thrusting Line:
                    1. Confirmation:
                      • Thrusting Line pattern ko confirm karne ke liye, traders doosre technical indicators aur market conditions ka bhi dhyan rakhte hain.
                    2. Entry Point (Daakhil Hone Ka Point):
                      • Agar Thrusting Line pattern ko dekhte hain aur confirmatory signals bhi indicate karte hain, toh traders short position le sakte hain.
                    3. Stop-Loss Order (Stop-Loss Order):
                      • Har trading decision ke sath, stop-loss order ka istemal karna zaroori hai. Isse aap apne risk ko control mein rakh sakte hain.
                    4. Target Levels (Nishana Levels):
                      • Thrusting Line ke appearance ke basis par, traders target levels set karte hain jahan se woh expect karte hain ke price neeche jaayega.

                    Thrusting Line pattern ke sath trading karne se pehle, traders ko market conditions aur surrounding factors ka bhi dhyan rakhna important hai.
                    • <a href="https://www.instaforex.org/ru/?x=ruforum">InstaForex</a>
                    • #11 Collapse

                      Thrusting Line Candlestick Pattern: kai hai

                      Thrusting Line Candlestick Pattern ek do-candle pattern ha jo ek bearish continuation pattern ha. Yah pattern ek long black candle se shuru hota ha, jise ek long white candle follow karta ha. Long white candle ka opening vala price, previous candle ke closing price se niche hota ha. White candle ka closing price, previous candle ke body ke midpoint ke aas paas hota ha.

                      Click image for larger version

Name:	images.png
Views:	50
Size:	8.1 کلوبائٹ
ID:	12816420


                      Thrusting Line Pattern ka matlab ha ki bulls ne ek short term rally ki koshish ki, lekin unhen kisi bhi acchi rally ko maintain karne men nahin kamyab hua. Yah pattern bearish trend ka continuation ka ek strong indicator ha.

                      Thrusting Line Pattern ko identify karne ke liye, aapko ine 4 points ko check karna chahiye:
                      • Pahla candle ek long black candle ha.
                      • Dusra candle ek long white candle ha.
                      • Dusre candle ka opening vala price, previous candle ke closing price se niche hota ha.
                      • Dusre candle ka closing price, previous candle ke body ke midpoint ke aas paas hota ha.

                      Thrusting Line Pattern ko identify karne ke baad, aap is pattern ke basis per trading strategy develop kar sakte hain. Aap is pattern ko short selling ke liye use kar sakte hain.

                      Thrusting Line Pattern ka strength ine factors per depend karta ha:
                      • Pattern ke candles ka size.
                      • Pattern ke candles ki volume.
                      • Pattern ke baad ki price action.

                      Agar pattern ke candles bade hain aur unke sath badi volume bhi hai, to pattern ki strength badh jati ha. Aur agar pattern ke baad price action bearish ha, to pattern ki strength aur bhi badh jati ha.

                      Thrusting Line Pattern ek powerful bearish continuation pattern ha. Agar aap is pattern ko identify kar sakte hain, to aap is pattern ke basis per profitable trades kar sakte hain.

                      اب آن لائن

                      Working...
                      X