Meeting line candle pattern ek technical analysis tool hai jo market trends ko identify karne mein madad karta hai. Yeh pattern commonly price reversals ko detect karne mein istemal hota hai. Meeting line pattern, do candles se banta hai, jisme pehli candle bearish hoti hai aur dusri candle bullish hoti hai.
Jab yeh pattern banata hai, iska matlab hota hai ke market mein indecision hai aur bears aur bulls mein balance hai. Pehli candle mein market downtrend mein hoti hai, lekin dusri candle mein price recover karti hai aur uptrend shuru hota hai.
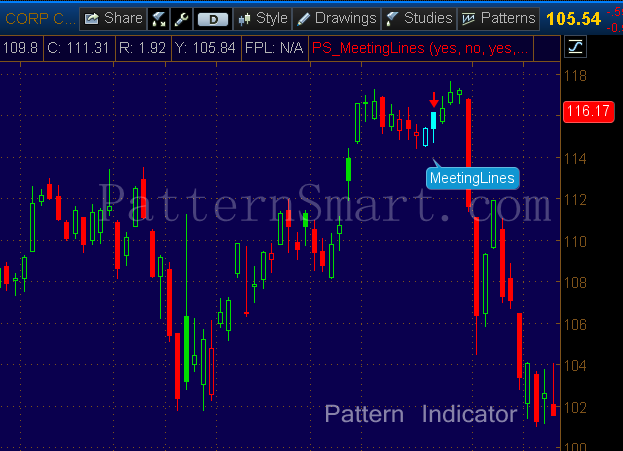
Is pattern ko samajhne ke liye, aapko candlestick charts par focus rakhna hoga. Pehli candle ki body down move ko represent karti hai, jabki dusri candle ki body up move ko show karti hai. Agar dono candles ki closing prices aapas mein similar hain, toh yeh meeting line pattern banata hai.
Meeting line candle pattern ka istemal karke traders market ke future direction ka anuman lagate hain. Yeh ek indicator hai, aur dusre technical tools ke saath milake istemal hota hai market analysis mein.
.jpeg")
Is pattern ke mukhtalif variations bhi hote hain, jinmein kuch mei pehli candle ki high aur low range ko cross karna zaruri hota hai. Traders ko chahiye ke is pattern ko confirm karne ke liye dusre technical indicators ka bhi istemal karein, taaki unhe sahi trading decisions lene mein madad mile.
Yeh pattern market volatility aur uncertainty ko highlight karta hai, isliye traders ko cautious rehna chahiye jab yeh pattern dikhai deta hai. Iske istemal mein practice aur experience ka bhi hona zaruri hai.
In conclusion, meeting line candle pattern ek powerful tool hai market analysis mein, lekin iska istemal sahi taur par karna aur dusre indicators ke saath combine karna important hai trading success ke liye.
Jab yeh pattern banata hai, iska matlab hota hai ke market mein indecision hai aur bears aur bulls mein balance hai. Pehli candle mein market downtrend mein hoti hai, lekin dusri candle mein price recover karti hai aur uptrend shuru hota hai.
Is pattern ko samajhne ke liye, aapko candlestick charts par focus rakhna hoga. Pehli candle ki body down move ko represent karti hai, jabki dusri candle ki body up move ko show karti hai. Agar dono candles ki closing prices aapas mein similar hain, toh yeh meeting line pattern banata hai.
Meeting line candle pattern ka istemal karke traders market ke future direction ka anuman lagate hain. Yeh ek indicator hai, aur dusre technical tools ke saath milake istemal hota hai market analysis mein.
Is pattern ke mukhtalif variations bhi hote hain, jinmein kuch mei pehli candle ki high aur low range ko cross karna zaruri hota hai. Traders ko chahiye ke is pattern ko confirm karne ke liye dusre technical indicators ka bhi istemal karein, taaki unhe sahi trading decisions lene mein madad mile.
Yeh pattern market volatility aur uncertainty ko highlight karta hai, isliye traders ko cautious rehna chahiye jab yeh pattern dikhai deta hai. Iske istemal mein practice aur experience ka bhi hona zaruri hai.
In conclusion, meeting line candle pattern ek powerful tool hai market analysis mein, lekin iska istemal sahi taur par karna aur dusre indicators ke saath combine karna important hai trading success ke liye.

تبصرہ
Расширенный режим Обычный режим