Dragonfly doji candlestick patterns
X
  • وقت
  • دکھائیں
Clear All
new posts
  • #1 Collapse

    Dragonfly doji candlestick patterns
    Dragonfly Doji, forex trading mein aik ahem candlestick pattern hai jo traders ko market sentiment aur possible reversals ke baray mein malumat farahem karta hai. Ye pattern market mein hone wale changes ko samajhne mein madad karta hai aur traders ko potential entry ya exit points talaashne mein istemal hota hai.

    Dragonfly Doji candlestick ek specific price action pattern hai jo market mein uncertainty aur indecision ko darust karta hai. Iski pehchan, ek lambi lower shadow aur kisi bhi upper shadow ke baghair ek chhota sa body se hoti hai. Iska matlab hai ke opening price aur closing price aik dosre ke bohat qareeb hote hain, jisse candle ki body almost non-existent hoti hai. Lambi lower shadow yeh darust karta hai ke market mein buyers ne control liya hua hai, jab ke upper shadow ki absence uncertainty aur lack of selling pressure ko indicate karti hai.

    Dragonfly Doji ka zikar hota hai jab market mein bearish trend ke baad ye candle appear hota hai. Is situation mein, ye pattern indicate karta hai ke sellers ne control khoya hai aur buyers market mein wapas entry kar rahe hain. Lambi lower shadow, market mein support ka level darust karti hai, jabke candle ki body ka size buyers aur sellers ke darmiyan barabar ki larai ko show karta hai.

    Traders ko Dragonfly Doji ko samajhne ke liye market context aur surrounding candlesticks ka bhi tajzia karna zaroori hai. Agar ye pattern strong support level ke qareeb appear hota hai aur uske baad ek bullish candle follow hoti hai, to ye indicate karta hai ke market mein reversal hone ke chances hain. Is situation mein, traders ko long position le lene chahiye.

    Lekin, yaad rahe ke har trading signal ki tarah, Dragonfly Doji bhi 100% confirm nahi hota aur market conditions ka dhyan rakhna zaroori hai. Kabhi-kabhi ye pattern false signals bhi de sakta hai, is liye iska istemal karne se pehle dusre technical indicators aur analysis tools ka bhi istemal karna behtar hota hai.

    In conclusion, Dragonfly Doji candlestick pattern traders ko market dynamics ko samajhne mein madad karta hai, lekin iska istemal saavdhani aur doosre confirmation signals ke saath karna hamesha behtar hota hai.
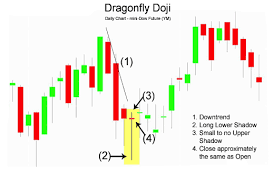


    Click image for larger version

Name:	download (8).png
Views:	39
Size:	7.3 کلوبائٹ
ID:	12786521
  • <a href="https://www.instaforex.org/ru/?x=ruforum">InstaForex</a>
  • #2 Collapse

    Assalamu Alaikum Dosto!
    Dragonfly Doji Candlestick


    Dragonfly Doji ek candle pattern hai jismein koi real body nahi hotami, sirf ek lambi neechay ki shadow hoti hai. Aik Dragonfly Doji peechle price action ke mutabiq, neeche ya oopar ek potential price reversal ko zahir karta hai. Yeh tab hota hai jab assets ke high, open, aur close prices uniform hoti hain. Long neeche ki shadow yeh zahir karta hai ke candle ke peroid mein kuch assertive selling hui thi. Jab price open ke qareeb band hoti hai, to buyers wale selling pressure ko absorb karte hain aur prices ko dobara upar le jaate hain.
    Dragonfly Doji candle kisi bhi standard Doji candle se banta hai jismein ek small body aur sirf neeche ki taraf lambi shadow hoti hai. Opening aur closing prices kafi mushabah hote hain kyun ke jism chhota hota hai. Neeche ki shadows candle ke jism ko bahut zyada lamba banate hain, jo ke opening aur closing prices ko shamil karte hain. Is natije mein, low price opening, high, aur close prices se nisbatan door hoti hai jabke opening, high, aur close prices qareeb hote hain.

    "Dragonfly Doji" Indication


    A Dragonfly Doji ek candlestick pattern hai jo open, high, aur close prices ko barabar ya bohot qareeb se shumaar karta hai, jabke muddat ki low price pehle teeno se bohot kam hoti hai. Traders asani se "T" shape ko pehchaan sakte hain jo neeche ki shadow ki wajah se banti hai. Ek Dragonfly Doji ka ban jaana ek price gain ke baad aik potential price decline ka intehai ishaara hota hai. Agar agle candle pe move neeche hota hai toh yeh confirmation deta hai.
    Ek Dragonfly Doji, price drop ke baad, yeh zahir karta hai ke price barh sakta hai. Agle candle ka uthna zaroori confirmation hota hai price increase ke liye. Dragonfly Doji ek trend reversal ka bharosa mand nishaan hai jab yeh ek downtrend ke bottom pe appear hota hai. Yeh is wajah se hota hai ke price trading day ke doran ek support level tak pahunch jaata hai, jo ke market ke sellers ko buyers se zyada nahi kar raha hai.
    Ek bullish movement agle din ho sakti hai agar assets ko oversold maana jaata hai, aur is ke liye mazeed technical indicators zaroori hote hain. Yeh mazeed entry points ke liye aik moqa ho sakta hai, khaaskar agar market agle din top par open hota hai.

    Candles Formation


    Doji candlestick ka jism rectangular nahi hota. Yeh ek cross ki shakal mein hota hai kyun ke yeh ek rare qisam ka hota hai jismein open aur close prices barabar hote hain. Dragonfly Doji candlestick tab ban jaata hai jab ek security ka open, close, aur high prices praktikally barabar hote hain. Isliye Dragonfly Doji T-shaped hota hai aur sirf aik lambi neeche ki tail hoti hai bina upper tail ke.
    Aik Dragonfly Doji ki lambi neeche ki tail yeh darshaata hai ke market mein bechne wale active thay, jo ke security ke price ko ek muddat ke liye neeche dabaate hain.
    • 'Red' Dragonfly Doji Candlestick
      Aik red Dragonfly Doji tab ban jaata hai jab closing price opening price se thodi kam hoti hai. Yeh zahir karta hai ke bulls aur bears ke darmiyan jang mein, bears market ko thodi si miqdaar mein control kar rahe hain. Red close market ki kamzori ko zahir karta hai.
    • 'Green' Dragonfly Doji Candlestick
      Green close ek uptrend ko darshaata hai. Aik green Doji pattern tab ban jaata hai jab stock ka closing price opening price se zyada hota hai. Is haalat mein, bulls market ko thodi si miqdaar mein control kar rahe hain. Yeh zahir karta hai ke bulls abhi tak apni positions ko jari rakhne mein thodi si umeed rakhte hain. Aik green Doji ka ban jaana darshaata hai ke market is point se reversal hone wala hai, agar peechle trading periods mein yeh continuous downtrend mein tha. Ek uptrend ke doran ek green Doji ka hone ka dawa hota hai ke stock bahar nikalne wala hai.


    Dragonfly Doji ki rangat mayn farq nahi padta. Yeh ya toh hara ho sakta hai ya red kyun ke opening aur closing prices kafi mushabah hote hain. Magar traders confirmation candle method ko follow karte hain. Woh aam tor par confirmation candle ke shade ka nigrani karte hain kyun ke us trend ko jaari rehne ki umeed hoti hai. Aik green confirmation candle ek uptrend ko zahir karta hai jabke ek lal confirmation candle ek downtrend ko zahir karta hai.

    Dragonfly Doji Candlestick Kab aur Kitni Baar Banta hai?


    Ek Dragonfly Doji hota hai jab market ke buyers session ke candle ko session ke low se kamyabi se wapas session ke open price tak pohchaate hain.
    Dragonfly Doji ek candlestick pattern hota hai jo high, open, aur close prices ko barabar ya bohot qareeb shumaar karta hai, jabke ek lambi shadow ek session ki low create karti hai. Ek wick ek line hoti hai jo dikhane ke liye istemal hoti hai ke stock ke price ne opening aur closing prices tak kis had tak fluctuate kiya hai.
    Yeh lambi neeche ki wick yeh darshaata hai ke sellers ne candle ke muddat mein active selling ki thi. Price ne neeche gira aur close high ke qareeb tha kyun ke candle open ke qareeb close hui thi. Reaction k lambi wick ke hisaab se zyada ahem ho sakti hai. Jitni lambi wick, utna zyada reaction. Ek Dragonfly Doji pattern bohot kam hota hai, magar jab hota hai, yeh zahir karta hai ke trend badal sakta hai.
    Ek Dragonfly Doji, ek price advance ke baad, zahir karta hai ke sellers muddat ke kuch hisse mein control haasil karne mein kamyab thay. Ek mumkin bearish dragonfly ke baad aane waala candle trend reversal ko confirm karna chahiye. Agar confirmation candle pe price badhta hai toh trend jaari reh sakta hai.
    Ek Dragonfly Doji, ek price decline ke baad, zahir karta hai ke sellers muddat ke shuruaat mein mojood thay, magar session ke ikhtitam tak buyers ne price ko wapas open tak reverse liya tha. Yeh zahir karta hai ke downtrend ke doran additional buying pressure thi aur price gain ki umeed ki ja sakti hai. Signal valid hai agar dragonfly ke upar wala candle raise hota hai aur dragonfly ke close se upar close karta hai. Agar bullish dragonfly ke din ke baad rally ziada hai toh reversal ziada reliable hota hai.

    Dragonfly Doji Technical Analysis


    Technical analysts trend reversal ko darust karne ke liye pattern ka development ek uptrend mein wapas ki taraf ishaara karte hain kyun ke yeh buying pressure ka shift aur pullback ka potential end zahir karta hai. Analysts ek long position establish kar sakte hain jab Dragonfly Doji pattern develop hota hai security ko kharid kar aur ise ek target price tak rakhte hain. Kuch traders stop-loss order establish bhi kar sakte hain, taake ager trend jaisa ki umeed nahi hoti toh nuqsan kam ho sake.
    Analysts ko ek Dragonfly Doji pattern padhte waqat 5 ahem points yaad rakhne chahiye.
    • Sab se pehle, unhe downtrend ka dhyan rakhna chahiye, kyun ke pattern ek downtrend mein zyada significant hota hai jo ke trend reversal ko zahir karta hai.
    • Doosra, technical analysts ko ek lambi neeche ki shadow ka ghor karna chahiye kyun ke yeh zahir karta hai ke price din ke doran nakaam hua tha, magar buyers use dobara upar le gaye the, ek lambi neeche ki shadow banaate hue.
    • Uske baad, teesra ahem point hai ke ek chhota ya naa-exist kirdaar ko dekha jaaye jo ke din ke doran minimal price movement ko ishaara karta hai aur opening aur closing prices qareeb qareeb hote hain.
    • Chautha ahem point yaad rakhna chahiye ke koi upper shadow mojood nahi hona chahiye. Koi upper shadow zahir karta hai ke price din ke doran zyada oopar naa badh saki aur wahan zyada resistance thi din ke unchi darjaat pe.
    • Aakhir mein, khaas taur pehle, yeh yaad rakhna chahiye ke Dragonfly Doji sirf aik qisam ka price pattern hai, ise doosri research techniques aur overall market environment ke saath istemaal kiya jaana chahiye taake traders ko achi trading decisions banane mein madad mile. Kuch traders doosre technical indicators jaise ke stochastic, RSI, aur volume analysis ka istemaal karte hain ek mumkin price reversal ko confirm karne ke liye.


    Aksar ek Dragonfly Doji high volume ke sath zyada darust hai jaise ke ek relatively low-volume wala typically hota hai. Tasdeeq candle ko bhi mazboot price movement aur volume ko dikhana chahiye. Dragonfly Doji pattern ki darusti, phir bhi, pattern ke framework, dekhe jaane wale peroid ke time range, aur doosre technical indicators jaise ke factors par munhasir hoti hai.


    Technical Analysis mein Accuracy


    Technical analysis mein, aik Dragonfly Doji candlestick pattern darshaata hai ke market ke buyers aur sellers apne positions ke mutaliq ghair muttafiq hain. Yeh darshaata hai ke na toh bulls aur na he bears qareebi market mein kisi clear faidey ke malik honge.
    Jaise ke sab doosre candlestick patterns, Dragonfly Doji ko akela lagoo nahi kiya jaana chahiye. Usay doosre technical aur price action tactics ke saath jorna behtareen tareeqa hai.

    Trading


    Dragonfly Doji candlestick pattern aam tor par finance markets, jaise ke stocks, forex, aur commodities ki technical analysis mein istemaal hota hai. Dragonfly Doji ko possible reversals ko pehchane ke liye istemal kiya jaata hai aur yeh tab appear hota hai jab ek stock ka din ka range almost similar hota hai opening aur closing price ke barabar.
    Dragonfly Doji traders ko support aur resistance levels ko pehchane mein madad deta hai. Traders aur investors Dragonfly Doji ko apni nuqsan ko had mein rakne ke liye stop-loss levels set karne ke liye istemal karte hain.
    Aik Dragonfly Doji ko stock trading mein istemal karne ke liye, aap ke paas pattern ko uske signaling system mein shaamil karne wala aik mazboot trading method hona chahiye, keval isay akela signal ke tor par istemal karne ke bajaye. Stock market mein Dragonfly Doji ko istemal karne ka aasan price action strategy hai trend ko pehchanna aur uske mutaabiq aage badhna.
    • Trend ko pehchanna: Trend ki taraf ishaara karne ke liye ek upward trendline ko refer karen. Price trendline ke upar honi chahiye aur ek upward trend hona chahiye.
    • Price ke nichlay levels ko pehchanna: Probable support levels ko pehchane ke liye ek horizontal line draw karen.
    • Pattern ko pehchanna: Marked support level ke aas paas Dragonfly Doji pattern ko dekhen.
    • Ek buying ki order lagayen: Ek buy order lagayen jo Dragonfly Doji pattern ko ek support level pe verify karne ke baad agle candle ka opening price par rakha gaya ho.
    • Ek stop loss fix karen: Risk ko kam karne ke liye Dragonfly Doji pattern ke low ke neeche aik stop loss order set karen.
    • Ek munafa target ka faisla karen: Agla resistance se pehle aik munafa target set karen.
    • Stock trade ko nigrani mein rakhen: Regularly stock ko analyse karen ke dekhen ke price ko badhne lagta hai ya stop loss activate ho jaata hai.


    Dragonfly Doji ek ahem indicator hai jo stock market mein traders ke dwara istemal kiya jaata hai, lekin yeh 100% reliable nahi hai aur doosre technical indicators jaise ke RSI, moving averages, etc. ke saath istemaal kiya jaana chahiye.
    Ek Dragonfly Doji ke saath trade karne ka behtareen waqt ek uptrend mein pullback ke baad hota hai. Traders pattern ka vikas ek uptrend mein pullback ke baad dekhte hain kyun ke yeh purchasing pressure mein tabdili aur pullback ka potential end zahir karta hai.


    Example: Chalein ek misal lete hain jahan aik bullish Dragonfly Doji medium-term downtrend ko follow karta hai. Long positions aik baad mein aane waale bullish closing period ke liye ek trigger signal ke saboot ke taur pe liye ja sakte hain. Expert traders aksar positions ko turant band kar dete hain jo price candle ke band hone ke baad hoti hai. Yeh false breakout signals ko taalne mein madad karta hai, jo jaldi se excessive nuqsan ka bais ban sakta hai. Jab long bets liye jaate hain bullish Dragonfly Doji reversal pe toh stop-loss orders pattern ke low ke neeche rakhe jaate hain.


    Dragonfly Doji k Istemal ka Experience
    • Kya aik Dragonfly Doji Uptrend Sell Signal hai?
      Haan, Dragonfly Doji aksar uptrend sell signal ke tor par consider kiya jaata hai. Dragonfly Doji market mein kis tarah se pesh aata hai is par based hokar 50% waqt mein reversal ka kaam karta hai. Is wajah se yeh na toh uptrend sell aur na he downtrend sell signal candle hai. Yeh uncertainty ko darshaata hai. Jabke closing price candlestick ke upar set kiya gaya hai aur lower shadow itna lamba hai, toh upward breakouts zyada aam hote hain.
    • Kya aik Dragonfly Doji Candlestick Dragonfly Doji Bullish ya Bearish hai?
      Dragonfly Doji bullish hai. Aik Dragonfly Doji yeh darshaata hai ke price session high pe open hua tha. Price session ke doran significant decrease hua tha phir close apni peak pe hui. Natija yeh hai ke price open, high, aur close sab barabar hain (ya phir zyada tar barabar) aur low kafi kam hai.


    Yeh zahir karta hai ke pehle sellers ka upper hand tha lekin buyers ne price ko open level tak dobara uthaya, jo ek potential bullish market sentiment ko zahir karta hai.

    Dragonfly Doji Candle k Advantages


    Pattern aksar market mein uncertainty ko zahir karta hai, aur iske kai faidey traders ke liye hote hain kyun ke yeh traders ko trading decisions lene aur reversal signal ka pata lagane mein madad karta hai. Yeh entry aur exit points ko bhi taayin karne mein madad karta hai.
    • Reversal signal ka kaam karna: Aik Dragonfly Doji price reversal ka ishaara ho sakta hai. Security ki price ka downward trend ek aane waale price increase ko darshaata hai. Is halat mein, dragonfly bullish hota hai. Price reversal confirmed hoti hai aur trading decisions liye jaate hain agar bullish dragonfly ke baad aane wala candlestick price mein badhaye aur higher price pe band ho.
    • Trading decisions lene mein madad: A Dragonfly Doji ko traders istemal karke apne trading choices ko guide kar sakte hain. Aksar, woh turant positions place karte hain jaise he confirmation candlestick emerge hota hai. Ek trader long a stop loss below a bullish dragonfly’s low ya short a stop loss above a bearish dragonfly’s high kar sakta hai.
    • Entry aur exit points ko taayin karne mein madad: Traders Dragonfly Doji ko ek position mein dakhil ya bahar nikalne ka signal ke tor par istemal kar sakte hain. For example, agar ek Dragonfly Doji ek lambi rise ke baad appear hota hai, toh yeh behtareen samjha ja sakta hai ke buyers ka momentum kam ho raha hai aur selling ka waqt aa gaya hai.


    Kul mila ke, Dragonfly Doji traders ke liye informed trading decisions lene mein madadgar hai jo stop loss level aur trend reversal pattern ko darshaata hai.


    Dragonfly Doji Candle k Disadvantages


    Dragonfly Doji candlestick ke kai faide hain, lekin iske kuch hadood bhi hain jaise ke isay aik reliable indicator na hone, kaafi munasib dakhil points faraham na karne, aur price targets na dene wale hain.
    • Reliable indicator na hone: Dragonfly Doji aam tor par baar baar nahi hota, lekin price reversal baar baar hota hai. Is tarah, Dragonfly Doji price reversals ke liye kisi bhi darust indicator ki tarah kaafi aehem nahi hai. Amuman, Dragonfly Doji ek higher volume ke saath wala ek low-volume se zyada mukhlis hota hai. Yeh tasdeeq candlestick ke liye bhi durust hai.
    • Munasib dakhil points faraham na karne: Dragonfly ka saiz saath mein confirmation candlestick ke saiz ne kabhi kabhi darshaata hai ke trade ke liye dakhil point stop loss location se door hota hai. Yeh matlab hai ke traders ko doosra point dhoondhna padega stop loss ke liye, ya phir woh trade ko mansookh karna padega kyun ke aik zyada bada stop loss trade ke possible faide ko justify nahi karta.
    • Price targets na dene wale: Dragonfly Doji pattern price targets faraham nahi kar sakta. Sirf Dragonfly Doji analysis ke mutaabiq ek trade ka return peshgoyi karna mushkil hai. Traders ko munasib waqt par exit karne ka waqt pehchane ke liye additional technical indicators ka istemal karna zaroori hai.


    Dragonfly Doji ke kuch nuqsan hain jaise ke Dragonfly Doji pattern par trading karna aksar ziada trading expenses ka bais banta hai, jo ke faiday ko kam kar sakta hai. Magar, unka faida tab hota hai jab unhe hoshiyar taur par istemal kiya jaata hai.

    Other Doji Candlesticks


    Dragonfly Doji ke ilawa 6 aur Doji candlestick patterns hain. In mein Gravestone Doji, Long-Legged Doji, Star Doji, Bearish Doji Star, Bullish Doji Star, aur Hammer Doji shamil hain.
    • Gravestone Doji: Gravestone Doji Dragonfly Doji ko ulta utha kar banaya jaata hai. Opening, low, aur close prices essentially same hoti hain, jabke high point ka price bohot zyada hota hai. Buyers initially active hote hain, lekin close tak unka saara munafa khatam ho jaata hai, aur sellers ne price ko open tak le ja diya hota hai.
    • Long-Legged Doji: Long-legged Doji tab banta hai jab opening aur closing prices nearly equal hoti hain lekin time frame ke doran tezi se highs aur lows hote hain, tails ko lamba karte hue. A long-legged Doji pattern uncertainty ko darshaata hai kyun ke na toh bulls aur na he bears time frame ke andar significant taur par advance karte hain, beshak dono taraf kaafi zyada movements hote hain.
    • Star Doji: Doosre mukhtalif star Doji candlestick patterns hote hain: bullish Doji star aur bearish Doji star. Dono ek asset ke upward ya downward trend ke baad develop hote hain aur mukhtalif trend directions ko darshaane mein madad karte hain.
    • Bearish Doji Star: A bearish Doji Star uptrend ke baad develop hota hai. Ye ek plus sign ki tarah hota hai. Doji star ka bearish reversal tasdeeq ho jaata hai agar candle pattern ke baad price decline hoti hai. Bearish Doji star ka body pehle candle se ooncha hona chahiye.
    • Bullish Doji Star: A bullish star Doji, kabhi kabhi morning star Doji ke roop mein refer kiya jaata hai, ek giravat ke baad ek musbat ishaara darshata hai. Pattern tasdeeq hota hai agar bullish Doji ke start ke baad price oonchi hoti hai. Uska body pehle candle se neeche honi chahiye.
    • Hammer Doji: Hammer-shaped Doji candle ek price decline ke baad appear hota hai aur apna naam apni shakal se le leta hai. Ek hammer Doji candlestick tab banta hai jab price initially badhti hai aur phir decline hoti hai, phir close opening price ke qareeb hoti hai. Pattern darshaata hai ke buyers market ko flood kar rahe hain jab prices apni lowest hain.


    Ye Dragonfly Doji ke ilawa doosre Doji patterns traders ke liye stock market mein trading ko aasaan banate hain.

    Dragonfly Doji Candlestick ke kis tarah ka Candlestick Pattern se milti hai?


    Dragonfly Doji pattern aur hammer Doji pattern ke beech mein kaafi kuch milta julta hai. Hammer pattern, jo ke ek chhota body aur aik lambi lower shadow ke saath hota hai, ek downtrend ke nichle hisse ke kareeb banaya jaata hai, bilkul Dragonfly Doji ki tarah. Ek Dragonfly Doji ki tarah, hammer formation selling pressure aur buying pressure ka combination darshaata hai jiske opening aur close day ke high ke barabar hote hain ya uske qareeb, aur ek lambi tail ko form karte hain.


    Dragonfly Doji Candlestick ka reversal kya hota hai?
    Gravestone Doji Dragonfly Doji ka ulta hota hai. Yeh tab paida hota hai jab price movement session ke nichle hisse mein opening aur closing hoti hai. A Gravestone Doji aik bearish reversal candlestick pattern hai jo paida hota hai jab open, low, aur closing prices sab ek doosre ke qareeb hote hain aik lambi upper shadow ke saath.


    Dragonfly Doji aur Hammer Candlestick ke darmiyan kya farq hai?
    Hammer pattern mein aam tor par open, high, aur close prices ek doosre ke barabar nahi hote, halankay Dragonfly Doji pattern mein open, high, aur close prices qareeb qareeb barabar hote hain. Hammer pattern ko aik bullish indication samjha jaata hai, jo ke darshaata hai ke buyers market mein dakhil ho gaye hain taake price ko support aur uthane mein madad karein.


    Dragonfly Doji aur hammer Doji ke darmiyan mukhtalif farq ye hai ke pehla opening aur closing ke ek jagah hota hai jabke doosra neeche khulta hai aur opening price se thoda neeche band hota hai.
    • #3 Collapse

      Dragonfly Doji: A Powerful Candlestick Pattern

      Candlestick patterns are a crucial tool in technical analysis for traders, providing insights into market sentiment and potential price movements. Among these patterns, the Dragonfly Doji holds a special significance. In this article, we'll delve into the intricacies of the Dragonfly Doji candlestick pattern and its implications for traders.

      1. What is a Dragonfly Doji?

      A Dragonfly Doji is a single candlestick pattern that forms when the open, high, and close prices are the same, and the low price creates a long lower shadow. Visually, it resembles a "T" shape, with a small body at the top and a long lower shadow protruding below. This pattern suggests a potential reversal of the prevailing trend, especially when it appears at the end of a downtrend.

      2. Interpretation of Dragonfly Doji

      The appearance of a Dragonfly Doji on a price chart signifies a shift in momentum from bearish to bullish. When it forms after a downtrend, it indicates that sellers pushed the price lower during the trading session, but bulls managed to push the price back up, closing near the session's high. This battle between bulls and bears often suggests that buyers are gaining strength, potentially leading to a reversal or at least a temporary halt in the downtrend.

      3. Key Characteristics
      • Small body: The body of the Dragonfly Doji is typically small, indicating little difference between the opening and closing prices.
      • Long lower shadow: The most distinctive feature of the Dragonfly Doji is its long lower shadow, which suggests that sellers tried to push the price lower but were ultimately unsuccessful.
      • Absence of upper shadow: Unlike some other candlestick patterns, the Dragonfly Doji does not have an upper shadow, emphasizing the dominance of buyers at the end of the trading session.

      4. Trading Strategies

      Traders use the Dragonfly Doji pattern in conjunction with other technical indicators and analysis techniques to make informed trading decisions. Some common strategies include:
      • Confirmation: Traders often wait for confirmation of a trend reversal before entering a trade based on the Dragonfly Doji pattern. This confirmation may come in the form of a bullish candlestick pattern or a significant increase in trading volume.
      • Stop-loss placement: To manage risk, traders may place a stop-loss order below the low of the Dragonfly Doji candlestick, as a break below this level could invalidate the pattern and signal a continuation of the downtrend.
      • Target setting: Traders typically set price targets based on previous support or resistance levels, Fibonacci retracement levels, or other technical analysis tools to gauge the potential upside following a Dragonfly Doji reversal.

      5. Limitations and Considerations

      While the Dragonfly Doji pattern can provide valuable insights into market sentiment, traders should be aware of its limitations and consider other factors before making trading decisions. Some important considerations include:
      • Market context: The significance of the Dragonfly Doji pattern depends on the broader market context, including the prevailing trend, trading volume, and the strength of support and resistance levels.
      • False signals: Like any technical indicator, the Dragonfly Doji pattern is not foolproof and can sometimes produce false signals. Traders should use additional confirmation tools and exercise caution when relying solely on candlestick patterns for trading decisions.
      • Timeframe: The effectiveness of the Dragonfly Doji pattern may vary depending on the timeframe of the price chart. Traders should experiment with different timeframes and combine multiple indicators to improve the accuracy of their analysis.

      In conclusion, the Dragonfly Doji candlestick pattern is a powerful tool for identifying potential trend reversals in the financial markets. By understanding its characteristics, interpreting its implications, and integrating it into a comprehensive trading strategy, traders can enhance their ability to identify profitable trading opportunities and manage risk effectively.
      • #4 Collapse

        Dragonfly Doji candlestick pattern :

        Dragonfly Doji candlestick pattern ek bullish reversal pattern hai. Ismein open, high aur close prices same hote hain aur low price mein ek lamba lower shadow hota hai. Is pattern ka shape dragonfly ki tarah hota hai, isliye iska naam Dragonfly Doji hai. Is pattern ko dekhkar traders samajhte hain ki selling pressure ke baad buyers ne control regain kiya hai aur price ko higher push kiya hai. Ye pattern potential trend reversal ya bullish continuation ka indication deta hai. Lekin trading decisions lene se pehle dusre factors aur indicators ko bhi consider karna zaroori hai.

        Click image for larger version

Name:	dragonfly Doji.png
Views:	18
Size:	7.2 کلوبائٹ
ID:	12869880

        Trading with Dragonfly Doji pattern:

        Dragonfly Doji candlestick pattern ke saath trading karne ke liye aap kuch steps follow kar sakte hain:

        1. Confirmation ki zarurat hai:

        Ek single candlestick pattern ke basis par trading decisions lena risky ho sakta hai. Isliye, Dragonfly Doji pattern ko confirm karne ke liye dusre technical indicators aur price action ko bhi consider karna zaroori hai.

        2. Trend aur support/resistance levels ka analysis karen:

        Trend direction aur support/resistance levels ke analysis se aapko trading opportunities aur entry/exit points ka idea mil sakta hai. Dragonfly Doji pattern ko trend reversal ya continuation ke context mein analyze karen.

        3. Stop loss aur target levels set karen:

        Apne trades ke liye stop loss aur target levels ko set karna zaroori hai. Stop loss aapko potential losses se protect karega aur target levels aapko profits book karne mein help karenge.

        4. Volume aur price action ka dhyan rakhen:

        Volume aur price action ko monitor karen, kyunki ye aapko additional confirmation aur trading signals provide kar sakte hain. High volume aur bullish price action Dragonfly Doji pattern ke saath strong buy signal ho sakta hai.

        5. Risk management ka dhyan rakhen:

        Trading mein risk management bahut important hai. Apne trades ke liye risk tolerance aur position size ko determine karen. Apne capital ko protect karne ke liye overtrading se bachein.

        6. Practice aur experience gain karen:

        Dragonfly Doji pattern aur trading strategies ko samajhne ke liye practice aur experience gain karna zaroori hai. Demo accounts ya paper trading se shuruat karen aur gradually real market mein trading karne ki practice karen.

        Yeh steps aapko Dragonfly Doji pattern ke saath trading karne mein madad karenge. Lekin, trading mein koi guarantee nahi hoti hai, isliye hamesha apne risk tolerance aur market conditions ko consider karte hue decisions len.
        Last edited by ; 18-03-2024, 04:21 PM.
        • #5 Collapse

          Dragonfly doji candlestick patterns
          Click image for larger version

Name:	2-12-1024x640(0).jpg
Views:	34
Size:	102.8 کلوبائٹ
ID:	12864004


          Dragonfly Doji ek single candlestick pattern hai jo market mein dekha jata hai jab ek session ke dauran price movement minimal hoti hai aur candlestick ka open, high, aur close price barabar ya kareeb barabar hota hai. Ye pattern typically reversal signals ke liye dekha jata hai.
          Dragonfly Doji Candlestick Pattern ko samajhne ke liye, yeh kuch key points hain :
          1. Candlestick Shape: Dragonfly Doji ka shape ek "T" ke jaisa hota hai, jismein candlestick ka body negligible ya bahut chhota hota hai, aur upper shadow (ya wick) lamba hota hai jo lower shadow (ya wick) ke barabar ya bahut chhota hota hai.
          2. Price Action: Dragonfly Doji formation market mein minimal price movement ko darust karta hai, jismein buyers aur sellers ke beech mein equilibrium hota hai aur ultimately koi decisive move nahi hota hai.
          3. Reversal Signal: Jab Dragonfly Doji downtrend ke baad dekha jata hai, toh ye bullish reversal signal provide karta hai. Iska matlab hai ke downtrend ke baad buyers ka dominance aa sakta hai aur price ka trend change ho sakta hai.
          4. Support Level: Agar Dragonfly Doji kisi important support level ke near form hota hai, toh ye us support level ko confirm karta hai aur further downside ki possibility ko indicate karta hai.
          5. Confirmation: Dragonfly Doji ko confirm karne ke liye, traders doosre technical indicators ka istemal karte hain jaise ke volume, aur doosre candlestick patterns. High volume ke sath Dragonfly Doji ko dekhna, uske reliability ko badhata hai.
          Dragonfly Doji Candlestick Pattern ko sahi tareeke se identify karke, traders market mein potential reversals ka pata lagate hain aur apne trading decisions ko improve karte hain. Is pattern ko samajhna aur istemal karna, market movements ko sahi tareeke se analyze karne mein madad karta hai.
          • #6 Collapse

            Candlestick patterns, ya'ni ki mombattiyon ke patterns, share market ke traders ke liye ek aham tool hain jo unhe market ke movements ko samajhne mein madad karta hai. Dragonfly Doji, ek aham candlestick pattern hai jo traders ko potential trend reversals ka pata lagane mein madad karta hai. Yeh pattern typically ek single candle se banta hai aur bullish ya bearish trend ke khatam hone ka ishara deta hai, lekin yeh confirmation ke saath istemal kiya jana chahiye.

            Dragonfly Doji pattern ko samajhne ke liye, pehle candlestick charts ka istemal karna zaroori hai. Candlestick charts mein har candle ko ek rectangle ya body aur uske upar niche do patang (wicks) dikhaya jata hai. Candle ki body un price range ko darust karta hai jismein trading hua hai, jabki patangain us range ke upper aur lower extremes ko darust karti hain.

            Dragonfly Doji pattern ek specific type ka candlestick pattern hai jismein price action ek specific shape create karta hai. Is pattern mein candle ki body bilkul top pe hoti hai, jabki nichla wick lamba hota hai jo neeche ki taraf jhukta hai, jaise ki ek dragonfly ki tail. Iska matlab hai ki market ke opening aur closing prices aapas mein baraabar hain aur price initially upar gaya tha lekin phir neeche aa gaya.

            Dragonfly Doji pattern ko dekhte hue, traders ko potential trend reversal ka andesha hota hai. Agar yeh pattern bearish trend ke baad aata hai, to yeh bullish reversal ka sign ho sakta hai aur agar yeh pattern bullish trend ke baad aata hai, to yeh bearish reversal ka sign ho sakta hai. Lekin hamesha yaad rahe ke ek single candlestick pattern pe bharosa karne se pehle, dusre technical indicators aur confirmations ko bhi madad se dekhna zaroori hai.

            Dragonfly Doji pattern ka istemal karne ke liye, traders ko market ka context bhi dekhna zaroori hai. Agar yeh pattern strong support ya resistance levels ke paas aata hai, to iska significance zyada hota hai. Iske ilawa, volume bhi ek important factor hai jo is pattern ko confirm karta hai. Agar Dragonfly Doji ke sath high volume dikhai deta hai, to iska reliability aur zyada barh jata hai.

            In conclusion, Dragonfly Doji candlestick pattern ek powerful tool hai jo traders ko market ke potential reversals ka pata lagane mein madad karta hai. Lekin, hamesha yaad rahe ke ek single pattern pe bharosa karne se pehle, dusre technical analysis tools aur confirmations ka bhi istemal karna zaroori hai. Is tarah se, traders apne trading strategies ko aur zyada reliable bana sakte hain.
            • #7 Collapse

              Dragonfly doji candlestick patterns

              Click image for larger version

Name:	download (10).jpeg
Views:	29
Size:	17.4 کلوبائٹ
ID:	12864087

              Dragonfly Doji Candlestick Pattern forex trading mein ek mufassal aur ahem technical indicator hai jo market trends aur potential reversals ko identify karne mein madad karta hai. Ye pattern ek single candlestick se bana hota hai aur market ke sentiment ko darust karta hai. Chaliye is pattern ke bare mein tafseel se baat karte hain:
              Dragonfly Doji Candlestick Pattern Kya Hai?


              Dragonfly Doji Candlestick pattern ek single candlestick pattern hai jo market mein uncertainty ya reversal ke possible signals provide karta hai. Is pattern mein candle ka body bilkul nahi hota, jabki upper shadow lambi hoti hai aur lower shadow chhoti ya bilkul nahi hoti hai. Is pattern ko dekh kar lagta hai jaise ek dragonfly ka shape bana ho, isliye ise Dragonfly Doji kehte hain.
              Dragonfly Doji Candlestick Pattern Ki Tafseel:
              1. Candlestick Anatomy:
                • Candle ka body bilkul nahi hota, ya bahut chhota hota hai, jo indicate karta hai ke opening aur closing prices ke darmiyan mein koi significant difference nahi hai.
                • Upper shadow lambi hoti hai aur high price ko represent karti hai.
                • Lower shadow chhoti ya bilkul nahi hoti hai, jo indicate karta hai ke selling pressure nahi hai.
              2. Market Sentiment:
                • Dragonfly Doji pattern bullish reversal ka indication deta hai. Is pattern mein market ke buyers control mein aate hain aur price ko upar le jaate hain.
                • Yeh pattern downtrend ya bearish market ke baad appear hota hai aur bullish reversal ka signal deta hai.
              3. Confirmation:
                • Trading decisions ko confirm karne ke liye, traders doosre technical indicators aur price action ke sath Dragonfly Doji pattern ko dekhte hain. Isse false signals se bacha ja sakta hai.
              Dragonfly Doji Candlestick Pattern Trading Strategy:
              1. Entry aur Exit Points:
                • Dragonfly Doji pattern ke sath entry point buy position hota hai, jabki stop loss lower shadow ke low price ke neeche set kiya jata hai.
                • Exit point ko set karne ke liye traders recent swing high ya resistance level ko consider kar sakte hain.
              2. Risk Management:
                • Stop loss aur position sizing ka dhyan rakhna zaroori hai taake losses ko minimize kiya ja sake aur trading capital ko protect kiya ja sake.
              Conclusion:


              Dragonfly Doji Candlestick pattern ek powerful aur useful technical indicator hai jo market trends ko analyze karne aur bullish reversals ko identify karne mein madad karta hai. Lekin, iska istemal karne se pehle proper analysis aur risk management ka dhyan rakhna zaroori hai. Overall, Dragonfly Doji Candlestick pattern ek important tool hai jo traders ko market dynamics ko samajhne aur trading strategies ko optimize karne mein madad deta hai.


              • #8 Collapse

                Dragonfly Doji Candlestick


                Click image for larger version

Name:	download (10).jpeg
Views:	43
Size:	14.3 کلوبائٹ
ID:	12864160

                Dragonfly Doji Candlestick: Aik Candlestick Pattern ka Mukammal Bayan

                Dragonfly Doji candlestick ek Japanese candlestick pattern hai jo traders ko market ke sentiment aur possible reversals ke bare mein maloomat deta hai. Ye pattern bullish aur bearish market situations mein dekha ja sakta hai aur traders ko potential entry aur exit points ka pata lagane mein madad karta hai.

                Dragonfly Doji Candlestick ki Tafseel

                Dragonfly Doji candlestick ek single candlestick pattern hai jo typically market ke top ya bottom par dekha jata hai. Is candlestick mein, open, high, low, aur close prices almost barabar hoti hain, jisse candlestick ki body ya shadow nahi hoti hai. Yeh candlestick ek lambi upper shadow ke sath hoti hai, jo indicate karta hai ke price neeche girne ke baad recover kar gaya hai.

                Dragonfly Doji Candlestick ka Matlab

                Dragonfly Doji candlestick bullish aur bearish reversals ke indicators ke taur par istemal kiya jata hai:
                1. Bullish Reversal: Agar Dragonfly Doji candlestick bearish trend ke doran dekha jata hai, to yeh bullish reversal ka indication ho sakta hai. Yeh is liye hota hai kyunki price neeche girne ke baad candlestick ke close price ke qareeb recover kar gaya hai, jo bullish sentiment ko darust karta hai.
                2. Bearish Reversal: Agar Dragonfly Doji candlestick bullish trend ke doran dekha jata hai, to yeh bearish reversal ka indication ho sakta hai. Yeh is liye hota hai kyunki price upper jaane ke baad candlestick ke close price ke qareeb gir gaya hai, jo bearish sentiment ko darust karta hai.

                Dragonfly Doji Candlestick ka Istemal

                Dragonfly Doji candlestick ko identify karne ke liye, traders ko candlestick ki shape aur price action ko closely observe karna hota hai. Agar ek candlestick ki body nahi hoti hai aur lambi upper shadow hoti hai, to yeh Dragonfly Doji pattern ko indicate karta hai.
                1. Entry Points: Agar Dragonfly Doji candlestick bearish trend ke baad dekha jata hai, to traders ko potential buy entry point samajhna chahiye. Agar yeh bullish reversal confirm ho jata hai, to traders ko buy karne ka faisla karna chahiye.
                2. Stop Loss aur Target Points: Traders ko apne trades ke liye stop loss aur target points set karna chahiye. Stop loss neeche ki taraf set kiya ja sakta hai, jabki target points bullish movement ke hisab se set kiye jaate hain.

                Dragonfly Doji Candlestick ke Faide

                Dragonfly Doji candlestick traders ko market ke sentiment aur reversals ko samajhne mein madad deta hai. Is pattern ka istemal karke traders sahi waqt par entry aur exit points ka faisla kar sakte hain aur trading strategies ko improve kar sakte hain.
                • #9 Collapse

                  Dragonfly Doji Candlestick:

                  Click image for larger version

Name:	download (11).jpeg
Views:	38
Size:	17.7 کلوبائٹ
ID:	12864162


                  Dragonfly Doji ek candlestick pattern hai jo technical analysis mein istemal hota hai aur ye market ki mazid behas ko samajhne mein madad karta hai. Is article mein hum Dragonfly Doji candlestick pattern ke baare mein mukammal maloomat faraham karenge.

                  Dragonfly Doji Kya Hai?

                  Dragonfly Doji ek single candlestick pattern hai jo bullish ya bearish trend ke dauran nazar aata hai. Ye pattern market ke mood ka pata lagane mein madadgar hota hai. Dragonfly Doji candlestick pattern ka naam isliye hai kyun ke iska structure ek dragonfly ki tarah hota hai, jismein ek lambi chhadi (wick) hoti hai aur base (body) nahi hoti.

                  Dragonfly Doji Ki Pehchan

                  Dragonfly Doji ko pehchane ke liye, aapko ek lambi chhadi (wick) ke saath ek chhota body dekhne ki zaroorat hoti hai. Body bahut chhoti hoti hai ya phir bilkul bhi nahi hoti. Is pattern mein, opening aur closing price barabar ya kareeb hoti hai. Chhadi (wick) upper side par hoti hai jo price ke neeche jaati hai aur lower side par hoti hai jo price ke upar aati hai.

                  Bullish Dragonfly Doji

                  Agar Dragonfly Doji bullish trend ke dauran nazar aaye, to ye ek bullish reversal signal ke taur par consider kiya jaata hai. Iska matlab hai ke market mein sellers ke control kamzor hota hai aur buyers ka dominance barh jata hai. Agar Dragonfly Doji ke baad ek bullish candle bani hai, to ye confirmation hai ke bullish momentum strong hai.

                  Bearish Dragonfly Doji

                  Bearish Dragonfly Doji bearish trend ke dauran nazar aaye to ye ek bearish reversal signal ke taur par consider kiya jaata hai. Iska matlab hai ke market mein buyers ka control kamzor hota hai aur sellers ka dominance barh jata hai. Agar Dragonfly Doji ke baad ek bearish candle bani hai, to ye confirmation hai ke bearish momentum strong hai.

                  Dragonfly Doji Ki Ahmiyat

                  Dragonfly Doji market ke trend reversal ko pehchane mein madadgar hota hai. Agar is pattern ko sahi tarah se samjha jaaye aur saath hi saath dusri technical indicators ke saath confirm kiya jaaye, to ye ek powerful trading signal ho sakta hai. Is pattern ki sabse badi ahmiyat ye hai ke ye traders ko market sentiment ko samajhne mein madad karta hai.

                  Conclusion

                  Dragonfly Doji candlestick pattern ek powerful tool hai jo traders ko market ke trend reversal ko samajhne mein madad karta hai. Is pattern ki sahi pehchan aur sahi samajh se traders ko behtar trading decisions lene mein madad milti hai. Lekin yaad rahe ke har trading decision ko dusri technical indicators ke saath confirm karna zaroori hai.
                  • #10 Collapse

                    Dragonfly doji candlestick pattern ek technical analysis tool hai jo ke stock market aur forex trading mein istemal hoti hai. Ye pattern ek single candlestick ko describe karta hai jo ke market ke behavior aur trend ko samajhne mein madadgar hota hai. Dragonfly doji pattern ke pehchanne se traders ko market mein hone wale changes aur reversals ko pehchanna asaan ho jata hai.

                    Dragonfly doji candlestick pattern ka naam isliye hai kyun ke ye candle ek dragonfly ki tarah dikhta hai, jismein ek chhote se candle body aur lambi tail hoti hai. Ye pattern typically market ke bottom ya downtrend ke baad dekha jata hai. Iska matlab hai ke jab market ne neeche gira hai aur phir ek doji pattern banata hai, to ye bullish reversal signal hai.

                    Dragonfly doji ko pehchanne ke liye, traders ko kuch key characteristics dekhni hoti hain:
                    1. Small Body: Dragonfly doji ka body chhota hota hai, jisse indicate hota hai ke opening aur closing price mein koi significant difference nahi hai.
                    2. Long Lower Shadow: Is pattern mein lambi tail ya lower shadow hoti hai, jo niche ke price level tak extend hoti hai. Ye tail market mein buyers ki taqat ka indication karta hai jo neeche gire hue prices ko control kar rahe hote hain.
                    3. Absence of Upper Shadow: Dragonfly doji candlestick pattern mein upper shadow nahi hoti hai ya bohot chhoti hoti hai.

                    Jab market mein ek dragonfly doji candlestick pattern form hota hai, to ye kuch traders ke liye signal hai ke bearish trend khatam ho sakta hai aur bullish reversal shuru ho sakta hai. Lekin, ye pattern sirf ek indicator hai aur isko confirm karne ke liye dusri technical analysis tools ka istemal kiya jata hai.

                    Agar dragonfly doji candlestick pattern ke sath volume ka bhi analysis kiya jaye aur kisi aur bullish indicator ke sath confirm kiya jaye, to iski reliability aur strength badh jati hai. Traders ko hamesha market ki overall context aur trend ko bhi samajhna zaroori hai jab wo dragonfly doji ko interpret karte hain.

                    Overall, dragonfly doji candlestick pattern ek powerful tool hai jo ke traders ko market ke reversals aur changes ko anticipate karne mein madad karta hai. Lekin, iska istemal karne se pehle thorough analysis aur risk management zaroori hai.
                    • #11 Collapse


                      Dragonfly Doji ek mumkin variant hai candlestick patterns mein jo aam tor par market ke reversals ko darust karta hai. Yeh candlestick pattern, jab sahi taur par samjha jata hai aur sahi tafseelat ke saath istemal kiya jata hai, traders ko faida pohancha sakta hai. Is article mein, hum Dragonfly Doji candlestick pattern ke fawaid aur nuqsanat ke baare mein tafseel se baat karenge, aur isko samajhne ke liye zaroori tafseelat ko daryaft karne ki koshish karenge.

                      Fawaid:
                      1. Reversal Signal: Dragonfly Doji candlestick pattern aksar market ke reversals ko darust karta hai. Jab yeh pattern down-trend ke dauraan nazar aata hai, to yeh bullish reversal ko point karta hai, aur up-trend ke dauraan, yeh bearish reversal ko indicate karta hai.
                      2. Price Rejection: Dragonfly Doji ek mukhtasir candlestick hai jismein shadow (ya tail) upar hoti hai, jo indicate karta hai ke sellers ne initial selling pressure ko face kiya aur phir buyers ne control hasil kiya. Yeh price rejection ko darust karta hai aur reversal ko mazid tasdeeq deta hai.
                      3. Support and Resistance Levels: Jab Dragonfly Doji candlestick pattern important support ya resistance levels ke nazdeek nazar aata hai, to yeh un levels ka mazid tasdeeq karta hai. Agar yeh pattern support level ke nazdeek nazar aata hai, to yeh bullish reversal ke liye mazid tasdeeq deta hai, jabke agar yeh resistance level ke qareeb nazar aata hai, to yeh bearish reversal ke liye tasdeeq karta hai.
                      4. Trade Signals: Agar Dragonfly Doji candlestick pattern important price levels ke nazdeek nazar aata hai aur uske saath confirmation milta hai, jaise ke doosri candlesticks ke sath bullish ya bearish divergence, to yeh traders ko acha trading signal provide karta hai.

                      Nuqsanat:
                      1. False Signals: Dragonfly Doji candlestick pattern kabhi kabar false signals bhi provide kar sakta hai, khas tor par jab yeh isolation mein dekha jata hai aur koi confirmation na ho. Isliye, is pattern ko dusri technical indicators ke saath istemal karna zaroori hai.
                      2. Market Volatility: Agar market mein zyada volatility hai, to Dragonfly Doji candlestick pattern ka istemal mushkil ho sakta hai, kyun ke yeh pattern choti movement ko darust karne ke liye hota hai aur volatile markets mein false signals ki sambhavna bhi zyada hoti hai.
                      3. Market Context: Dragonfly Doji candlestick pattern ko samajhne ke liye market ka context bhi mahatvapurn hai. Agar yeh pattern strong trend ke beech mein nazar aata hai, to uska impact kam ho sakta hai aur false signals ke chances zyada hote hain.
                      4. Confirmation Ki Zarurat: Sirf Dragonfly Doji candlestick pattern dekh kar trading decision lena sahi nahi hai. Iske saath aur technical indicators ka istemal karna, jaise ke moving averages, RSI, aur MACD, zaroori hai confirmation ke liye.

                      Muqamal Guftagu:

                      Dragonfly Doji candlestick pattern ek mahatvapurn technical tool hai jo traders ko market ke reversals aur price action ke changes ko samajhne mein madad karta hai. Is pattern ka sahi taur par istemal karne se traders ko behtar trading decisions lena asaan ho jata hai. Lekin, jaise har technical indicator ya pattern ki tarah, iska istemal bhi sahi samajh aur tafseelat ke sath kiya jana chahiye. Agar traders is pattern ko samajh kar istemal karte hain aur sahi confirmation ke saath istemal karte hain, to yeh unke liye faida mand ho sakta hai.


                      • #12 Collapse

                        Dragonfly doji candlestick patterns

                        Click image for larger version

Name:	download (26).png
Views:	27
Size:	6.9 کلوبائٹ
ID:	12864254

                        Dragonfly Doji Candlestick Patterns


                        Candlestick patterns are visual representations of price movements in financial markets. The Dragonfly Doji is a type of candlestick pattern that can indicate potential trend reversals or continuation.

                        Dragonfly Doji

                        Dragonfly Doji ek candlestick pattern hai jo market mein price movement ko darust karnay ka ek signal deta hai. Is pattern ko dekhnay se trader ko samajh aati hai ke market ka trend kis tarah ja sakta hai.

                        Tasvir-e-Aghwa

                        Dragonfly Doji ki tasvir mein candle ki body ka koi bara hissa nahi hota. Upper shadow (bara sar) aur lower shadow (chhota sar) dono hi bohot lambay hote hain, aur candle ki body kafi chhoti hoti hai. Iski shape ek dragonfly ki tarah hoti hai, jis se iska naam Dragonfly Doji hai.

                        Mafhoom

                        Dragonfly Doji ka mafhoom hota hai ke market mein buyers aur sellers ke darmiyan taqreeban barabar ka mawad hai. Iska matlab hai ke market mein koi bhi clear direction nahi hai aur uncertainty ka mahol hai.

                        Mataalbaat

                        Jab Dragonfly Doji candlestick pattern market mein aata hai, to yeh indicate karta hai ke current trend khatam ho sakta hai ya phir ek naya trend shuru ho sakta hai. Agar yeh pattern bearish trend ke baad aata hai, to yeh bullish reversal signal bhi de sakta hai. Aur agar yeh bullish trend ke baad aata hai, to yeh bullish trend ki continuation ka indication ho sakta hai.

                        Tawajjo

                        Traders ko Dragonfly Doji pattern ke sath sath dusri technical indicators ka bhi istemal karna chahiye taake yeh confirm kiya ja sake ke kya actual trend reversal ya continuation hone wala hai.

                        Dragonfly Doji ek powerful candlestick pattern hai jo traders ko market ka direction samajhne mein madad karta hai. Lekin, is pattern ko sirf doosri confirmatory indicators ke sath istemal karna chahiye taake accurate trading decisions liya ja sake.


                        • <a href="https://www.instaforex.org/ru/?x=ruforum">InstaForex</a>
                        • #13 Collapse

                          Dragonfly Doji Candlestick Pattern

                          Dragonfly Doji candlestick pattern ek technical analysis tool hai jo financial markets mein istemal hota hai, khas tor par stock market mein. Ye pattern candlestick charts par dikhai dene wala ek specific candlestick hai jo traders ke liye price action ka ek mahatvapurn indication provide karta hai.

                          Dragonfly Doji kya hota hai?

                          Dragonfly Doji ek single candlestick pattern hai jo price action ko indicate karta hai jahan market mein reversal ho sakta hai. Ye candlestick pattern typically bullish reversal ke indication ke roop mein dekha jata hai, yaani ki jab market downtrend se uptrend mein badalne ki sambhavna hoti hai. Is pattern ko recognize karne ke liye, ek candlestick ka open, high, low, aur close prices ko dekha jata hai.


                          Dragonfly Doji candlestick mein:
                          1. Open, high, aur close prices lagbhag ek hi level par hote hain.
                          2. Low price market mein lowest point ko indicate karta hai.
                          3. Upper shadow ya wick nahi hota hai.

                          Ye candlestick pattern ek damroo ya dragonfly jaise dikhta hai, jismein upper aur lower shadow nahi hota, sirf ek lamba body hota hai.

                          Trading Strategy:

                          Dragonfly Doji candlestick pattern ka istemal karke traders market mein reversal ke signals ko samajhte hain aur trading decisions lete hain. Yahan kuch trading strategies hain jo Dragonfly Doji pattern ke istemal ko shamil karte hain:
                          1. Confirmation with Volume: Dragonfly Doji pattern ko confirm karne ke liye, traders volume ke sath dekhte hain. Agar Dragonfly Doji high volume ke sath form hota hai, to ye bullish reversal signal ko strengthen karta hai.
                          2. Wait for Confirmation Candle: Traders typically wait karte hain ek confirmation candle ke liye jo Dragonfly Doji ke baad form hota hai. Agar next candle bullish hai aur higher high ya higher close ke sath form hota hai, to ye bullish reversal ke confirmation ke roop mein consider kiya jata hai.
                          3. Support and Resistance: Dragonfly Doji pattern ko support aur resistance levels ke sath combine karke bhi istemal kiya ja sakta hai. Agar Dragonfly Doji ek strong support level ke near form hota hai, to ye bullish reversal ke chances ko aur bhi jyada badha deta hai.
                          4. Use of Technical Indicators: Traders technical indicators jaise ki RSI (Relative Strength Index) ya MACD (Moving Average Convergence Divergence) ka istemal karke bhi Dragonfly Doji ke signals ko confirm karte hain. Agar indicators bhi bullish reversal ko suggest karte hain, to ye Dragonfly Doji pattern ko validate karta hai.
                          5. Risk Management: Har trading strategy mein risk management ka mahatva hota hai. Dragonfly Doji pattern ke istemal mein bhi traders apne risk ko manage karte hain, stop-loss orders ka istemal karke.
                          6. Multiple Time Frame Analysis: Traders multiple time frame analysis ka istemal karke Dragonfly Doji ke signals ko confirm karte hain. Agar Dragonfly Doji daily chart par form hota hai aur higher time frame jaise ki weekly chart par bhi bullish signals dikhte hain, to ye reversal ke chances ko aur bhi jyada badha deta hai.

                          Click image for larger version

Name:	USDCHF-Trading-the-dragonfly.png
Views:	25
Size:	35.8 کلوبائٹ
ID:	12864577
                          Conclusion:

                          Dragonfly Doji candlestick pattern ek powerful reversal signal hai jo traders ko market mein potential turning points ko identify karne mein madad karta hai. Is pattern ko samajhne aur istemal karne ke liye, traders ko market analysis aur technical indicators ka istemal karna aata hona chahiye. Saath hi, risk management ka dhyan rakhna bhi mahatvapurn hai taaki trading decisions ko sahi tarah se implement kiya ja sake.


                          اب آن لائن

                          Working...
                          X