Pivot Point Indicator
No announcement yet.
X
  • وقت
  • دکھائیں
Clear All
new posts
  • #1 Collapse

    Pivot Point Indicator
    Pivot Point Indicator ek technical analysis ka aala hai jo forex trading mein wazeh taur par istemal hota hai. Ye tijarat karne walayon ko madad karta hai ke wo mumkinah keemat darajat ko pehchanain jo ke support ya resistance ka kaam kar sakti hain, aur isay tijarat ke liye daakhil aur nikalne ke points maloom karne ke liye istemal kiya ja sakta hai. Pivot point indicator ek hisaab kitaabat hai jo kisi moaini dor ke dauran ek currency pair ki high, low, aur close keemat par mushtamil hoti hai. Is hisaab kitaabat mein high, low, aur close keemat ko jama kar ke unko teen se taqseem kiya jata hai taake pivot point maloom ho sake. Ye pivot point phir is currency pair ke liye mazeed support aur resistance darajat maloom karne ke liye istemal hota hai.


    Pivot point indicator aam taur par 14 period ke doran hisaab lagaya jata hai, lekin doosre dorat bhi istemal kiye ja sakte hain. 14 period ka dorat is liye aam istemal hota hai kyun ke ye short-term aur long-term ke darmiyan acha balance pesh karta hai.

    Pivot Point Indicator Working

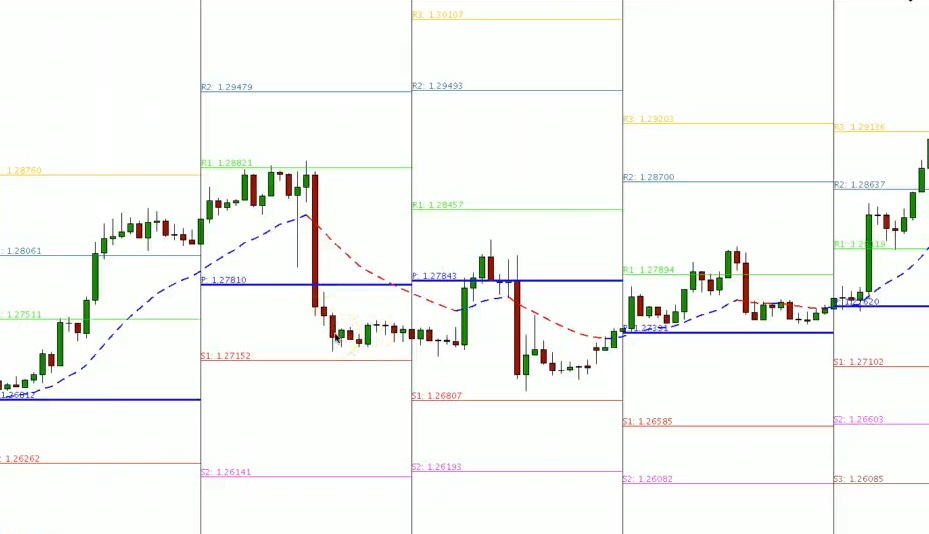
    Pivot point indicator ka kaam yeh hai ke wo currency pair ke liye mumkinah support aur resistance darajat ko pehchanay. Support darajat wo keemat hain jahan currency pair girna band kar ke phir se ooper ki taraf chalne lagta hai, jabke resistance darajat wo keemat hain jahan currency pair chadhna band kar ke neeche ki taraf chalne lagta hai. Pivot point khud hi pivot point indicator ka sab se ahem darja hai. Ye support aur resistance ke darmiyan beech ka maidan hai aur ye currency pair ke liye u-turn point ka kaam kar sakta hai. Agar currency pair ki keemat pivot point ke ooper chali jaye, to is ka matlab hai ke bullish jazbat barh rahe hain, jabke agar keemat pivot point ke neeche chali jaye, to is ka matlab hai ke bearish jazbat barh rahe hain.

    Pivot point ke ilawa pivot point indicator high, low, aur close keematon par mushtamil support aur resistance darajat bhi maloom karta hai. Ye darajat pivot point par mushtamil hone wale formulas par mabni hote hain. Support darajat pivot point ke neeche hote hain, jabke resistance darajat pivot point ke uper hote hain.


    Uses Of Pivot Point Indicator
    • Determining Entry and Exit Points: Traders pivot point indicator ke hisaab se nikale gaye support aur resistance darajat ka istemal kar ke daakhil aur nikalne ke points maloom kar sakte hain. Agar currency pair support daraja ko qareeb aata hai, to is ka matlab hai ke ye oversold hai aur ooper ki taraf chalne ke liye mumkinah hai. Ulti sorat mein, agar currency pair resistance daraja ko qareeb aata hai, to is ka matlab hai ke ye overbought hai aur neeche ki taraf chalne ke liye mumkinah hai. Traders jab currency pair support daraja ko qareeb aata hai to long positions le sakte hain, aur jab currency pair resistance daraja ko qareeb aata hai to short positions le sakte hain.
    • Setting Stop Loss Orders: Traders pivot point indicator ke hisaab se nikale gaye support aur resistance darajat ka istemal kar ke apni trades ke liye stop loss orders laga sakte hain. Agar trader ne long position le li hai jab currency pair support daraja ko qareeb aata hai, to wo apna stop loss order support daraja ke neeche lagakar nuksan kam kar sakte hain agar keemat girte hue bhi rahi. Ulti sorat mein, agar trader ne short position le li hai jab currency pair resistance daraja ko qareeb aata hai, to wo apna stop loss order resistance daraja ke ooper lagakar nuksan kam kar sakte hain agar keemat chadte hue bhi rahi.
    • Determining Target Prices: Traders pivot point indicator ke hisaab se nikale gaye support aur resistance darajat ka istemal kar ke apni trades ke liye maqsood keemat maloom kar sakte hain. Agar trader ne long position le li hai jab currency pair support daraja ko qareeb aata hai, to wo apni maqsood keemat ko resistance daraja ke ooper set karke ye faida utha sakte hain ke currency pair ki keemat ooper chalne ki taraf hai. Ulti sorat mein, agar trader ne short position le li hai jab currency pair resistance daraja ko qareeb aata hai, to wo apni maqsood keemat ko support daraja ke neeche set karke ye faida utha sakte hain ke currency pair ki keemat neeche chalne ki taraf hai.
    Believe in yourself and your abilities. When you fight for your dreams, you can achieve anything.
  • <a href="https://www.instaforex.org/ru/?x=ruforum">InstaForex</a>
  • #2 Collapse

    Pivot Point Indicator


    Pivot Point Indicator (Pivot Point Indicator):

    1. Ta'aruf (Introduction): Pivot Point Indicator ek technical analysis tool hai jo traders ko support aur resistance levels determine karne mein madad karta hai. Ye indicator aksar intraday trading mein istemal hota hai.

    2. Kaise Kaam Karta Hai (How it Works): Pivot Point Indicator market ke previous day's high, low, aur close prices ka average calculate karta hai. Is average ko fir different formulas ke zariye modify kiya jata hai, jisse support aur resistance levels tay kiye ja sakte hain.

    3. Key Levels (Ahem Levels):
    • Pivot Point (Markazi Nukta): Ye point calculate kiya jata hai aur isay market ka central level samjha jata hai. Agar price is point ke upar hai, toh ye indicate karta hai ke market bullish hai, jabke agar neeche hai toh ye bearish hai.
    • Support Levels (Support Nukte): Pivot Point ke neeche ke levels ko support levels kaha jata hai, jahan se price ka bounce-back ho sakta hai.
    • Resistance Levels (Resistance Nukte): Pivot Point ke upar ke levels ko resistance levels kaha jata hai, jahan se price ka reversal ya downtrend shuru ho sakta hai.

    4. Types (Qisam):
    • Standard Pivot Points: Ye daily, weekly, aur monthly basis par calculate kiye jate hain.
    • Fibonacci Pivot Points: Fibonacci ratios ka istemal karke calculate kiye jate hain.
    • Woodie's Pivot Points: Ye bhi daily basis par calculate kiye jate hain aur previous day's open, high, low, aur close prices ka istemal hota hai.

    5. Trading Strategy (Trading Strategy):
    • Pivot Point Indicator ka istemal entry aur exit points tay karne mein kiya ja sakta hai.
    • Agar price Pivot Point ke upar hai, toh traders ko bullish trend ki expectations ho sakti hain, aur agar neeche hai toh bearish trend ki expectations ho sakti hain.

    6. Savdhanaiyan (Caveats):
    • Sirf Pivot Points par pura bharosa na karein, aur hamesha doosre technical tools aur indicators ka bhi istemal karein.
    • Market conditions ke mutabiq stop-loss aur take-profit levels ko set karna zaroori hai.

    Pivot Point Indicator ke saath trading karte waqt, traders ko market ke overall conditions ka bhi dhyan rakhna chahiye aur risk management ka istemal karna chahiye.
    • #3 Collapse

      Forex trading me "Pivot Point Indicator" ek important tool hai, jisse traders price action analysis aur technical analysis ke liye use karte hai. Ye indicator support aur resistance levels ko identify karne me madad karta hai.

      Pivot Points, previous day's high, low, aur close prices par based hote hai. Ye levels market sentiment aur price movement ke analysis me help karte hai. Pivot Point Indicator ke use se traders pivot points ke levels ke around trading decisions le sakte hai.

      Click image for larger version

Name:	grade8-pivot-points-range-end-thumbnail.png
Views:	17
Size:	48.7 کلوبائٹ
ID:	12786439

      Pivot Points ke calculations me kuch terms hote hai:

      1. Pivot Point (PP):
      Pivot Point ek central level hota hai, jo previous day's high, low aur close prices ka average hota hai. Isse current day ke support aur resistance levels calculate kiye jaate hai.

      2. Support Levels:
      Support levels price neeche ki taraf hoti hai, jahaan price down trend me tham sakti hai aur reversal ho sakti hai.

      3. Resistance Levels:
      Resistance levels price up trend me hoti hai, jahaan price up trend me slow ho sakti hai aur reversal ho sakti hai.

      4. R1, R2, R3:
      R1 ek resistance level hota hai, jiska calculation pivot point aur previous day's low aur high se kiya jata hai. R2 aur R3 higher resistance levels hote hai.

      5. S1, S2, S3:
      S1 ek support level hota hai, jiska calculation pivot point aur previous day's low aur high se kiya jata hai. S2 aur S3 lower support levels hote hai.

      Pivot Point Indicator ki calculation ke liye bahut sare online calculators aur trading platforms available hai. Ye tools traders ko pivot point values provide karte hai, jinse wo trading decisions le sakte hai.

      Pivot Point Indicator ke saath traders aur bhi technical indicators use karte hai, jaise ki moving averages, trend lines, aur oscillator indicators. In sabki sahayata se traders market ki strength aur direction determine kar sakte hai, aur profitable trading decisions le sakte hai.
      • #4 Collapse

        Pivot Point Indicator

        Click image for larger version

Name:	download (9).png
Views:	26
Size:	5.4 کلوبائٹ
ID:	12786441

        Pivot Point Indicator ek technical analysis tool hai jo traders ko potential support aur resistance levels provide karta hai. Ye indicator market trend ka direction determine karne aur possible reversal points identify karne mein madad karta hai. Traders iska istemal karke price movement ko analyze karte hain.

        Pivot Point Indicator ka Tijarat Mein Istemal:
        1. Pivot Point Calculation:
          • Pivot Point calculate karne ke liye, aapko previous trading session ka High (H), Low (L), aur Close (C) price chahiye hote hain. Pivot Point ka basic formula ye hai: Pivot Point (PP)=High+Low+Close3Pivot Point (PP)=3High+Low+Close​
        2. Support aur Resistance Levels:
          • Pivot Point ke around, aapko support aur resistance levels milte hain.
            • Pivot Point (PP): Central point, iske upar se trading bullish aur iske neeche se bearish consider kiya jata hai.
            • Support 1 (S1) aur Resistance 1 (R1): In levels ko traders pehle support aur resistance levels ke taur par dekhte hain.
            • Support 2 (S2) aur Resistance 2 (R2): Ye levels strong support aur resistance levels represent karte hain.
        3. Trading Decisions:
          • Agar price Pivot Point se upar hai, toh traders bullish sentiments expect kar sakte hain. Ismein wo support aur resistance levels ko dekhte hain for potential buy/sell points.
          • Agar price Pivot Point se neeche hai, toh traders bearish sentiments expect kar sakte hain aur fir bhi wo support aur resistance levels par focus karte hain.
        4. Pivot Point Indicator ke Types:
          • Standard Pivot Points: Jisme H, L, aur C ka use hota hai.
          • Fibonacci Pivot Points: Jisme Fibonacci ratios ka use hota hai price levels calculate karne ke liye.
        5. Timeframes:
          • Pivot Point Indicator ko different timeframes par dekha ja sakta hai, jaise ke daily, weekly, ya monthly, taki traders ko alag-alag trading perspectives mil sake.
        6. Combination with Other Indicators:
          • Traders ise doosre technical indicators ke saath combine karke use karte hain for more accurate trading decisions.

        Pivot Point Indicator, market analysis mein ek important tool hai jo traders ko potential entry aur exit points suggest karta hai. Iska use day trading, swing trading, aur trend trading mein hota hai. Hamesha yaad rahe ke ek indicator ko individually na lekar, market conditions aur doosre factors ke saath combine karna important hai
        • <a href="https://www.instaforex.org/ru/?x=ruforum">InstaForex</a>
        • #5 Collapse

          Pivot Point Indicator, forex trading mein technical analysis ke liye istemal hone wala ek popular tool hai. Ye traders ko market trend ka direction samajhne aur support/resistance levels ka estimation karne mein madad karta hai. Pivot points market volatility ko samajhne aur trading decisions ko improve karne mein useful ho sakte hain.

          Pivot points trading mein central pivot point (CPR) aur uske aas-pass ke support aur resistance levels ko identify karte hain. Yeh levels based hote hain on the previous day's high, low, and close prices. Sabse common pivot point calculation formula hai:


          Pivot Point (PP)=(High+Low+Close​)/3


          R1=(2×PP)−Low

          Support 2 (S2) and Resistance 2 (R2):
          S
          S2=PP−(High−Low)
          R
          R2=PP+(High−Low)

          Support 3 (S3) and Resistance 3 (R3)
          S3=Low−2×(High−PP)
          R3=High+2×(PP−Low)

          Pivot point indicator ka istemal karke traders ye levels identify kar lete hain aur inko apne trading strategies mein include kar sakte hain. For example, agar market pivot point ke upar hai toh ye indicate kar sakta hai ki market bullish ho sakti hai, aur agar market pivot point ke niche hai toh ye bearish sentiment ko suggest kar sakta hai.

          Hedging aur pivot points ka seedha koi taalluq nahi hota. Hedging, asal mein, risk management strategy hai jisme aap apne positions ko protect karne ke liye opposing positions lete hain. Pivot points, technical analysis ka hissa hain jo market trends aur potential reversals ko identify karne mein madad karta hai. Ye dono alag-alag concepts hain, lekin traders inko saath mein istemal kar sakte hain apne trading decisions ko improve karne ke liye.

          Pivot Point Levels:

          Support 1 (S1): Is level ko market ka expected support point mana jata hai.
          Resistance 1 (R1): Is level ko market ka expected resistance point mana jata hai.
          Support 2 (S2) and Resistance 2 (R2): Ye levels bhi support aur resistance ko represent karte hain, lekin S2 aur R2 levels S1 aur R1 ke comparison mein thoda door hote hain.
          Traders pivot point indicator ka istemal karke market trend ko samajhne, potential entry aur exit points ko decide karne mein aur risk management ke liye istemal karte hain. Yeh tool market volatility aur price action analysis mein madad karta hai.

          Pivot points har din ke liye calculate kiye ja sakte hain, aur iske variations bhi hote hain, jaise Weekly Pivot Points ya Monthly Pivot Points. Traders ko chahiye ki woh is indicator ko apni overall trading strategy ke hisab se istemal karein, aur market conditions ko dhyan mein rakhein.

          اب آن لائن

          Working...
          X