Double Bottom Candlestick Pattern par trade karny ki Mukamal Info
X
  • وقت
  • دکھائیں
Clear All
new posts
  • #1 Collapse

    Double Bottom Candlestick Pattern par trade karny ki Mukamal Info
    Candlestick patterns, market mein aam taur par istemal hone wale technical analysis ka aham hissa hain. In patterns mein se ek jo khaas ahmiyat rakhta hai, woh hai "Double Bottom Candlestick Pattern." Is pattern ki samajh, tijarat mein kamiyabi hasil karne mein madadgar sabit ho sakti hai.

    Double Bottom Pattern Kya Hai?

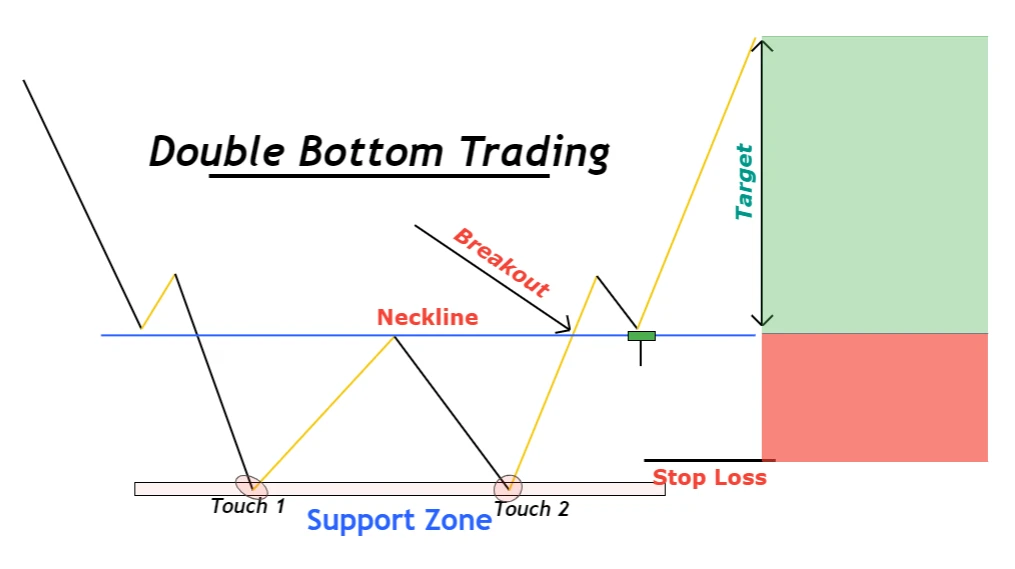
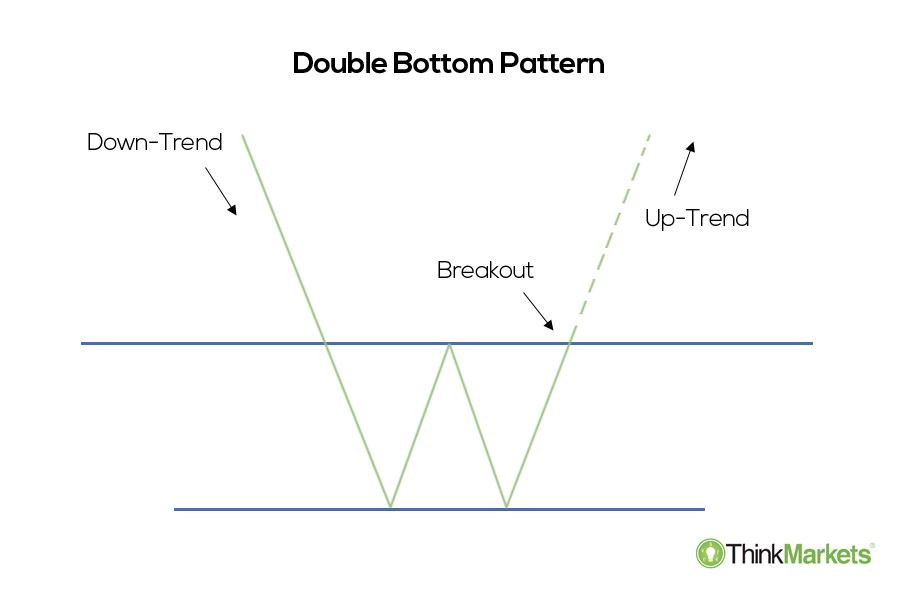
    "Double Bottom" ek aisa chart pattern hai jo market mein trend reversal ko darust karti hai. Yeh pattern do neechay girne wale price levels ko darust karta hai, lekin phir dobara se usay tezi se upar le aata hai. Is pattern ka naam isliye hai kyunki chart par yeh do neechay ki taraf koode ki tarah dikhayi deta hai.

    Double Bottom Ki Pechan:

    1.
    Pehli Girawat (First Bottom): Sab se pehle, market mein ek downtrend hota hai, jismein prices neeche ja rahe hote hain. Is downtrend ke baad, ek bottom ban jata hai, jo indicate karta hai ke sellers ki control kamzor ho rahi hai.

    Click image for larger version

Name:	Screenshot_2023-12-02-17-49-44-97_40deb401b9ffe8e1df2f1cc5ba480b12.jpg
Views:	29
Size:	42.3 کلوبائٹ
ID:	12786122

    2. Recovery: Dusri step mein, prices mein izafah hota hai aur market mein kuch stability aati hai. Yeh indicate karta hai ke buyers ne control haasil kiya hai aur trend reversal ho sakta hai.

    3. Dobara Girawat (Second Bottom): Fir se prices thodi neeche ja sakti hain, lekin pehli girawat se kam nahi honi chahiye. Agar prices pehle girawat ke neeche nahi jaati, to yeh confirmatory signal hota hai.

    4. Confirmation of Reversal: Double Bottom pattern tab complete hota hai jab prices dobara se tezi se upar chale jaate hain aur pehle bottom ke level ko cross karte hain. Yeh confirmation hoti hai ke market trend reversal kar chuki hai aur ab uptrend shuru ho gaya hai.
    ​​​​​
    Double Bottom Ka Istemal Tijarat Mein:

    Double Bottom pattern ka sahi taur par istemal karne ke liye kuch zaroori points hain:

    1. Volume Analysis: Pattern ke confirm hone par, trader ko volume ki bhi madad leni chahiye. Agar uptrend ke doran volume bhi barh raha hai, to yeh confirm karta hai ke market mein asli tezi aayi hai.

    2. Target Price: Trader ko yeh bhi decide karna hoga ke kitna target price set karna hai. Iske liye pehle bottom se le kar pattern ke height ko measure kiya jata hai.

    3. Stop Loss: Hamesha risk management ka khayal rakhna zaroori hai. Stop loss lagana important hai taki nuksan se bacha ja sake.

    Click image for larger version

Name:	Screenshot_2023-12-02-17-49-24-78_40deb401b9ffe8e1df2f1cc5ba480b12.jpg
Views:	25
Size:	55.9 کلوبائٹ
ID:	12786123

    Double Bottom Pattern Ka Faida:

    Is pattern se traders ko early trend reversal ka pata chalta hai, jisse unhe behtar entry point milta hai.

    Market sentiment mein badlav aane par is pattern ki madad se faida uthaya ja sakta hai.

    Properly istemal karne par, yeh ek mufeed tijarat ka tareeqa sabit ho sakta hai.

    Conclusion:

    Double Bottom Candlestick Pattern, market analysis mein ek powerful tool hai jo traders ko trend reversal ka pata lagane mein madad karta hai. Isko samajhna aur sahi taur par istemal karna, tijarat mein kamiyabi hasil karne mein ek ahem kadam ho sakta hai.
    where there’s a will, there’s a way..

    Confidence is not ‘I will profit on this trade.’ Confidence is ‘I will be fine if I don’t profit from this trade.”
  • <a href="https://www.instaforex.org/ru/?x=ruforum">InstaForex</a>
  • #2 Collapse

    Double Bottom Candlestick Pattern par trade karny ki Mukamal Info

    Click image for larger version

Name:	AgkHZ7CE_mid.png
Views:	45
Size:	64.2 کلوبائٹ
ID:	12786129


    Double Bottom Candlestick Pattern:

    Candlestick patterns are essential tools for technical analysis in trading. The Double Bottom pattern is a bullish reversal pattern that signals a potential trend reversal from a downtrend to an uptrend. Here's a comprehensive guide to understanding and trading the Double Bottom pattern.
    1. Mud Introduction:


    Double Bottom ek bullish reversal pattern hai jo indicate karta hai ke market mein bearish trend se bullish trend ki taraf mawafiqi ho sakti hai.
    2. Pattern Ki Tashkeel:


    Double Bottom pattern do neechay ki taraf milti julti do low points se bana hota hai jo aapas mein mazeed se door hote hain.
    3. Pehli Low (Bottom):


    Pehli bottom market mein bearish phase ke doraan paida hota hai aur isay "support level" ke tor par dekha ja sakta hai.
    4. Pehli Recovery:


    Pehli bottom ke baad, market mein ek taraqi ya recovery hoti hai, lekin ye abhi complete nahi hoti.
    5. Dusri Low (Second Bottom):


    Dusri bottom pehli se thodi upper level par hoti hai aur isay bhi support level ke tor par dekha ja sakta hai.
    6. Volume Ka Tafseelat:


    Is pattern mein volume ka bhi tawajjo di jati hai. Dusre bottom ke waqt, trading volume barhna shuru hota hai, jo bullish reversal ko darust karti hai.
    7. Pattern Ki Tasdeeq:


    Double Bottom ki tasdeeq ke liye, market ko dusri bottom ke upar se guzarna zaroori hai. Agar ye ho jaye, to ye pattern confirm hota hai.
    8. Stop Loss Aur Target Level:


    Trade ke doran stop loss ko pehli bottom ke neeche aur target level ko pattern ke height ke mutabiq set karna ahem hai.
    9. Trading Strategies:


    Double Bottom pattern ke trading strategies mein shamil hai ke traders ko confirmation ka intezaar karna chahiye aur phir entry point aur exit point tay karna chahiye.
    10. Naseehat:


    Har pattern ki tarah, Double Bottom pattern par amal karte waqt risk management ka khayal rakhna zaroori hai. Har trade mein apne risk tolerance ke mutabiq faisle lena ahem hai.

    Double Bottom candlestick pattern ka istemal karke traders market trends ko sahi taur par samajh sakte hain aur behtareen entry aur exit points tay kar sakte hain. Yeh ek powerful tool hai jo technical analysis mein istemal hota hai, lekin yaad rahe ke kisi bhi strategy ko istemal karte waqt hamesha apne investment goals aur risk tolerance ko madde nazar rakhein.
    • #3 Collapse


      Forex tijarat mein, candlestick patterns traders ke liye aham malumat ka sarchashma hote hain. In patterns ke zariye traders market trends aur price movements ko samajh kar apne trading decisions ko behtar bana sakte hain. Ek aise mahatva purna pattern mein se ek hai "Double Bottom" ya "Do Martaba Niche Aane Wala" candlestick pattern. Chaliye samajhte hain ke double bottom pattern kya hota hai aur is par trade karny ki mukamal malumat kya hai.


      Double Bottom Candlestick Pattern


      Double bottom pattern market mein hone wale trend reversal ko darust karta hai. Is pattern mein price chart par do nichli (downward) kecandlesticks hote hain jo aapas mein milte hain aur ek bottom (tareef) banate hain. Yeh pattern bearish trend ke badle bullish trend ki shuruaat hone ki soorat mein hota hai.


      Double Bottom Pattern Ka Tafsili Bayan:


      Pehli Girawat

      Pehli stage mein market mein girawat hoti hai jiski wajah se price chart par ek bottom ban jata hai.

      Recovery aur Dobarah Girawat:

      Phir market mein aik muddat ke baad dobara girawat hoti hai, lekin is girawat mein pehle se kam intensity hoti hai aur price chart par doosra bottom ban jata hai.

      Pattern Complete Hona:

      Double bottom pattern complete hota hai jab dono bottoms aapas mein milte hain aur iske bad price chart mein tezi se izafa hone lagta hai.

      Double Bottom Pattern Par Trade Karny Ki Strategy:


      Pattern Confirmation:

      Double bottom pattern ko trade se pehle confirm karna zaroori hai. Confirmatory indicators ka istemal karke is pattern ko samajhna chahiye.

      Entry Point:

      Pattern ko confirm hone ke bad entry point tay karna zaroori hai. Traders aksar doosre bullish signals ke sath entry point tay karte hain.

      Stop-Loss aur Take-Profit:

      Har trade mein risk management ke liye stop-loss aur take-profit levels tay kiye jate hain.

      Volume Analysis:

      Double bottom pattern ke trade mein volume analysis ka bhi ahem role hota hai. Volume ke sath izafa hone par pattern aur bhi reliable ho jata hai.

      Double Bottom Pattern Ka Faida:

      Trend Reversal Indication:

      Double bottom pattern bearish trend se bullish trend ki taraf jane ka signal deta hai.

      Entry Point Tariqa:

      Traders ko double bottom pattern se ek clear entry point milta hai jisse woh behtar trading decisions le sakte hain.

      Risk Management:

      Is pattern ke trade mein stop-loss aur take-profit levels ka tay karna risk management ko behtar banata hai.


      Double bottom candlestick pattern forex trading mein ek mufeed tool hai jo traders ko market trends ko samajhne mein madad karta hai. Is pattern ka sahi taur par istemal karne ke liye, traders ko market ko regular basis par monitor karna chahiye. Hamesha yaad rahe ke koi bhi single indicator ko standalone signal ki tarah na lein aur doosre confirmatory signals ko bhi shamil karein. Double bottom pattern ke sahi taur par istemal se, traders apne trading decisions ko improve kar sakte hain aur market ke asar ko behtar taur par samajh sakte hain.


      There is a time to go long, a time to go short and a time to go fishing.
      ​​​​​​​

      ​​​​​​​
      • #4 Collapse

        Double Bottom Candlestick:
        Asalam-o-alikum !
        Bottom candlestick pattern ka istemal karke traders market trends ko sahi taur par samajh sakte hain aur behtareen entry aur exit points tay kar sakte hain. Yeh ek powerful tool hai jo technical analysis mein istemal hota hai lekin yaad rahe ke kisi bhi strategy ko istemal karte waqt hamesha apne investment goals aur risk tolerance ko madde nazar rakhein. forex trading mein ek mufeed tool hai jo traders ko market trends ko samajhne mein madad karta hai. Is pattern ka sahi taur par istemal karne ke liye traders ko market ko regular basis par monitor karna chahiye. Hamesha yaad rahe ke koi bhi single indicator ko standalone signal ki tarah na lein aur doosre confirmatory signals ko bhi shamil karein.
        Trading Strategies and analysis of market:
        patterns traders ke liye aham malumat ka sarchashma hote hain. In patterns ke zariye traders market trends aur price movements ko samajh kar apne trading decisions ko behtar bana sakte hain. Ek aise mahatva purna pattern mein se ek hai Double Bottom ya do Martaba niche Aane Wala candlestick pattern. Chaliye samajhte hain ke double bottom pattern kya hota hai aur is par trade karny ki mukamal malumat kya hai. chart pattern hai jo market mein trend reversal ko darust karti hai. Yeh pattern do neechaye girney wale price levels ko darust karta hai lekin phir dobara se usay tezi se upar le aata hai. Is pattern ka naam isliye hai kyunki chart par yeh do neechay ki taraf koode ki tarah dikhaye deta hai. pattern market mein hone wale trend reversal ko darust karta hai. Is pattern mein price chart par do nichle ke candlestick hote hain jo aapas mein milte hain aur ek bottom banate hain. Yeh pattern bearish trend ke badle bullish trend ki shuruaat hone ki soorat mein hota hai thanks..
        ​​
        • #5 Collapse

          Double Bottom Candlestick Pattern par trade karny ki Mukamal Info

          Click image for larger version

Name:	download (5).png
Views:	42
Size:	4.3 کلوبائٹ
ID:	12786298


          Double Bottom Candlestick Pattern -
          1. Pattern Ki Tafseel (Details):
          • Double Bottom Pattern, market mein trend reversal ko indicate karne wala ek chart pattern hai.
          • Is pattern mein do neeche ki taraf (downward) hone wale troughs (nichlay points) hote hain, jin mein pehla trough doosre se chhota hota hai.
          • Yeh pattern ek downtrend ke baad aata hai aur future mein uptrend ko suggest karta hai.

          2. Pattern Ki Pehchan (Identification of the Pattern):
          • Double Bottom Pattern ki pehchan, market mein do neeche ke points (troughs) ki sequence se hoti hai.
          • Pehla trough banne ke baad, price mein ek recovery hoti hai, phir dobara se price gir kar doosra trough banata hai.
          • Iske baad, price dobara se upar ki taraf move karta hai, jise trend reversal ke roop mein dekha jata hai.

          3. Tafseelat (Details) aur Matn (Meaning):
          • Double Bottom Pattern, market mein bears ka control kamzor hone aur bulls ka dominance shuru hone ko dikhata hai.
          • Jab price dobara se upar ki taraf move karta hai, toh ye uptrend ki shuruaat ko indicate karta hai.
          • Traders is pattern ko dekhte hain taki woh potential entry points tay karen aur trend reversal ka faida utha saken.

          4. Entry Points Aur Stop-Loss:
          • Entry Points: Jab price dobara se upar ki taraf move karti hai aur trend reversal confirm hota hai, traders entry points tay kar sakte hain.
          • Stop-Loss: Hamesha stop-loss orders ka istemal karein taake market ke unexpected moves ke khilaf aapki investment secure rahe.

          5. Confirmation Ke Liye Doosre Indicators:
          • Volume Analysis: Double Bottom pattern ke confirmation ke liye volume analysis bhi dekha jata hai. Agar price increase ke saath volume bhi badh raha hai, toh ye confirmation ko strong banata hai.
          • RSI (Relative Strength Index): RSI ka istemal karke overbought ya oversold conditions ko confirm karein.

          6. Ehtiyaat (Caution):
          • Confirmation: Double Bottom pattern ko dekhte waqt hamesha confirmatory signals ka bhi intezar karein.
          • Risk Management: Har trade mein risk management ka khayal rakhein aur apne trading plan ke mutabiq hi amal karein.

          Double Bottom pattern, market trends ko samajhne aur trend reversal points ko identify karne mein madadgar ho sakta hai. Lekin, hamesha ehtiyaat aur confirmatory signals ke sath trading karein.


          • #6 Collapse

            Double bottom candlestick pattern par trade karny ki mukamal info


            Click image for larger version

Name:	dp.png
Views:	20
Size:	11.6 کلوبائٹ
ID:	12786313


            Double bottom candlestick pattern ek technical analysis tool hai jo market trends ko analyze karne mein istemal hota hai. Yeh pattern bearish trend ke bad ek reversal signal deta hai aur traders ko indicate karta hai ki market mein potential bullish movement ho sakta hai.


            Yahan, double bottom pattern par trade karne ke liye mukamal information di gayi hai:


            Double Bottom Pattern Kya Hai?

            Double bottom ek reversal pattern hai jo market mein trend change ko darust karti hai. Ismein do lows hote hain, jo ek dusre ke bohot kareeb hote hain aur ek common support level par hote hain. Yeh pattern bearish trend ke bad hota hai aur bullish trend ki shuruaat ko indicate karta hai.

            Trade Entry Points:
            1. Confirmation Wait Karein: Double bottom pattern ko confirm karne ke liye, traders ko wait karna chahiye jab tak pattern complete na ho. Complete hone ke liye, second bottom ke bad ek upside move hona chahiye.
            2. Neckline Breakout: Entry point ka mukhya hissa neckline ka breakout hota hai. Jab price apne neckline ko cross karta hai, tab traders ko samajh aata hai ki bullish reversal ho sakti hai.

            Stop-Loss Aur Target Levels:
            1. Stop-Loss: Stop-loss level ko set karte waqt, traders ko dhyan rakhna chahiye ki woh market volatility aur risk tolerance ke hisab se set karein. Stop-loss level ko usually double bottom pattern ke lowest point ke neeche set kiya jata hai.
            2. Target Levels: Target levels ko set karte waqt, traders neckline ke level ko dekhte hain. Pattern ka height calculate kiya jata hai aur phir woh distance target level ke liye use hota hai.

            Risk Management:
            1. Position Size: Position size ko manage karna important hai. Trading capital ka ek chhota hissa ek trade ke liye use karna se risk kam hota hai.
            2. Risk-Reward Ratio: Har trade mein risk-reward ratio ko dhyan mein rakhna important hai. Ideally, risk-reward ratio 1:2 ya usse zyada hona chahiye.

            Monitoring Aur Adjustments:
            1. Market News: Market news aur events ko monitor karein. Kuch unexpected events ke baare mein pata chalne par trade ko adjust karein.
            2. Trail Stop: Jab market favorable hota hai, trail stop order ka istemal karke profit ko secure karna ek effective strategy ho sakti hai.

            Double bottom pattern par trade karte waqt, technical analysis ke saath-saath market fundamentals aur news ko bhi dhyan mein rakhna important hai. Trading mein risk management ka dhyan rakhna aur discipline maintain karna bhi crucial hai. Always remember that trading involves risk, and it's important to only trade with capital that you can afford to lose.
            • <a href="https://www.instaforex.org/ru/?x=ruforum">InstaForex</a>
            • #7 Collapse

              double bottom candlestick pattern par trade karny ki mukamal info

              Click image for larger version

Name:	dobl.png
Views:	17
Size:	11.6 کلوبائٹ
ID:	12786341


              "Double Bottom" ek candlestick pattern hai jo market mein trend reversal ko identify karne ke liye istemal hota hai. Yeh pattern generally bearish trend ke baad aata hai aur bullish trend ki shuruaat ko darust karta hai.


              Yahan kuch key points hain jo double bottom pattern par trade karte waqt madadgar ho sakti hain:


              Double Bottom Pattern:
              1. Formation:
                • Double bottom pattern do lows (troughs) se milta hai jo aapas mein barabar hote hain, aur inhe ek peak ya higher low (neckline) se separate karta hai.
                • Price pehle ek support level tak gir kar waha se phir upar jata hai, fir dobara wahi support level touch karta hai aur phir se upar jaata hai.
              2. Characteristics:
                • Pehla bottom initial selling pressure ko darust karta hai, jo ek bounce ke roop mein dikhai deta hai.
                • Peak ya higher low temporary resistance level ko represent karta hai.
                • Dusra bottom support level ka dobara test karta hai.
              3. Volume:
                • Pattern ko confirm karne ke liye volume ka bhi dhyan rakhna important hai. Generally, pehle decline mein volume zyada hota hai, corrective phase mein kam hota hai, aur fir breakout ke waqt fir se zyada ho jata hai.
              Double Bottom Par Trade Karne Ki Strategies:
              1. Confirmation:
                • Pattern ko confirm karne ke liye neckline ke upar saaf breakout ka wait karein.
                • Confirmation ke liye zyada volume ka hona bhi important hai.
              2. Entry Point:
                • Breakout ke baad trade mein shamil ho jayein.
                • Kuch traders breakout ke baad ek pullback ka wait karte hain, fir entry karte hain.
              3. Stop-Loss:
                • Stop-loss order ko double bottom ke lowest point ke neeche lagayein.
                • Yeh level ek safety net ka kaam karta hai taki agar pattern fail ho, toh trade exit ho sake.
              4. Target:
                • Price target ko generally double bottom ke bottom se neckline tak ka distance measure kar ke calculate kiya jata hai, aur phir wahi distance breakout point se upar project kiya jata hai.
              5. Timeframe:
                • Chart ka timeframe bhi consider karein. Longer timeframes zyada significant trend reversals la sakte hain.
              6. Risk Management:
                • Apne capital ko bachane ke liye sahi risk management strategies ka istemal karein.
                • Zyada risk na lein, jo aap afford kar sakte hain wahi risk lein.
              7. Confirmation Other Indicators Se:
                • Signals ko confirm karne ke liye moving averages, RSI, ya MACD jaise aur technical indicators ka istemal karein.
              8. Sabr:
                • Pattern ka pura hone aur confirm hone ka wait karein aur tab hi trade mein shamil ho.

              Yaad rahe ki koi bhi trading strategy foolproof nahi hoti, aur technical analysis ke saath dusre analysis aur risk management ka bhi dhyan rakha jana chahiye. Market conditions badal sakti hain, isliye flexible rahna bhi zaroori hai.
               

              اب آن لائن

              Working...
              X