Double Bottom Pattern:
No announcement yet.
X
  • وقت
  • دکھائیں
Clear All
new posts
  • #1 Collapse

    Double Bottom Pattern:
    DEFINITION OF DOUBLE BOTTOM PATTERN:


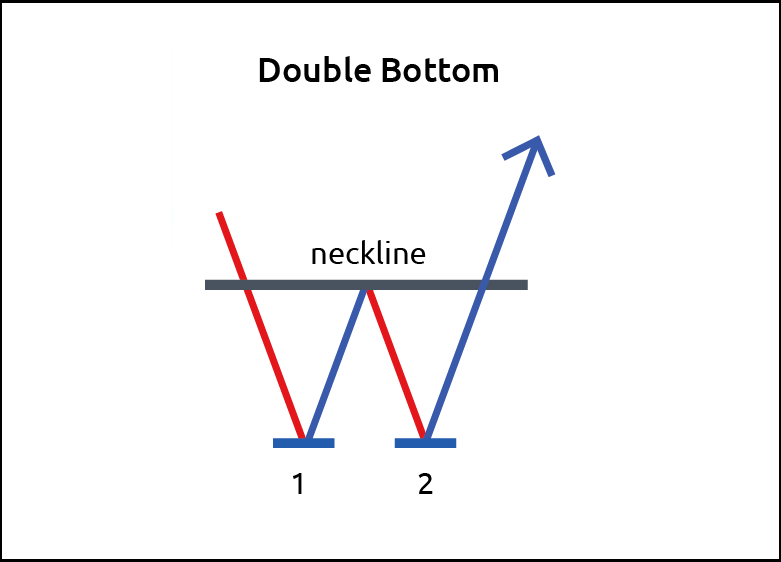
    Double bottom pattern ek technical analysis charting pattern hai jise security ke price movement mein potaale ki suraksha ki keemat ke pehchaan karne ke liye aam taur par istemaal kiya jata hai. Ye pattern tab paida hota hai jab ek suraksha keemat ke potaale mein security ke price girata hai. Ye pattern "W" ki shakal mein hota hai, jahan price pehle kam hoti hai, phir ek bottom par pahunchti hai, upar uthati hai, phir girati hai aur doosri bottom banati hai, aur phir ek mahatvapoorna upar ki harkat hoti hai.

    Is pattern ke tashkeel ko samajhne ke liye, bazaar mein shamil hone wale vyaktiyon ke manobhavna ka tafsili tajurba karna mahatvapurna hai. Pehla bottom us waqat ki selling pressure aur beargish sentiment ko darshaata hai jo bazaar mein mojood hai. Jab price is kam keemat tak pahunchti hai, khareedne ke iraade wale ise kam keemat samajhne lagte hain, jiski wajah se khareedari mein izafa hota hai. Is khareedari ki dabao wajah se price pehle bottom se upar uthati hai.

    Halaanki, ye pehla rally aksar kam samay tak hoti hai aur koora shuru ho jaata hai, jiski wajah se doosra giravat hoti hai aur doosra bottom banata hai. Is waqt bazaar ki bhavishyavaani bearish hai aur bechne wale bazaar par dominent hote hain. Phir se, khareedne wale is suvidha ke level par bazaar mein dakhil hote hain, jiski wajah se price aur bhi unchai tak badhti hai.


    VOLUME ANALYSISIN DOUBLE BOTTOM PATTERN :


    Volume analysis double bottom pattern ko tajurbe karne mein mahatvapurna hai. Is pattern ki tashkeel ke dauran ek aham pehlu to volume hai. Ideal taur par, volume pehli kam ke dauran zyada hona chahiye, jo mazboot selling pressure ki tasdeek karta hai. Jab price upar uthati hai, to volume kam hona chahiye, jo bechna wale dilchaspi ki kami ka afsurda karta hai.

    Doosre bottom ki tashkeel ke dauran, volume phir se badhna shuru karna chahiye, jisse naayi bechni ki dabao ki nakaami ki nishani hoti hai. Lekin jab price doosre bottom se upar uthne lagti hai, to volume ka bahav dekhna zaroori hai, jise majboot khareedne ki dilchaspi ki nishani ke taur par samjha jata hai. Doosre bottom se breakout ke dauran zyada volume, pattern ka tasleem karne aur ek sambhav trend ulatne ki janakari dena zaroori hai.


    NECKLINE IN DOUBLE BOTTOM PATTERN :


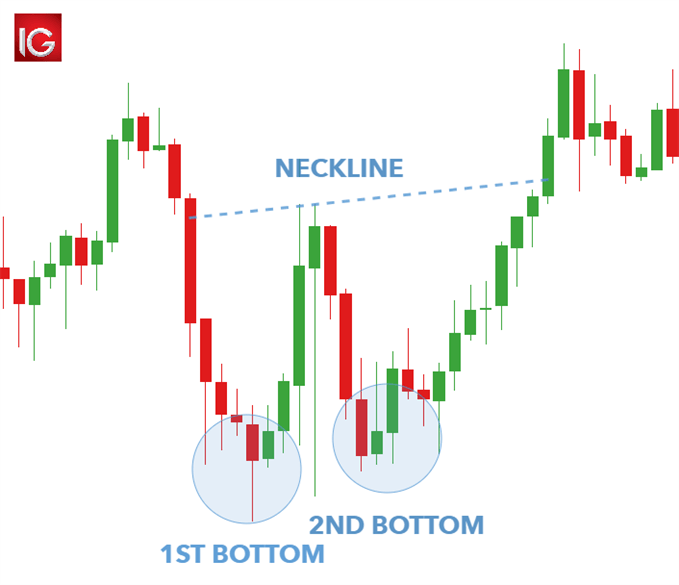
    Neckline double bottom pattern mein ek eham ahemiat rakhta hai. Ye ek resistance level ki tarah kaam karta hai jise price ko todna hota hai pattern ko tasleem karane ke liye. Neckline pehle aur doosre bottoms ke baad bana hota hai. Neechey aur neckline ke beech ki fasle bhi tawazun mein rakhne ki eham baat hai.

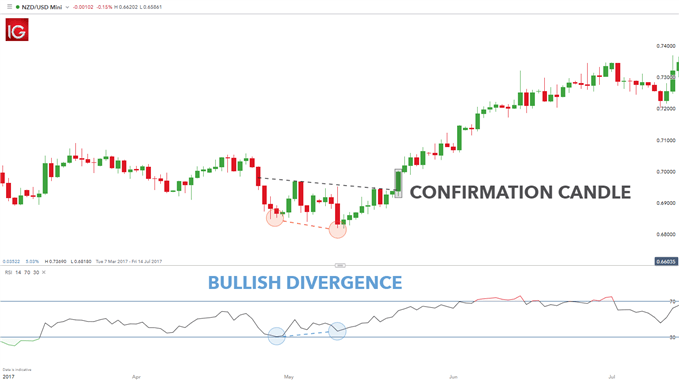
    Ek kam iqtidal wali neckline, taqatwar pattern ko dikhata hai kyunki yeh ishara karta hai ke price ne kam mushkilat ke saath upar jana hai. Aksar barri neckline kamzor pattern ko batati hai, kyunki yeh ishara karta hai ke price ko upar jaane mein zyada takleef hai. Traders neckline ke upar breakout ko tasdeeq ke liye dekhte hain, jiska tasdeeq volume ki barhti hui tadad bhi karta hai.


    TARGET PROJECTION IN DOUBLE BOTTOM PATTERN :


    Jab price neckline ke upar breakout karta hai, traders aksar potential upar ki harekate ke liye target ka andaaza lagate hain. Aam taur par ek method target ka tayyar karne ke liye pehle bottom se neckline tak ki fasl ko measure karna hai. Phir is fasl ko breakout point par jodkar potential target ka andaaza lagaya ja sakta hai.

    Yeh note karna zaroori hai ke target projection ek tajweezah hai aur muqarrar natija nahi hai. Is liye zaroori hai ke dusre technical indicators aur market conditions ko bhi samjh liya jaye target ki kamyabi ke asle maiyar ke taur par. Traders aksar overall market sentiment aur potential resistance levels ko bhi dekh kar apne target projections adjust karte hain jo agay ki upar ki harekate mein rok sakta hai.


    FAILURE AND INVALIDATION IN DOUBLR BOTTOM PATTERN :


    Double bottom pattern potential trend reversals ke baray mein ahem maloomat faraham karne ki salahiyat rakhta hai, lekin woh halat jahan pattern fail ho jaye ya anisar ho jaye, se waqif rehna bhi zaroori hai. Ek aam fail hone ki soorat mein price neckline ke upar na paar ho kar false breakout paida kar sakta hai.

    Doosra scenario ye hai ke price neckline ke upar paar karke upar ki momentum ko sustad nahi kar sakta, jis ki wajah se fori tawalud ki bajaye wapas neeche ki taraf ulat jata hai. Aisi halat mein pattern ke nakami ka matlab hai ke bearish sentiment abhi bhi market par havi hai, isliye traders ko ahtiyat ke sath bullish positions lena chahiye.

    False signals ya pattern ke nakami ke risk ko kam karne ke liye mashoor hai ke double bottom pattern ko dusre technical indicators aur tajziati tools ke saath istemal kiya jaye. Yeh market ki poora jaiza farahamy karne mein madadgar ho sakta hai aur pattern ki isharon ko tasdeeq karna mein madad karta hai.
  • <a href="https://www.instaforex.org/ru/?x=ruforum">InstaForex</a>
  • #2 Collapse

    Double Bottom Pattern
    Double Bottom pattern ek popular technical analysis tool hai jo potential trend reversals ko identify karne ke liye use hota hai. Yeh pattern typically bearish trend ke baad bullish reversal ka signal hota hai aur forex trading mein kaafi effective mana jata hai. Double Bottom pattern ko samajhna aur effectively use karna trading skills ko enhance karne mein madadgar ho sakta hai.


    Double Bottom Pattern ke Basics


    Double Bottom pattern ek reversal pattern hai jo do distinct troughs ko show karta hai jo almost equal levels par hote hain. Yeh pattern market ke downward trend ke baad form hota hai aur bullish reversal ka signal deta hai. Double Bottom pattern typically W shape ka hota hai aur price ke lower levels par support dikhata hai.


    Double Bottom Pattern ke Structure
    1. First Bottom: Pehla bottom ek significant price drop ke baad form hota hai. Yeh price level support ke taur par act karta hai.
    2. Peak: First bottom ke baad price recover hoti hai aur ek temporary high (peak) form karti hai. Yeh peak resistance level ko represent karta hai.
    3. Second Bottom: Second bottom first bottom ke almost equal level par form hota hai. Yeh bottom support level ko confirm karta hai.
    4. Breakout: Second bottom ke baad price wapas upar move hoti hai aur peak level ko break karti hai. Yeh breakout bullish reversal ka confirmation hota hai.
    Double Bottom Pattern ko Identify Karne ke Steps
    1. Initial Downtrend: Sabse pehle initial downtrend ko identify karna hota hai jo first bottom form hone tak continue hota hai. Yeh downtrend significant aur impulsive hona chahiye.
    2. First Bottom: First bottom ko identify karna hota hai jo price ke lower level par support dikhata hai. Yeh bottom typically ek sharp decline ke baad form hota hai.
    3. Peak: First bottom ke baad price recover hoti hai aur ek temporary peak form karti hai. Yeh peak resistance level ko show karta hai.
    4. Second Bottom: Second bottom ko identify karna hota hai jo first bottom ke almost equal level par form hota hai. Yeh bottom support level ko confirm karta hai.
    5. Breakout: Second bottom ke baad price peak level ko break karti hai jo bullish reversal ka confirmation hota hai. Yeh breakout strong volume ke saath hona chahiye.
    Double Bottom Pattern ko Trade Karne ki Strategies


    Double Bottom pattern ko trade karne ke liye kai strategies hain jo traders apni trading style aur market conditions ke mutabiq adopt kar sakte hain.

    1. Entry Point:


    Entry point typically breakout point par hota hai jab price peak level ko break karti hai. Jab price breakout hota hai aur confirmation milta hai ke yeh bullish reversal hai, toh trader entry position le sakta hai.


    2. Stop Loss:


    Stop loss typically second bottom ke thoda niche set kiya jata hai. Yeh is liye kiya jata hai kyun ke agar price second bottom se niche jaye toh pattern fail hone ka risk hota hai.


    3. Take Profit:


    Take profit levels typically multiple points par set kiye jate hain. Pehla target typically peak level ke equal distance par hota hai jo breakout point se measure kiya jata hai.


    Advantages of Double Bottom Pattern


    1. High Accuracy:


    Double Bottom pattern ki high accuracy hoti hai kyun ke yeh specific price levels par based hota hai jo market ke natural price movements ko represent karte hain.

    2. Clear Entry and Exit Points:


    Double Bottom pattern clear entry aur exit points provide karta hai jo traders ko trading decisions lene mein madadgar hote hain.

    3. Risk Management:


    Double Bottom pattern risk management ke liye effective hai kyun ke yeh predefined stop loss aur take profit levels provide karta hai.

    Disadvantages

    1. False Signals:


    Double Bottom pattern mein false signals ka risk hota hai jo traders ko losses face karne par majboor kar sakte hain.

    2. Complexity:


    Double Bottom pattern ko accurately identify karna mushkil ho sakta hai aur beginners ke liye yeh pattern samajhna aur use karna challenging ho sakta hai.


    Double Bottom pattern ek popular aur effective technical analysis tool hai jo traders ko market ke potential trend reversals ko identify karne mein madad karta hai. Yeh pattern typically bearish trend ke baad bullish reversal ka signal hota hai aur high accuracy provide karta hai. Double Bottom pattern ko effectively trade karne ke liye traders ko market ke price movements aur support-resistance levels ko closely monitor karna hota hai.

    Double Bottom pattern ka main advantage high accuracy, clear entry aur exit points, aur effective risk management hai, lekin iske false signals aur complexity ke risks ko bhi madde nazar rakhna zaroori hai. Overall, Double Bottom pattern ko samajhna aur effectively use karna successful forex trading ke liye zaroori hai aur yeh traders ko market ke movements ko better understand karne mein madadgar hota hai. Traders ko apni trading strategies ko adapt karte hue Double Bottom pattern ko incorporate karna chahiye aur market ke key levels aur price action ko closely monitor karna chahiye.
    • #3 Collapse

      what is a double bottom pattern?

      forex market mein double bottom aik kesam ka chart pattern hota hey jes mein 2 type kay low points hotay hein es kesam kay chart pattern mein horizontal trend line hote hey hey jo keh bullish trend reversal ko bhe identify kar sakte hey forex market ke price 2 low points kay sath bhe indicate ho jate hey or forrex maket mein support ke price low hote hey
      double bottom pattern forex market mein down trend kay end mein he ban sakta hey yeh forex market mein W kay lafz say he melta julta hota hey yeh lower level par wapes anay kay bad forex market kay trend mein tabdel ho jata hey forex market mein kame kay trend mein wapes anay kay bad new lows level par wapes aa jate hey or price es area say bullish ko ochalte hey nechay ke resistance level kay point par wapes aa jate hey or important price level par gap ko bhe identify kar sakte hey

      es tarah forex market mein double bottom pattern hota hey jo keh bearish reversal ka he eshara ho sakta hey forex market kay resistance level kay gap ko bhe wazah kar deya jata hey double top points 2 high poinnts kay darmean mein he kove kar sakta hey or yeh forex market mein support level he ban jata hey double top pattern aik tools hey je ko trading ke bare market mein etamal keya jata hey sath he forex market mein bhe estamal keya ja sakta hey

      Double Bottom pattern ke pehchan

      sab say pehlay aik jaicce do dahlwan ko talash karna chihay jes ke 2 alag alag lower hone chihay
      bottom kay darmean mein distance bohut he kam hona chihay yeh forex maket kay time frame par he depnd karta hey
      nick line or resistance ke price level ke confirmation hone chihay
      double bottom bullish signal ko support karnay kay ley technical indicator ka estamal karen jaisa keh moving average , oscillator
      strong trend against trading say avoid karna chihay

      NZD/USD Double Bottom Chart Pattern

      oper wala chart hakay nellay rang kay nechay kay trend kay sath he banta hey jo keh forex maket mei technical oscillator kay sath mel kar banta hey trader ko bullish trend reversal ko identify karta hey or forex market kay nechay kay trend ko reversal janay ko he identify kar sakta hey 1:2 risk o reward ratio ko he identify kar sakta hey or market kay limit ko frahm karta hy
      Last edited by ; 01-07-2024, 02:48 PM.
      bhali kay badlay bhali
      • <a href="https://www.instaforex.org/ru/?x=ruforum">InstaForex</a>
      • #4 Collapse

        Double Bottom Pattern: Forex Trade Mein Istemal

        Forex market mein trading karte waqt, technical analysis ek ahem hissa hai jisse traders patterns aur signals ke zariye price movements ko samajhte hain. Ek aam aur mufeed pattern jo traders istemal karte hain, woh hai "Double Bottom".

        1. Double Bottom Pattern Ki Tashkeel

        Double Bottom pattern ek popular reversal pattern hai jo price action analysis mein istemal hota hai. Is pattern mein price pehle neeche jata hai, phir do baar ek se zyada neeche aakar wapis upar uthta hai. Yeh pattern generally downtrend ke baad dekha jata hai aur bullish reversal ka signal deta hai.

        Double bottom pattern ki tashkeel mein do significant bottoms hote hain jo ek doosre ke neeche hote hain, lekin kareebi levels par. Pehli bottom ke baad price mein thora sa izafa hota hai, lekin overall trend abhi bhi neeche ki taraf rehta hai. Dusri bottom jab price phir se neeche jati hai lekin pehli bottom se kam ya kafi kareeb se wapis aati hai, aur iske baad price mein phir se izafa hota hai.

        2. Pehli Bottom

        Pehli bottom ek downtrend ke baad dekha jata hai jab price ek support level ya previous low ko touch karta hai. Yeh ek initial indication hai ke price neeche jaa sakta hai lekin pattern ki tashkeel ke liye ek bottom hi sufficient nahi hota.

        Pehli bottom ke waqt volume ki tafseel bhi important hoti hai. Agar volume pehli bottom ke samay normal ya kam hoti hai, toh yeh ek signal ho sakta hai ke price ko neeche jana mushkil ho sakta hai aur reversal ke chances barh sakte hain.

        3. Pehli Recovery

        Pehli bottom ke baad, price mein thora sa izafa hota hai lekin overall trend abhi bhi neeche ki taraf rehta hai. Yeh izafa normal market fluctuations ka hissa ho sakta hai aur isko ek trend reversal signal ke roop mein nahi dekha jana chahiye.

        4. Dusri Bottom

        Dusri bottom pehli bottom se neeche hoti hai lekin pehli bottom se kafi kareeb ya iske sath sath hoti hai. Yeh bottom bhi support level ya previous low ke paas aati hai, lekin phir se wapis upar jati hai.

        Dusri bottom ka volume pehli bottom se kam hona chahiye, jo ek indicator ho sakta hai ke selling pressure kam ho rahi hai aur buyers ke interest mein izafa ho sakta hai.

        5. Dusri Recovery

        Dusri bottom ke baad price mein phir se izafa hota hai aur support level ko dubara touch karta hai. Yeh recovery pehli recovery se zyada strong hoti hai aur volume bhi normal se zyada ho sakta hai, jo ek bullish signal hai.

        Dusri recovery ke waqt, traders ko volume ki tafseel bhi dekhni chahiye. Agar dusri recovery ke samay volume pehli recovery se zyada hai, toh yeh ek aur confirmation ho sakta hai ke bullish reversal strong ho sakta hai.

        6. Neckline Breakout

        Double bottom pattern ke ek critical aspect hai neckline ka breakout. Neckline ek imaginary line hoti hai jo pehli aur dusri bottoms ke peaks ko connect karti hai. Jab price dusri recovery ke baad neckline ko break karke upar jata hai, toh yeh ek bullish signal deta hai.

        Neckline breakout ke waqt, volume ka bhi izafa hona chahiye jo breakout ko confirm karta hai. Agar breakout volume ke saath hota hai, toh yeh ek strong signal hai ke bullish trend shuru ho sakta hai.

        7. Volume Ka Tawazun

        Double bottom pattern mein volume ka bhi tawazun zaroori hai. Breakout ke waqt volume ka izafa hone se pattern ki validity barh jati hai. Volume ki kami breakout ko kamzor kar sakti hai aur false breakout ka khatra bhi ho sakta hai.

        Volume ke analysis mein traders ko breakout ke din se pehle se taiyar rehna chahiye. Agar volume breakout ke din normal ya kam hai, toh yeh ek warning sign ho sakta hai ke breakout genuine nahi ho sakta.

        8. Confirmation Ke Liye Wait

        Traders ko breakout ke baad bhi confirmation ke liye wait karna chahiye. Agar price neckline ko break karta hai lekin phir se wapis neeche jata hai, toh yeh ek false breakout ho sakta hai.

        Confirmation ke liye, traders price ko ek din ya kuch din tak monitor karte hain. Agar price breakout ke din se upar rehta hai aur volume bhi sahi hai, toh yeh ek confirmation hai ke bullish trend shuru ho sakta hai.

        9. Entry Point Tashkeel

        Entry point double bottom pattern ke breakout ke baad banaya jata hai jab price neckline ko successfully break karta hai. Entry point ka tashkeel price ke breakout ke upper ek limit aur stop loss ke niche ek limit se kiya jata hai.

        Entry point tashkeel ke waqt, traders ko risk aur reward ratio bhi calculate karna chahiye. Agar stop loss entry point se zyada door hai, toh risk zyada ho sakta hai aur trade ko avoid karna behtar ho sakta hai.

        10. Stop Loss Aur Risk Management

        Har trade mein stop loss aur risk management zaroori hai, taake nuqsan se bacha ja sake. Stop loss ek critical part hai trading ka jo traders ke liye safety net ka kaam karta hai.

        Stop loss ka tashkeel price ke breakout ke niche kiya jata hai. Agar breakout ke baad price wapis neeche jata hai, toh stop loss trade ko close karne mein madad karta hai aur nuqsan se bachata hai.

        Risk management ke liye, traders ko har trade mein sirf ek fixed percentage ya amount ko risk karne chahiye. Agar trade risk tolerance se zyada ho, toh usko avoid karna chahiye.

        11. Target Price Tashkeel

        Target price ko calculate karte waqt double bottom pattern ke depth ka istemal hota hai. Target price ka tashkeel breakout ke upper peak aur neckline ke distance se kiya jata hai.

        Target price tashkeel ke liye, traders ko pattern ke depth ko samajhna zaroori hai. Agar pattern ke depth zyada hai, toh target price bhi zyada ho sakta hai aur traders ko potential profit mil sakta hai.

        12. Pattern Ki Taaqat

        Double bottom pattern ki taaqat uski depth aur volume ke upar depend karti hai. Agar pattern ki depth zyada hai aur volume breakout ke waqt sahi hai, toh pattern ki taaqat bhi zyada ho sakti hai aur bullish trend strong ho sakta hai.

        Pattern ki taaqat ke analysis mein, traders ko volume ke saath pattern ki depth bhi dekhni chahiye. Agar pattern ke depth kam hai aur volume bhi normal hai, toh pattern ki taaqat kam ho sakti hai aur reversal weak ho sakta hai.

        13. Time Frame Ka Intikhab

        Pattern ko samajhne ke liye sahi time frame ka intikhab zaroori hai. Har time frame mein pattern differently appear ho sakta hai aur traders ko sahi signal milna zaroori hai.

        Time frame ka intikhab karne ke liye, traders apne trading strategy aur goal ko samajhte hain. Agar long term trend dekhna hai, toh daily ya weekly time frame select kiya ja sakta hai. Agar short term entry lena hai, toh hourly ya 15-minute time frame choose kiya ja sakta hai.

        14. False Breakouts Ka Ehtemam

        Traders ko false breakouts se bachne ke liye cautious rehna chahiye. False breakout ek common phenomenon hai jo traders ko nuqsan mein daal sakta hai.

        False breakout se bachne ke liye, traders ko volume aur price action ko closely monitor karna chahiye. Agar breakout ke baad volume normal hai aur price wapis neeche jata hai, toh yeh ek false breakout ka sign ho sakta hai.

        15. Psychological Levels Ka Asar

        Psychological levels, jaise ki round figures, double bottom pattern mein bhi important ho sakte hain. Round figures, jaise ki $1.00, $1.50, etc., price action mein resistance ya support level ka kaam karte hain.

        Psychological levels ke asar ke tashkeel mein, traders ko round figures ko identify karna chahiye. Agar round figure ek double bottom pattern ke breakout ke paas hai, toh yeh ek strong resistance ya support level ho sakta hai.

        16. Market Sentiment Ke Tashkeel

        Market sentiment ko samajh kar double bottom pattern ki validity confirm ki ja sakti hai. Agar market bullish sentiment mein hai, toh double bottom pattern ka breakout zyada strong ho sakta hai.

        Market sentiment ke analysis mein, traders economic news aur market indicators ko dekhte hain. Agar economic news positive hai aur market mein optimism hai, toh double bottom pattern ki tashkeel bhi strong ho sakta hai.

        17. Divergence Ke Mutabiq Tafseel

        Divergence ko bhi double bottom pattern ke sath dekha jata hai, jo bullish signals ko reinforce karta hai. Divergence ek technical analysis tool hai jo price action aur oscillator indicators ke beech ke difference ko indicate karta hai.

        Divergence ke mutabiq tafseel ke liye, traders price action aur oscillator indicators ko closely monitor karte hain. Agar price bottom lower low banata hai aur oscillator higher low, toh yeh ek bullish divergence ho sakta hai aur double bottom pattern ko confirm karta hai.

        18. Pattern Ke Aksar Aham Hissa

        Double bottom pattern forex trading mein aksar aham role ada karta hai, khas kar long term trades ke liye. Is pattern ko samajhna aur effectively istemal karna, forex trading mein successful hone ke liye zaroori hai.

        Pattern ke aksar aham hissa ke tashkeel mein, traders ko market conditions aur trend ko analyze karna chahiye. Agar market mein bullish sentiment hai aur double bottom pattern strong hai, toh trading opportunities mil sakte hain.

        19. Conclusion

        Double bottom pattern ek powerful tool hai jo traders ko price reversals aur entry points mein madad deta hai. Isko samajhna aur effectively istemal karna, forex trading mein successful hone ke liye zaroori hai.

        Is article mein double bottom pattern ke mukhtasar tafseelat aur uski tashkeel ki mukammal tafseel pesh ki gayi hai. Traders ko double bottom pattern ke depth, volume, confirmation, aur risk management ko samajhna zaroori hai. Jab sahi tashkeel aur analysis kiya jata hai, toh double bottom pattern ek powerful tool ho sakta hai jo traders ko consistent profits deta hai.

        اب آن لائن

        Working...
        X