INTRODUCTION TO THE MEETING LINE PATTERN:
Meeting Line Pattern forex trading mein aik aam istemaal honay wala technical analysis tool hai. Is pattern mein do candlesticks shamil hoti hain jin ki rang bilkulbarabar hoti hai. Dusri candlestick pehli candlestick ki body ke beech mein band hoti hai. Ye aik tulna pattern hai jo keemat ke trend mein maqsad ki taraf aik mumkin rukh badalnay ka ishara deta hai. Meeting Line pattern aksar lambay badalte hue trend ki aakhir mein paya jata hai, jo trend ki badalne ki mumkin wazahat karta hai.
IDENTIFYING THE MEETING LINE PATTERN:
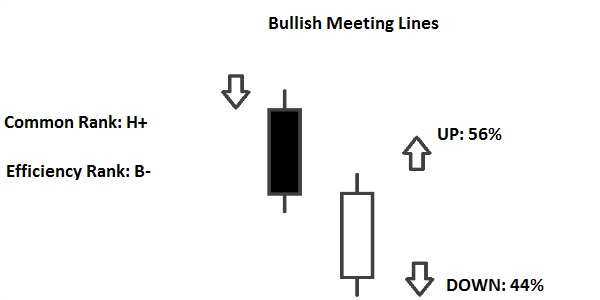
Meeting Line pattern ke pehchan ke liye, traders ko aik dosray ke baad aik candlesticks ko dekhna hota hai jo khas shartein puri karti hain. Pehli candlestick ki body lambi honi chahiye, jo keemat ke trend mein taqatwar harkat ko darshati hai. Dusri candlestick ki body choti honi chahiye aur pehli candlestick ki body ke beech mein band honi chahiye. Candlesticks ki rang bhi ahem hai, pehli candlestick bullish honi chahiye aur dusri candlestick bearish honi chahiye, ya phir ulta. Iske sath hi, is pattern ki tasdeek karne ke liye pehli candlestick ki pehle si harkat aur volume ko bhi ghor karna zaroori hai.
INTERPRETATION OF THE MEETING LINE PATTERN:
Meeting Line Pattern khareedne wale aur bechne wale ke darmiyan takkar ka numayan hai. Pehli candlestick mein kisi aik rukh ki taqatwar harkat ko darshaya jata hai jo keemat ke current trend ki zyadaat ka tasawwur deti hai. Lekin dusri candlestick pehli candlestick ki body ke beech mein band hone se harkat ki khatam hone aur market ki zehniyat mein badalao ki mumkinat ki nishandahi karti hai. Ye pattern kehta hai ke bulls aur bears aik barabar halat mein hain, jo keemat ke trend mein taqriban badalao ki mumkinat ka ishara karti hai. Traders is pattern ko aik badalne ki tayyari aur apni trading strategies ko mutabiq adjust karne ka signal samajhte hain.
CONFIRMATION AND TRADE SETUP:
Meeting Line Pattern ke zahoor honay se aik potential badalne ki tashkhees hai, lekin pattern ki tasdeek ke liye dusre technical indicators aur tools ke sath tasdeek zaroori hai. Traders is pattern ko trendlines, support aur resistance levels, aur dusre candlestick patterns ke sath mila kar trend ki badalne ki taqat tashkeel karne ke liye istemal karte hain. Iske sath hi, Relative Strength Index (RSI) ya Moving Average Convergence Divergence (MACD) jaise oscillators istemal kar ke pattern ki tasdeek aur potential trade setup ki aur tasdeek hasil ki ja sakti hai. Meeting Line Pattern pe trade karne se pehle tasdeek signals ka intezar karna zaroori hai ta ke jhootay signals ko kam se kam kiya ja sake aur kamiyabi ke imkanat ziyada houn.
STRATEGIES AND RISK MANAGEMENT:
Traders Meeting Line Pattern ka istemal karte hue kuch strategies istemal kar sakte hain apni trading decisions mein. Kuch traders pattern ki tasdeek honay par position lena chahte hain, jahan tak ke stop-loss order halkay ya kam hone walay hilaye ya low ke peeche lagaya jata hai. Dusre traders mazeed tasdeek signals ka intezar karte hain, jaise trendline ya support/resistance level ka break. Saaf dakhil aur kharij points tayyab karna, munasib risk-reward ratios tashkeel karna, aur mazboot risk management practices ko implement karna zaroori hai kapital ko bachane ke liye. Traders ko iske ilawa samay ki frame bhi dyaan mein rakhna chahiye.
Meeting Line Pattern forex trading mein aik aam istemaal honay wala technical analysis tool hai. Is pattern mein do candlesticks shamil hoti hain jin ki rang bilkulbarabar hoti hai. Dusri candlestick pehli candlestick ki body ke beech mein band hoti hai. Ye aik tulna pattern hai jo keemat ke trend mein maqsad ki taraf aik mumkin rukh badalnay ka ishara deta hai. Meeting Line pattern aksar lambay badalte hue trend ki aakhir mein paya jata hai, jo trend ki badalne ki mumkin wazahat karta hai.
IDENTIFYING THE MEETING LINE PATTERN:
Meeting Line pattern ke pehchan ke liye, traders ko aik dosray ke baad aik candlesticks ko dekhna hota hai jo khas shartein puri karti hain. Pehli candlestick ki body lambi honi chahiye, jo keemat ke trend mein taqatwar harkat ko darshati hai. Dusri candlestick ki body choti honi chahiye aur pehli candlestick ki body ke beech mein band honi chahiye. Candlesticks ki rang bhi ahem hai, pehli candlestick bullish honi chahiye aur dusri candlestick bearish honi chahiye, ya phir ulta. Iske sath hi, is pattern ki tasdeek karne ke liye pehli candlestick ki pehle si harkat aur volume ko bhi ghor karna zaroori hai.
INTERPRETATION OF THE MEETING LINE PATTERN:
Meeting Line Pattern khareedne wale aur bechne wale ke darmiyan takkar ka numayan hai. Pehli candlestick mein kisi aik rukh ki taqatwar harkat ko darshaya jata hai jo keemat ke current trend ki zyadaat ka tasawwur deti hai. Lekin dusri candlestick pehli candlestick ki body ke beech mein band hone se harkat ki khatam hone aur market ki zehniyat mein badalao ki mumkinat ki nishandahi karti hai. Ye pattern kehta hai ke bulls aur bears aik barabar halat mein hain, jo keemat ke trend mein taqriban badalao ki mumkinat ka ishara karti hai. Traders is pattern ko aik badalne ki tayyari aur apni trading strategies ko mutabiq adjust karne ka signal samajhte hain.
CONFIRMATION AND TRADE SETUP:
Meeting Line Pattern ke zahoor honay se aik potential badalne ki tashkhees hai, lekin pattern ki tasdeek ke liye dusre technical indicators aur tools ke sath tasdeek zaroori hai. Traders is pattern ko trendlines, support aur resistance levels, aur dusre candlestick patterns ke sath mila kar trend ki badalne ki taqat tashkeel karne ke liye istemal karte hain. Iske sath hi, Relative Strength Index (RSI) ya Moving Average Convergence Divergence (MACD) jaise oscillators istemal kar ke pattern ki tasdeek aur potential trade setup ki aur tasdeek hasil ki ja sakti hai. Meeting Line Pattern pe trade karne se pehle tasdeek signals ka intezar karna zaroori hai ta ke jhootay signals ko kam se kam kiya ja sake aur kamiyabi ke imkanat ziyada houn.
STRATEGIES AND RISK MANAGEMENT:
Traders Meeting Line Pattern ka istemal karte hue kuch strategies istemal kar sakte hain apni trading decisions mein. Kuch traders pattern ki tasdeek honay par position lena chahte hain, jahan tak ke stop-loss order halkay ya kam hone walay hilaye ya low ke peeche lagaya jata hai. Dusre traders mazeed tasdeek signals ka intezar karte hain, jaise trendline ya support/resistance level ka break. Saaf dakhil aur kharij points tayyab karna, munasib risk-reward ratios tashkeel karna, aur mazboot risk management practices ko implement karna zaroori hai kapital ko bachane ke liye. Traders ko iske ilawa samay ki frame bhi dyaan mein rakhna chahiye.

تبصرہ
Расширенный режим Обычный режим