Double Bottom Pattern:
No announcement yet.
X
  • وقت
  • دکھائیں
Clear All
new posts
  • #1 Collapse

    Double Bottom Pattern:
    DEFINITION AND CHARACTERISTICS OF DOUBLE BOTTOM PATTERN:


    Double bottom pattern forex trading mein sab se zyada istemal hone wale chart patterns mein se ek hai. Jab kisi currency pair ki qeemat ek bottom tak pahunchti hai, phir oopar uthkar wapas wahi ya us se milta julta support level tak girne ke baad doosra bottom banata hai. Is pattern ki tashkeel ka matlab hai ki downtrend mein reversal ki sambhavna hai aur uptrend ki taraf parivartan ho sakta hai.

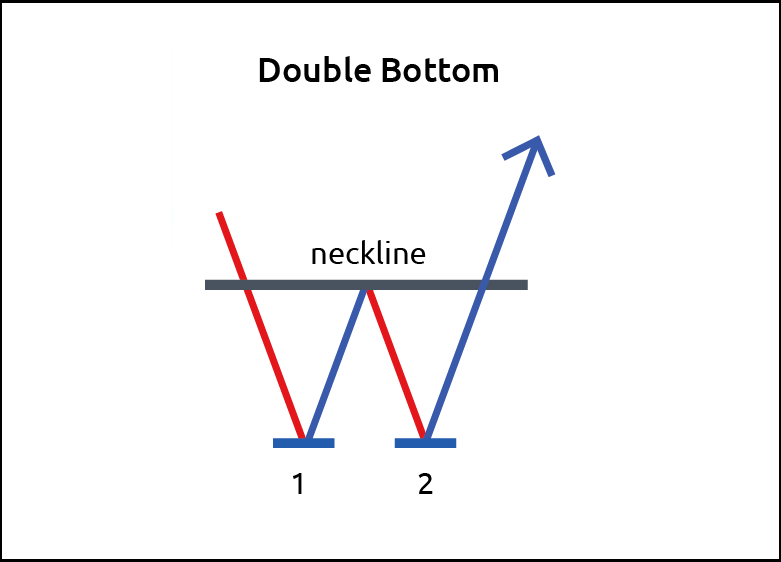
    Double bottom pattern ki mukhya khasiyat hai ki isme do barabar neeche ke price levels, yaani bottoms, ek nishchit samay seema ke andar hote hain. Ye price levels ek doosre ke kareeb hote hain, iska matlab hai ki kharidne wale log price ko support karne ke liye ek hi level par aa rahe hain. Ye bottoms ek peak ya neckline se jude hote hain, ye ek resistance level ka kaam karta hai aur pattern ko confirm karne ke liye break hona zaruri hai.


    IDENTIFYING A DOUBLE BOTTOM PATTERN:


    Forex chart par double bottom pattern ko pehchanne ke liye, traders ko dhyaan se dekhna hoga ki do bottoms clear tarike se bane hain, jo similar ya equal neeche ke level par hote hain. In bottoms ke baad neckline ya peak se jude hote hain. Bottoms ke baad neckline se break-up hone par pattern ki tasdeek hoti hai.

    Traders double bottom pattern ko pehchane ke liye alag-alag technical analysis tools ka istemal kar sakte hain, jaise ki trend lines, support and resistance levels, ya moving averages. Ye tools pattern ke sahi hone ki tasdeek karte hain aur potential trades ke liye aur support aur resistance levels pradan karte hain.


    CONFIRMATION AND TRADE ENTRY:


    Double bottom pattern ki pehchan ho jane ke baad, traders trade entry se pehle tasdeek ke liye rukte hain. Is tasdeek ka pata is baat se chalta hai ki price neckline se oopar break karke significant volume ke saath aur majboot bullish momentum ke saath aage badhti hai.

    Trade entry ke liye, traders neckline ke thoda upar ek buy order rakhte hain ya fir neckline tak pullback ka intezaar karte hain. Stop-loss level second bottom ke neeche rakha ja sakta hai, jisse ki potential false breakouts ke liye cushion ho. Profit target bottom aur neckline ke beech ki doori ka maap karke ussi doori ko neckline se upar projection karke set kiya ja sakta hai.


    POTENTIAL PITFALLS AND FALSE SIGNALS:


    Double bottom pattern ek vishwasniya reversal pattern ho sakti hai, lekin traders ko sambhavnaatam jhatke aur galat signals ki quandt mein rehna zaroori hai. Ek aam jhatka galati double bottom pattern ko triple bottom pattern ke roop mein samajhna hai, jisme price teen-bottoms instead of do bottom banata hai.

    Traders ko false breakouts par bhi satark rehna chahiye, jahan price briefly neckline se oopar break karti hai, lekin upar ka momentum sambhal nahi paata. Agar trades initial breakout par dalkar ki jaati hai, toh ye false breakouts loss ka karan ho sakte hain.


    ENHANCING THE PERFORMANCE OF THE DOUBLE BOTTOM PATTERN:


    Double bottom pattern ki performance ko badhane ke liye, traders aur technical indicators ya tools ka istemal kar sakte hain. Jaise ki, traders bullish reversal candlestick patterns jaise engulfing ya piercing patterns ko dhundh sakte hain, jo aur tasdeek pradaan karte hain. Wo oscillators, jaise relative strength index (RSI) bhi istemal kar sakte hain, overbought ya oversold conditions aur potential entry points ko pehchane ke liye.

    Is ke alawa, traders double bottom pattern trade karne se pehle overall trend ko bhi ghor kar sakte hain. Double bottom pattern jo ek uptrend ke andar hota hai, generally considered more reliable hai kyunki isse larger trend ke saath align hota hai aur ek potential reversal ki strong tasdeeq provide kar sakta hai.


    Conclusion:


    Double bottom pattern forex trading mein ek widely followed chart pattern hai. Traders is pattern ko do bottoms ke formation se pehchan sakte hain, jinme similar lows hote hain aur jo neckline se jude hote hain. Ye pattern ek potential reversal ko downtrend mein dikhata hai aur ek shift ko uptrend ki taraf. Traders ko tasdeeq ka intezar karna chahiye, jaise neckline ke breakout ke saath volume aur bullish momentum ke saath, trade mein dakhil hone se pehle. Lekin, traders ko false signals se savdhan rehna chahiye aur pattern ki performance ko behtar banane ke liye aur technical indicators ya tools ka istemal karne ka sochna chahiye.
  • <a href="https://www.instaforex.org/ru/?x=ruforum">InstaForex</a>
  • #2 Collapse

    Double bottom pattern:

    Click image for larger version

Name:	doubl.png
Views:	27
Size:	26.1 کلوبائٹ
ID:	12785446


    Double Bottom pattern ek technical analysis chart pattern hai, jo market mein trend reversal ko darust karti hai. Yeh pattern typically downtrend ke baad aata hai aur bullish reversal ko suggest karta hai. Double Bottom ek visual indicator hai jo traders ko market ke potential trend change ke baare mein signal deta hai.


    Double Bottom pattern kuch key features include karta hai:
    1. Downtrend ke baad aata hai: Double Bottom pattern typically ek downtrend ke baad aata hai. Yeh dikhaata hai ke selling pressure kamzor ho rahi hai aur buyers control mein aa rahe hain.
    2. Do lows hote hain: Is pattern mein do distinct lows hote hain, jo ek doosre ke kareeb hote hain aur almost equal hote hain. Pehla low downtrend ke dauran aata hai aur doosra low usse neeche nahi jaata, balki ek horizontal line ke qareeb rehta hai.
    3. Transition phase: Double Bottom ek transition phase ko darust karta hai, jisme market ke dynamics mein change hone ka indication hota hai. Downtrend ke baad yeh pattern bullish trend ki shuruaat ko signify kar sakta hai.
    4. Volume ka istemal: Volume analysis bhi Double Bottom pattern mein important hota hai. Normally, jab price second low tak girta hai, toh volume kam hota hai, indicating reduced selling pressure. Jab price reversal hota hai aur uptrend shuru hota hai, toh volume tezi se badh jaata hai, suggesting increased buying interest.

    Double Bottom pattern dekhne ke baad traders commonly ek entry point establish karte hain, jo generally second low ke upar hota hai. Price ka breakout neeche se upar hota hai aur traders is breakout ke baad potential uptrend ko catch karne ka try karte hain.

    Yeh important hai ke kisi bhi trading decision se pehle doosre technical indicators aur market conditions ka bhi moolyaankan kiya jaaye. Chart patterns, including Double Bottom, hamesha 100% guarantee nahi dete aur market risks hamesha hote hain.
    • #3 Collapse

      Double bottom pattern:


      Click image for larger version

Name:	duubbl.png
Views:	26
Size:	42.9 کلوبائٹ
ID:	12785450

      "Double bottom" ek technical analysis pattern hai jo market charts mein dekha ja sakta hai. Ye bullish reversal pattern hota hai, yaani ke jab ye pattern ban jaata hai toh market mein bearish trend se bullish trend mein badalne ki tawakkul hoti hai.


      Yahan double bottom pattern ke kuch key features hain:
      1. Do Neeche Ke Points (Troughs):
        • Double bottom pattern mein do neeche ke points ya troughs hote hain, jo ke aapas mein qareeb hotay hain. Yeh darust karte hain ke market mein do dafa price gir chuki hai.
      2. Middle Peak (Peak Darmiyan):
        • Dono troughs ke darmiyan aik peak hoti hai, jise "intermediate peak" kehte hain. Ye peak typically neeche ke points ke darmiyan average price level ko represent karta hai.
      3. Trend Reversal:
        • Double bottom pattern ek trend reversal pattern hai. Jab ye pattern complete ho jata hai aur price ne dobara se upper move karna shuru karta hai, toh ye indicate karta hai ke market mein trend badalne wala hai aur bullish trend shuru hone wala hai.
      4. Volume Ka Tafsili Mutala'a:
        • Trading volume ka bhi tafsili mutala'a kiya jata hai jab double bottom pattern dekha jata hai. Ideal scenario mein, jab price dobara se upper move karta hai, toh trading volume bhi barhna shuru hota hai.
      5. Neckline:
        • Double bottom pattern ka aik significant element "neckline" hota hai, jo ke troughs ke peaks ko jor kar connect karta hai. Jab price neckline ko break karta hai aur upper move karta hai, toh ye bullish confirmation hoti hai.

      Double bottom pattern ka sahi tarah se tafsili mutala'a aur confirmation ke liye, traders ko dobara se upper move ke mukhtalif signals aur confirmations ka bhi intezar karna chahiye. Har trading decision se pehle, market conditions aur dusre technical indicators ka bhi mawazna karna bohat zaroori hai.
      • #4 Collapse

        Double Bottom Pattern
        Double Bottom Pattern ek bullish reversal pattern hai jo financial markets mein chart analysis ke dauran nazar aata hai. Yeh pattern typically ek downtrend ke baad form hota hai aur market ke reversal ka indication deta hai. Double Bottom Pattern traders aur investors ke liye significant hota hai kyunki yeh potential buying opportunities ko highlight karta hai.


        Double Bottom Pattern Ki Definition


        Double Bottom Pattern ek bullish reversal pattern hai jo do distinct lows ke through form hota hai jo almost same level par hote hain. Yeh pattern ek W shape ka hota hai aur market ke downtrend ke baad price ke rebound hone ko indicate karta hai. Double Bottom Pattern typically ek support level par form hota hai aur market ke trend reversal ka signal deta hai.


        Double Bottom Pattern Ki Formation


        Double Bottom Pattern tab form hota hai jab market mein ek downtrend chal raha hota hai aur price do separate occasions par support level tak girti hai. Dono lows almost same level par hote hain, jo ek strong support level ko indicate karta hai. Formation ka process kuch iss tarah hota hai:
        1. First Bottom: Price pehla low form karti hai aur phir slightly rebound karti hai. Yeh pehla bottom typically ek significant support level par form hota hai.
        2. Second Bottom: Price phir se girti hai aur pehle low ke aas-paas phir se support level par ek aur low form karti hai. Yeh second bottom bhi almost same level par hota hai jahan pehla bottom form hua tha.
        3. Neckline: Dono bottoms ke beech ka highest point neckline kehlata hai. Neckline ek resistance level banata hai jise price ko breakout karna hota hai taake pattern confirm ho sake.
        4. Breakout: Jab price neckline ko breakout karti hai aur usse upar close hoti hai, tab Double Bottom Pattern confirm hota hai. Yeh breakout market ke trend reversal aur bullish momentum ka indication deta hai.
        Double Bottom Pattern Ki Characteristics


        Double Bottom Pattern ki kuch unique characteristics hain jo isse identify karne mein madadgar hoti hain:
        1. W Shape: Yeh pattern typically "W" shape ka hota hai, jisme do distinct lows aur ek intermediate high hota hai.
        2. Equal Lows: Dono bottoms almost same level par hote hain, jo ek strong support level ko indicate karta hai.
        3. Neckline: Neckline dono bottoms ke beech ka highest point hota hai aur resistance level banata hai.
        4. Volume Confirmation: Double Bottom Pattern ke formation ke dauran volume typically first bottom se second bottom tak decrease hoti hai aur phir breakout ke waqt significantly increase hoti hai.
        Importance of Double Bottom Pattern


        Double Bottom Pattern traders aur investors ke liye significant hota hai kyunki yeh market ke trend reversal aur potential buying opportunities ko indicate karta hai. Is pattern ki importance kuch specific scenarios mein hoti hai:
        1. Trend Reversal Signal: Double Bottom Pattern ek strong trend reversal signal hota hai jo market ke downtrend se bullish trend mein shift hone ka indication deta hai.
        2. Support Level Indication: Yeh pattern ek strong support level ko indicate karta hai jahan price ne do baar bounce kiya hota hai. Yeh support level future price movements ke liye important ho sakta hai.
        3. Potential Buying Opportunity: Double Bottom Pattern market ke bullish momentum ko indicate karta hai, jo traders aur investors ke liye potential buying opportunity ban sakta hai.
        Advantages

        Double Bottom Pattern ke kuch significant advantages hain jo isse traders aur investors ke liye valuable banate hain:
        1. Clear Reversal Signal: Yeh pattern market ke trend reversal ka clear signal deta hai, jo traders ko profitable trading opportunities identify karne mein madad karta hai.
        2. Strong Support Level: Double Bottom Pattern ek strong support level ko indicate karta hai jo future price movements ke liye important ho sakta hai.
        3. Volume Confirmation: Is pattern ke formation ke dauran volume confirmation bhi hoti hai, jo pattern ke reliability ko increase karti hai.
        4. Easy to Identify: Double Bottom Pattern easily identifiable hota hai aur visual analysis ke through traders ko market ke trend reversal ko recognize karne mein madad karta hai.
        Disadvantages


        Double Bottom Pattern ke kuch disadvantages bhi hain jo traders aur investors ko consider karne chahiye:
        1. False Breakouts: Kabhi kabar market false breakouts show karti hai jahan price temporarily neckline ko breakout karti hai lekin phir wapas girti hai. Yeh false breakouts traders ke liye losses ka sabab ban sakte hain.
        2. Time-Consuming: Double Bottom Pattern ka formation time-consuming ho sakta hai aur traders ko patiently wait karna padta hai jab tak pattern completely form aur confirm na ho jaye.
        3. Dependence on Confirmation: Yeh pattern apne aap mein sufficient nahi hota aur traders ko dusre technical indicators aur confirmation signals ke sath use karna chahiye.


        Double Bottom Pattern ek powerful aur effective bullish reversal pattern hai jo traders aur investors ko market ke trend reversal aur potential buying opportunities ko identify karne mein madad karta hai. Yeh pattern do distinct lows ke through form hota hai jo almost same level par hote hain aur ek W shape ka hota hai. Double Bottom Pattern typically ek support level par form hota hai aur neckline ko breakout karne par confirm hota hai. Is pattern ke multiple advantages hain, jaise clear reversal signal, strong support level, volume confirmation, aur easy identification. Lekin, iske kuch disadvantages bhi hain, jaise false breakouts, time-consuming formation, aur dependence on confirmation signals. Traders aur investors ko Double Bottom Pattern ko dusre technical indicators aur confirmation signals ke sath use karna chahiye taake accurate trading decisions le sakein aur market ke bullish trend se benefit utha sakein.
        • <a href="https://www.instaforex.org/ru/?x=ruforum">InstaForex</a>
        • #5 Collapse

          **Double Bottom Pattern:**
          Forex trading mein technical analysis ka use market ke trends aur potential reversals ko identify karne ke liye hota hai. Double Bottom Pattern ek popular bullish reversal pattern hai jo market ke downtrend ke baad develop hota hai aur price ke upward movement ka signal deta hai. Is pattern ko samajhkar, traders market ki direction ko accurately predict kar sakte hain aur profitable trades execute kar sakte hain.

          **Double Bottom Pattern** ek technical chart pattern hai jo market ke downtrend ke baad banta hai aur do consecutive lows ke saath hota hai. Ye pattern typically bullish reversal ke signals ko indicate karta hai aur market ke potential upward movement ko show karta hai. Is pattern ki key characteristics kuch is tarah hain:

          1. **Pattern Formation:**
          - **First Bottom:** Pattern ke formation ki shuruat ek strong downtrend se hoti hai. Pehla bottom ek significant low hota hai jahan se price thodi der ke liye rebound karti hai aur phir se niche move karti hai.
          - **Second Bottom:** Pehla bottom ke baad, price ek second low banati hai jo pehle low ke level ke around hota hai. Doosra bottom bhi ek significant low hota hai, lekin is baar price rebound karne ke baad upward movement show karti hai.
          - **Neckline:** Do bottoms ke beech mein ek neckline banti hai jo price ke previous highs ko connect karti hai. Jab price is neckline ko break karti hai, to ye bullish signal hota hai aur market ke upward trend ko confirm karta hai.

          2. **Pattern Interpretation:** Double Bottom Pattern market ke downtrend ke baad ek strong reversal signal hota hai. Jab ye pattern develop hota hai, to ye indicate karta hai ke selling pressure kam ho raha hai aur buying pressure badh raha hai. Is pattern ke completion ke baad, market generally upward trend ko follow karta hai.

          3. **Confirmation:** Pattern ki confirmation ke liye additional indicators aur analysis zaroori hoti hai. Volume analysis aur follow-up candlestick patterns pattern ke validity ko validate karte hain. High trading volume aur strong breakout pattern ki reliability ko enhance karte hain.

          4. **Trading Strategy:** Double Bottom Pattern ko trading strategy mein effectively include karte waqt, traders ko precise entry aur exit points define karne chahiye. Entry point neckline ke upar set kiya ja sakta hai, aur stop-loss level pehle bottom ke niche set kiya ja sakta hai.

          In summary, Double Bottom Pattern ko samajhkar aur iski signals ko accurately interpret karke, aap market trends aur potential reversals ko behtar identify kar sakte hain. Regular practice aur detailed analysis ke sath, aap is pattern ko apni trading strategy mein effectively incorporate kar sakte hain aur profitable trades kar sakte hain.

          اب آن لائن

          Working...
          X