What Is Falling Wedge Chart Pattern Analysis??
X
  • وقت
  • دکھائیں
Clear All
new posts
  • #1 Collapse

    What Is Falling Wedge Chart Pattern Analysis??


    Falling Wedge Chart Pattern Analysis: Taqatwar Tehqiqat Ka Zariya

    Falling Wedge chart pattern ek ahem technical analysis tool hai jo ke stock market aur financial markets mein istemal hota hai. Is pattern ka maqsad market trend ko samajhna aur traders ko future price movements ke baray mein agahi hasil karna hai. Falling Wedge, jise Urdu mein "Girte Huye Keel" bhi kehte hain, aksar bullish reversals ko pehchanne mein madad karta hai. Is article mein, hum Falling Wedge chart pattern ki taqat aur istemal ke bare mein guftagu karenge.Click image for larger version

Name:	grade7-falling-wedge-reversal-before.png
Views:	48
Size:	14.1 کلوبائٹ
ID:	12785091
    Falling Wedge Kya Hai?


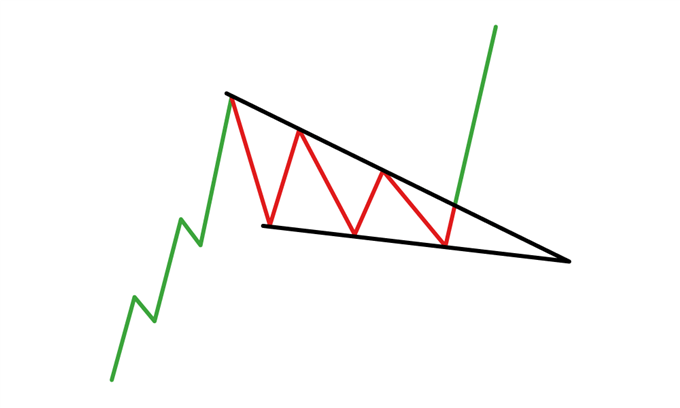
    Falling Wedge ek graphical formation hai jo market price ke movement ko darust karti hai. Yeh pattern jab market mein girawat (downtrend) mein hota hai aur phir prices ke darmiyan symmetric triangle ban jata hai. Ismein prices halki halki girawat karti hain, lekin is triangle ke andar ka area chhota hota hai. Falling Wedge ki pehchan mein, price ke neeche ki line ko support line aur upar ki line ko resistance line kaha jata hai.
    Falling Wedge Ki Tafseelat
    1. Symmetric Triangle Structure: Falling Wedge ka structure symmetric triangle jesa hota hai jismein dono sides barabar slope rakhte hain. Yeh slope down hone ke baad aksar price mein girawat ko indicate karta hai.
    2. Volume Ka Tafteesh: Falling Wedge ke breakout ke waqt, volume ka bhi dehan diya jata hai. Agar breakout ke samay volume tez ho toh yeh confirmation hoti hai ke trend change hone wala hai.
    3. Breakout Point: Falling Wedge ka asal faida tab hota hai jab yeh pattern breakout karta hai aur price upward direction mein move karta hai. Is breakout point ko dhyan se dekha jata hai.
    Trading StrategiesClick image for larger version

Name:	Capture.PNG
Views:	46
Size:	24.2 کلوبائٹ
ID:	12785092
    1. Buy Signal: Agar Falling Wedge ka breakout hota hai aur price upper trend mein chala jata hai, toh yeh ek buy signal hai. Traders ko yeh ishara deta hai ke ab market mein bullish trend shuru ho sakta hai.
    2. Stop-Loss Orders: Har trading strategy mein risk management ka tawajju diya jata hai. Falling Wedge ke breakout ke baad, traders apne positions ke liye stop-loss orders lagate hain taki nuksan se bacha ja sake.
    Conclusion


    Falling Wedge chart pattern ek powerful tool hai jo traders ko market ke future trends ke bare mein agahi dene mein madad karta hai. Is pattern ko samajhna aur sahi taur par istemal karna, traders ke liye ek zaroori hunar hai. Magar yaad rahe, har pattern ki tarah, Falling Wedge bhi 100% confirm nahin hota aur market mein hamesha risk hota hai. Is liye, apne trades ko smartly manage karna ahem hai.

    Is tarah se, Falling Wedge chart pattern analysis ek tehzeebi tajaweez hai jise traders istemal karke apne trading decisions ko behtar bana sakte hain.

  • <a href="https://www.instaforex.org/ru/?x=ruforum">InstaForex</a>
  • #2 Collapse


    Falling Wedge Chart Pattern Analysis (Roman Urdu Article)

    Falling Wedge chart pattern ek technical analysis ka tareeqa hai jo market trends aur price movements ko samajhne mein madadgar sabit ho sakta hai. Yeh pattern ek bullish reversal signal deta hai, yaani ke jab market mein down trend ho raha ho aur yeh pattern nazar aaye toh yeh ishara ho sakta hai ke market mein trend badalne wala hai.Click image for larger version

Name:	image1.png
Views:	48
Size:	41.1 کلوبائٹ
ID:	12785097

    Falling Wedge Kya Hai?

    Falling Wedge pattern ek aisa chart pattern hai jisme price ek descending channel mein girti hai. Is pattern ki pehchaan karne ke liye, traders ko price ke lows aur highs ko connect karna hota hai, jo ek wedge shape banata hai. Agar price apne previous lows se neeche girti hai, lekin uski girti hui trajectory dheere dheere kam hoti hai, toh yeh ek falling wedge create karta hai.

    Falling Wedge Ka Tijarat Mein Istemaal

    Falling Wedge ka pehla asar yeh hota hai ke yeh market mein buyers aur sellers ke darmiyan uncertainty ko darust karta hai. Jab yeh pattern nazar aata hai, toh iska matlab hai ke sellers ka control kamzor ho raha hai aur buyers apna control barha rahe hain.

    Ek bar falling wedge pattern confirm hojaye, traders ko bullish trend ki tayyari karni chahiye. Ismein entry point ko define karna zaroori hota hai. Entry point ko tab define karna chahiye jab price falling wedge ke upper trend line ko break kare aur ek bullish candlestick pattern banaye.

    Falling Wedge Aur Volume Ka Ta'alluq
    Click image for larger version

Name:	Capture.PNG
Views:	44
Size:	164.0 کلوبائٹ
ID:	12785098
    Falling Wedge ke breakout ko confirm karne ke liye volume ka bhi khaas khayal rakha jata hai. Agar falling wedge ke breakout ke waqt volume tezi se barh raha hai, toh yeh breakout aur bhi powerful ho sakta hai.

    Falling Wedge Ka Faida Uthaana

    Falling Wedge ka analysis kar ke traders ko market ke future direction ka andaza lagane mein madad milti hai. Is pattern ko samajhne ke liye, traders ko chart patterns, technical indicators aur price action ka sahi istemal karna zaroori hai.

    Muqamiyat Ke Liye Ahem Naseehat

    Har chart pattern ki tarah, Falling Wedge bhi 100% sahi nahi hota. Market mein hamesha khatra rehta hai aur kisi bhi waqt trend badal sakta hai. Is liye, har trade ko soch samajh kar aur apne risk management rules ke mutabiq karna chahiye.

    Falling Wedge chart pattern analysis ek powerful tool ho sakta hai agar isay sahi tarah se istemal kiya jaye. Ismein entry aur exit points ko sahi se tay karna zaroori hai. Traders ko hamesha market ki taqat aur kamzoriyon ko samajhne ki koshish karni chahiye taki unka tijarat mein behtar faisla ho sake.

    • #3 Collapse


      Falling Wedge Chart Pattern Analysis: Ek Taqatwar Technical Tool

      Technical analysis market mein apne investment aur trading decisions ko samajhne ke liye ek ahem zariya hai. Ismein mukhtalif chart patterns ka istemal hota hai jo ke traders ko market trends aur price movements ke bare mein malumat farahem karte hain. Ek aham aur asan samajhne wala chart pattern Falling Wedge hai. Is pattern ki analysis se traders market mein hone wale possible reversals ko pehchan sakte hain.

      Falling Wedge ek bullish reversal pattern hai, jo ke market mein down trend ke baad aane wale possible uptrend ko darust karti hai. Is pattern ko dekh kar traders apne trading strategies ko adjust kar sakte hain.Click image for larger version

Name:	Falling-Wedge-04.png
Views:	43
Size:	24.7 کلوبائٹ
ID:	12785102

      Falling Wedge Chart Pattern Kya Hai?

      Falling Wedge ek technical analysis ka chart pattern hai jo ke market mein hone wale trend reversals ko darust karta hai. Is pattern mein price ek descending trend line ke darmiyan slow and steady taur par ghat rahi hoti hai. Iske alawa, ek support line bhi hoti hai jo ke price ke lower highs ko represent karti hai.

      Falling Wedge chart pattern ka ek khaas feature ye hai ke ye gradually chhota hota hai, iska matlab hai ke price mein decrease kam hota hai aur market mein buying interest barqarar rehti hai. Is pattern ki ek aur khaas baat ye hai ke iske formation ke doran volume bhi kam hota hai, jo ke reversal ke liye ek positive indicator hai.

      Falling Wedge Chart Pattern Kaise Identify Karein?

      Falling Wedge chart pattern ko identify karne ke liye traders ko price ke movement ko closely observe karna hota hai. Is pattern ki pehchan ke liye neeche diye gaye steps ko follow karein:
      1. Descending Trend Line:
        • Falling Wedge ka pehla aur sabse ahem hissa hai descending trend line. Price ko connect karne wale points ko join karke descending trend line banaiye. Ye line price ke lower highs ko represent karegi.
      2. Support Line:
        • Support line ko bhi draw karein jise ke price ke lower lows ko represent kiya jata hai. Ye line bhi dheere dheere niche ki taraf jaati hai.Click image for larger version

Name:	Falling-wedge-pattern.jpeg
Views:	44
Size:	70.5 کلوبائٹ
ID:	12785103
      3. Gradual Contraction:
        • Falling Wedge ka dhyan rakhne wala hissa ye hai ke pattern dheere dheere chhota hota hai. Price mein gradual contraction hone ke sath hi volume bhi decrease hota hai.
      4. Breakout Confirmation:
        • Jab price descending trend line aur support line ke darmiyan se bahar nikalti hai, to ise ek bullish reversal signal samjha jata hai. Traders ko is breakout ke baad entry lena chahiye.

      Falling Wedge Ka Istemal Trading Mein:

      Falling Wedge chart pattern ka istemal trading strategies ko improve karne ke liye hota hai. Jab price breakout karta hai, to traders ko long positions lena chahiye. Stop-loss orders ko set karke, risk management ko bhi madde nazar rakhte hue, traders apne targets tak pahunch sakte hain.

      Falling Wedge ka istemal ek confirmation ke sath karna zaroori hai. Volume ke sath breakout hone par hi traders ko entry leni chahiye. Agar volume nahi hai, to ye breakout weak ho sakta hai.

      Conclusion:

      Falling Wedge chart pattern ek powerful tool hai jo traders ko market mein hone wale trend reversals ko identify karne mein madad karta hai. Is pattern ki sahi samajh aur istemal ke liye, traders ko market ke movements ko dhyan se observe karna chahiye. Falling Wedge ke breakout ke baad, traders ko apne trading strategies ko adjust karke market mein hone wale changes ka faida uthana chahiye.

      • #4 Collapse


        Falling Wedge Chart Pattern Analysis - Girte Hue Wedge Chart Ki Tafseelat

        Chart analysis, ek ahem hissa hai jise investors istemal karte hain taake woh market trends ko samajh sakein aur behtar faislay kar sakein. Ek aham chart pattern jo traders ke liye useful hai, woh hai "Falling Wedge." Is article mein, hum Falling Wedge chart pattern ki tafseelat aur iske istemal ke baare mein baat karenge.Click image for larger version

Name:	Capture.PNG
Views:	46
Size:	193.8 کلوبائٹ
ID:	12785108

        Falling Wedge Kya Hai?

        Falling Wedge ek technical analysis chart pattern hai jo market mein trend reversal ko darust karnay ka ek tareeqa hai. Is pattern mein price ek descending trend mein hoti hai, lekin ye dheere dheere kam hoti hai aur sath hi support aur resistance lines aapas mein milte hain, jaise ke ek chhota wedge.

        Falling Wedge Ka Tashreef:
        1. Wedge Ka Banaya Gaya Hona: Falling Wedge pattern mein price ke levels aapas mein ek wedge banate hain jisme support aur resistance lines parallel hoti hain. Ye wedge niche ki taraf girta hai aur iska formation bearish trend ki taraf ishara karta hai.
        2. Volume Ka Tafseelat: Falling Wedge ko analyze karte waqt, volume ka bhi khayal rakhna zaroori hai. Agar price girte hue wedge ke andar gir rahi hai aur volume kam hota hai, toh ye indicate karta hai ke selling pressure kamzor hai.
        3. Breakout Point: Jab price falling wedge ke andar se bahar nikalti hai, yani ke upper trendline ko paar karti hai, toh ise breakout kehte hain. Agar breakout upward hota hai, toh ye bullish reversal signal ho sakta hai.
        Click image for larger version

Name:	2a1a77df358345de8ced8d83618bab10.jpeg
Views:	39
Size:	50.2 کلوبائٹ
ID:	12785109
        Falling Wedge Ka Istemal:
        1. Trend Reversal Ka Pehchan: Falling Wedge pattern ka istemal karke traders trend reversal ko pehchan sakte hain. Agar price falling wedge ke breakout ke baad upar ja rahi hai, toh ye bullish reversal ko darust karta hai.
        2. Entry Aur Exit Points Ka Tafseelat: Falling Wedge ko istemal karke traders apne entry aur exit points ko behtar taur par decide kar sakte hain. Breakout ke baad, traders long positions le sakte hain.
        3. Stop Loss Aur Target Points Ka Tay Karna: Falling Wedge pattern ka istemal karke, traders stop loss aur target points ko tay kar sakte hain, jisse unka risk management behtar ho.

        Akhir Mein:

        Falling Wedge chart pattern ek powerful tool hai jo traders ko market trends ko samajhne aur predict karne mein madad karta hai. Iska istemal karke, traders apne trading strategies ko refine kar sakte hain aur behtar taur par market movements ko anticipate kar sakte hain. Lekin, hamesha yaad rahe ke chart patterns ke istemal mein risk management ka bhi khayal rakhna zaroori hai.

        • #5 Collapse


          Falling Wedge Chart Pattern Analysis: Tijarti Tijarat Mein Aham Rol

          Falling Wedge Chart Pattern ek aham tijarti tijarat ki taqat hai jo ke technical analysis mein istemal hoti hai. Yeh pattern market mein aane wale trend ke mawafiq signalat deti hai. Falling Wedge Chart Pattern ko samajhna tijarat karne walon ke liye zaroori hai takay woh sahi waqt par sahi faislay kar sakein. Is article mein, hum Falling Wedge Chart Pattern ki roman Urdu mein tafseel se tehqiq karenge.
          Click image for larger version

Name:	667dc89ba509488f8cd0bb3e1ec01dc9.jpeg
Views:	43
Size:	49.1 کلوبائٹ
ID:	12785113
          Falling Wedge Kya Hai?

          Falling Wedge ek aisa chart pattern hai jo ke ek downtrend ke doran banta hai. Is pattern mein price ek downward slope ke sath chalti hai lekin ek specific shape banati hai jo ke wedge ki tarah hoti hai. Falling Wedge mein price ke lows aur highs ke darmiyan mein chhota sa area hota hai jo ke dheere dheere ghata hota hai.

          Falling Wedge Chart Pattern Ki Pechan Kaise Hoti Hai?
          1. Downward Trend: Falling Wedge Chart Pattern ka pehla hissa ek downtrend hota hai jismein price neeche ki taraf ja rahi hoti hai.
          2. Constriction of Price Range: Iske baad, price range mein ek contraction hoti hai, matlab ke price ke highs aur lows ke darmiyan ka fasla kam hota hai.
          3. Wedge Shape: Falling Wedge Chart Pattern banne lagta hai jab lows ek slope par hote hain aur highs ek araam se kam hote hain. Is shape ko dekhte hue ise wedge kehte hain.

          Falling Wedge Ka Tijarti Matlab Kya Hai?

          Falling Wedge Chart Pattern ka tijarti matlab hota hai ke market mein reversal hone ke chances hote hain. Yeh pattern indicate karta hai ke downtrend ki intensity kam ho sakti hai aur uptrend shuru hone wala hai. Iska matlab hai ke bechne wale aur khareedne wale ke darmiyan kaam hote hue market mein bullish momentum aane wala hai.

          Falling Wedge Pattern Ka Istemal Kaise Hota Hai?
          1. Entry Point: Jab Falling Wedge Chart Pattern mukammal ho jata hai, traders ko entry point ka intezar hota hai. Entry point woh hota hai jab price wedge ke upper trend line ko break karta hai.
          2. Stop-Loss Aur Target: Traders apne positions ke liye stop-loss aur target levels set karte hain. Stop-loss, loss se bachne ke liye aur target, profit booking ke liye hota hai.
          3. Confirmation: Traders ko hamesha confirmations ke liye tayyar rehna chahiye. Yeh confirmations candlestick patterns, technical indicators, ya dosre tijarti tools ke istemal se mil sakti hain.Click image for larger version

Name:	Capture.PNG
Views:	36
Size:	126.2 کلوبائٹ
ID:	12785114

          Falling Wedge Chart Pattern Ka Istemal Karein, Magar Hoshiyar Rahein!

          Falling Wedge Chart Pattern analysis ek powerful tool hai tijarat karne ke liye, lekin iska istemal hoshiyari ke sath karna zaroori hai. Market mein hamesha risk hota hai aur isliye traders ko apne positions ko manage karte waqt savdhani baratni chahiye. Technical analysis ke sath-sath fundamental analysis aur risk management bhi mahatva purna hai.

          Aakhiri alfaz mein, Falling Wedge Chart Pattern ke istemal mein mahir hone ke liye amal aur tajaweez ki zarurat hoti hai. Tijarat karne walon ko hamesha naye patterns aur market conditions ke mutabiq apne tijarat ka daftar tajaweez karte rehna chahiye.

          • #6 Collapse


            Falling Wedge Chart Pattern: Tijarti Tanazur Mein Gehraai Ka Jashan

            1 Sall Baad ka Safar

            Aziz dosto, aaj hamare saath ek saal ka safar mukammal ho gaya hai, aur yeh hamara pehla salgirah hai. Humne ek saal mein aapke sawalon ka jawab diya, aapke masail mein madad ki, aur aapke saath tijarti aur maeeshati maloomat baantne ka ek naya tareeqa tajwez kiya.

            Is moqa par, hum ek tijarti maamlaat mein aam istemal hone wale ek chart pattern ke bare mein guftago karenge, jo "Falling Wedge" kehlaya jata hai. Yeh ek aham chart pattern hai jo tijarti analisis mein istemal hota hai.Click image for larger version

Name:	Capture.PNG
Views:	44
Size:	298.6 کلوبائٹ
ID:	12785120

            Falling Wedge: Kya Hai?

            Falling Wedge ek aisi chart formation hai jo tijarti analisis mein istemal hoti hai aur isay market mein bearish trend ke baad hone wale bullish reversal ka ishara samjha jata hai. Is pattern mein price range mein girawat hoti hai jo ek trapezium ya wedge ki shakal mein hoti hai.

            Falling Wedge Ki Khasoosiyat:
            1. Girawat aur Barhtay Hue Volumes: Falling Wedge mein price range mein girawat ke doran volumes mein bhi girawat hoti hai. Jab yeh pattern ban raha hota hai, to volume kam hota hai lekin jab price wedge ke andar gir rahi hoti hai, to volumes mein barhne lagti hai. Yeh ek bullish reversal ka ishara ho sakta hai.
            2. Saat Se Barah Dinon Ka Tareeqa: Is pattern mein price range ko plot karne mein aksar 7 se 12 dinon ka waqt lagta hai. Is doran, price ek defined channel ke andar gir rahi hoti hai.
            3. Support aur Resistance: Falling Wedge mein ek clear support line aur ek resistance line hoti hai. Support line neeche girne wale prices ko rokne mein madad karti hai jabke resistance line upper side ki movement ko control karti hai.

            Falling Wedge Ke Faide Aur Nuksan:

            Faide:
            • Is pattern ko samajhna asaan hai aur market ke reversals ko pehchanne mein madad karta hai.
            • Trading opportunities create hoti hain jab price range se bahar nikalti hai, aur traders ko achi munafa dene wale trades milte hain.
            Click image for larger version

Name:	images.png
Views:	38
Size:	6.5 کلوبائٹ
ID:	12785121
            Nuksan:
            • Har pattern ki tarah, Falling Wedge bhi 100% confirm nahi hota aur kabhi-kabhi false signals bhi de sakta hai.
            • Yeh zaroori hai ke doosre technical indicators aur confirmatory signals ko bhi madde nazar rakha jaye taki trading decisions sahi ho saken.

            Sawalat Aur Malumat:

            Agar aapko is article se mutalliq koi sawalat hain ya aur malumat chahiye, to aap hamse pooch sakte hain. Hamari koshish hogi ke aapko behtar tijarti samajh hasil ho.

            Is mukammal saal ke dauran, humne aapke saath tijarti, maeeshati, aur ilmi guftagu mein hissa banaya hai. Hamari ummid hai ke aapko hamara tajwez pasand aya hoga. Aane wale dino mein bhi hum aapke sawalon ka jawab dene mein barabar kaam karenge aur naye mawad lekar hazir honge.

            • #7 Collapse

              What is falling wedge chart pattern analysis??


              Click image for larger version

Name:	fallng.png
Views:	47
Size:	14.1 کلوبائٹ
ID:	12785124

              Falling wedge ek technical chart pattern hai jo khas tor par maali market mein, khaas kar stock charts mein aata hai. Isay do trendlines se mutasir kia jata hai, jo ke neeche ki taraf jhukti hui, ek wedge (kila) ki shakal banati hain.


              Yahan falling wedge pattern ki key khasoosiyat aur tafseelat hain:
              1. Trendlines (Trend Rekhaayein): Falling wedge do trendlines se bana hota hai - ek upper resistance line aur doosri lower support line. Upper trendline wo point karti hai jahan se highs (swing highs) milti hain, jabke lower trendline lows (swing lows) ko jodti hai.
              2. Jhukti Trendlines: Upper aur lower trendlines dono neeche ki taraf jhukti hain, jo dikhata hai ke waqt ke saath saath price range mein halki ghutti hai.
              3. Convergence (Milap): Ye dono trendlines aapas mein milte hain, ek wedge (kila) banate hue. Ye milap price movements ki kamzori ko dikhata hai.
              4. Volume (Hissa): Aam taur par, falling wedges kam hone wale trading volumes ke saath jate hain jab ye pattern banta hai. Volume mein kami hone ka matlab hai ke maujooda trend kamzor ho sakta hai.
              5. Breakout (Bahar Nikalna): Pattern aksar ek breakout ke saath ata hai, jisme price upper trendline se bahar nikal jati hai. Ye breakout bullish signal ke taur par liya jata hai aur ye dikhaata hai ke maujooda downtrend mein mukhalif palat ho sakta hai.
              6. Price Target (Nishan): Traders is pattern ke saath amuman back of the wedge (ya'ni ke dono trendlines ke darmiyan ki doori) ki qeemat ko nikaalkar usay upar ki taraf manzil ke tor par istemaal karte hain.

              Yaad rahe ke har falling wedge pattern ko mukhalif palat ka ishara nahi samjha jata, is liye zaroori hai ke trading faislay mein doosre factors ko bhi madde nazar rakha jaye, jese ke bunyadi tajaweez aur am market ke mahaul ko. Technical analysis ko trading aur investing mein istemaal karne ka behtareen tareeqa ek pur asar tajaweez ke taur par istemaal karna hai.
              • #8 Collapse


                Falling Wedge Chart Pattern Analysis: Ek Tehqiqati Nazar

                Falling Wedge chart pattern, ya girte hue khandar ki shakal ka ek chart pattern hai, jo ke technical analysis mein istemal hota hai taake investors ko future ke price movements ke baray mein malumat mil sake. Is article mein, hum Falling Wedge chart pattern ki tehqiqati nazar dalenge aur samajhenge ke yeh kis tarah kaam karta hai.
                Click image for larger version

Name:	falling_wedge_pattern52_720.jpg
Views:	37
Size:	52.5 کلوبائٹ
ID:	12785126
                Falling Wedge Kya Hai?

                Falling Wedge ek aesa chart pattern hai jo market mein downtrend ya girawat ko darust karnay ka asar dikhata hai. Is pattern mein, prices ek defined channel ke andar girti hain lekin yeh girti hui movement dheere dheere kam hoti hai, jaisay ke kisi chhati ke andar girte hue paani ki tarah.

                Is chart pattern ko pehchanne ke liye, traders ko market ke price chart par ek wedge ya khandar dhundhna hota hai jo ke neeche ki taraf gir raha ho aur prices uske andar gherte ja rahe hain.

                Falling Wedge Ka Tafsili Tajzia:
                1. Price Movement: Falling Wedge pattern mein, prices ek neeche ki taraf girte hain lekin yeh girawat dheere dheere kam hoti hai. Iska matlab hai ke sellers ka control dheere dheere khatam ho raha hai aur buyers ka dominance barh raha hai.
                2. Volume Analysis: Volume analysis bhi ahem hota hai jab Falling Wedge pattern ko samjha jata hai. Agar prices neeche gir rahe hain lekin volume kam ho raha hai, to yeh ishara hai ke sellers ki strength kamzor ho rahi hai.
                3. Breakout Point: Falling Wedge ka asal maza tab aata hai jab yeh pattern breakout karta hai. Agar prices wedge ke upper trendline se bahar nikalti hain, to yeh ek strong buy signal hai. Traders ko is breakout ke badle ko dekh kar apni trading strategy tajwez karna chahiye.
                4. Target Price: Falling Wedge ka target price calculate karne ke liye, traders ko wedge ke starting point se lekar breakout point tak ka distance nikalna hota hai. Phir yeh distance breakout point par add kiya jata hai, jisse ke target price milta hai.
                Click image for larger version

Name:	2--1--5.jpg
Views:	33
Size:	106.1 کلوبائٹ
ID:	12785127
                Falling Wedge Ka Istemal Trading Mein:

                Falling Wedge pattern ko samajh kar traders apni trading strategy ko optimize kar sakte hain. Yeh pattern market mein hone wale trend reversal ka asar darust karnay mein madad karta hai. Iske istemal se traders apni positions ko behtar taur par manage kar sakte hain aur potential profits ko maximize kar sakte hain.

                Akhiri Kehna:

                Falling Wedge chart pattern ek powerful tool hai jo traders ko market trends ko samajhne mein madad karta hai. Yeh pattern market ke dynamics ko samajhne mein madad karta hai aur investors ko sahi waqt par sahi faislay lene mein madad deta hai. Lekin yaad rahe ke har trading decision apne risk tolerance ke mutabiq liya jana chahiye aur market volatility ko madde nazar rakhte hue.

                Is saal ke mazeed trading aur investing tips ke liye, humare sath bane rahein aur market ki harkat mein izafa karte rahein.

                • #9 Collapse

                  Falling Wedge Chart Pattern Analysis

                  Financial markets mein trading aur investing ko asaan banane ke liye technical analysis tools aur chart patterns ka bohot zyada istemal hota hai. In tools aur patterns ka maqsad market ke trends, reversals, aur potential price movements ko identify karna hota hai. Aaj hum ek khas aur popular chart pattern ke bare mein baat karenge jo Falling Wedge Chart Pattern kehlata hai.


                  Falling Wedge Chart Pattern Kya Hai


                  Falling Wedge Chart Pattern ek bullish reversal pattern hai jo downward trend ke doran banta hai. Yeh pattern price action ko depict karta hai jo gradually narrow hota hai aur typically lower highs aur lower lows banata hai. Jab yeh pattern complete hota hai, to yeh market mein bullish reversal ko indicate karta hai, jo potential buying opportunity ko show karta hai.

                  Pattern Ki Construction


                  Falling Wedge Chart Pattern typically do converging trendlines par based hota hai jo downward direction mein slant karti hain. Yeh trendlines price action ko encapsulate karti hain aur pattern ko narrow banati hain. Pattern ki construction kuch is tarah hoti hai:
                  1. Upper Trendline: Yeh trendline sequential lower highs ko connect karti hai.
                  2. Lower Trendline: Yeh trendline sequential lower lows ko connect karti hai.

                  Yeh trendlines ek wedge shape create karti hain jo downward direction mein narrow hoti hain. Pattern ka duration vary kar sakta hai lekin typically yeh medium to long-term price action ko depict karta hai.

                  Pattern Ki Characteristics
                  1. Bullish Reversal Pattern: Falling Wedge typically bullish reversal pattern hota hai jo price action ke downward trend ke baad bullish reversal ko indicate karta hai.
                  2. Converging Trendlines: Is pattern mein do converging trendlines hoti hain jo price action ko encapsulate karti hain aur wedge shape banati hain.
                  3. Volume Decline: Pattern ke formation ke doran volume mein gradual decline dekha ja sakta hai jo consolidation phase ko indicate karta hai.
                  4. Breakout Confirmation: Pattern ka completion tab hota hai jab price upper trendline ko breakout kar deti hai aur volume increase hota hai, jo bullish reversal ko confirm karta hai.
                  Pattern Ka Importance


                  Falling Wedge Chart Pattern trading aur investing ke liye bohot important hai kyunke yeh market ke trends aur potential reversals ko accurately identify karta hai. Yeh pattern traders ko market ke trend reversal aur entry points ko identify karne mein madad karta hai aur profitable trading decisions lene mein help karta hai.

                  Pattern Ko Kaise Identify Karein


                  Falling Wedge Chart Pattern ko identify karna thoda challenging ho sakta hai kyunke inmein specific trendlines aur price action ko accurately measure karna hota hai. In steps ko follow karke aap Falling Wedge Chart Pattern ko identify kar sakte hain:
                  1. Price Movements Analysis: Charts pe price movements ko analyse karna hota hai aur potential Falling Wedge Chart Pattern ko identify karna hota hai.
                  2. Trendlines Drawing: Upper aur lower trendlines ko draw karna hota hai jo sequential lower highs aur lower lows ko connect karti hain.
                  3. Pattern Symmetry: Pattern ki symmetry ko check karna hota hai taake pattern ki reliability confirm ho sake.
                  4. Volume Analysis: Pattern ke formation ke doran volume decline ko check karna zaroori hota hai aur breakout ke doran volume increase ko confirm karna hota hai.
                  Trading Strategies


                  Falling Wedge Chart Pattern ko effectively trade karne ke liye aapko iski context aur doosre technical indicators ka use karna hota hai. Yeh kuch trading strategies hain jo Falling Wedge Chart Pattern ke sath use ki ja sakti hain:
                  1. Breakout Confirmation: Falling Wedge Chart Pattern ke completion ke baad breakout confirmation ka intezar karna zaroori hai. Jab price upper trendline ko breakout karti hai aur volume increase hota hai, to yeh bullish reversal ko indicate karta hai. Is point par buy signal generate hota hai.
                  2. Stop-Loss Placement: Pattern ko trade karne ke liye stop-loss orders lagana zaroori hota hai taake aapke losses limited hon. Typically, stop-loss ko lower trendline ke neeche place kiya jata hai.
                  3. Profit Targets: Profit targets ko set karna zaroori hai. Yeh targets typically pattern ke highest point se measure kiye jate hain.
                  4. Combining with Other Indicators: Falling Wedge Chart Pattern ko doosre technical indicators ke sath combine karna beneficial hota hai taake aapke signals zyada reliable hon. Misal ke taur par, aap moving averages, RSI, aur MACD ko use kar sakte hain.
                  Advantages of Falling Wedge Chart Pattern
                  1. Accurate Reversal Signals: Falling Wedge Chart Pattern market ke accurate reversal signals provide karta hai jo profitable trading opportunities offer karta hai.
                  2. Natural Price Movements: Yeh pattern natural price movements ko depict karta hai jo isse reliable banata hai.
                  3. Flexibility: Falling Wedge Chart Pattern kisi bhi market aur timeframe mein use kiya ja sakta hai.
                  4. High Reliability: Proper confirmation aur volume analysis ke sath yeh pattern high reliability offer karta hai.
                  Disadvantages
                  1. Complexity: Falling Wedge Chart Pattern complex hota hai aur beginners ke liye isse accurately identify karna challenging ho sakta hai.
                  2. Requires Advanced Tools: Is pattern ko accurately identify karne ke liye advanced charting tools aur software zaroori hote hain.
                  3. Market Conditions Dependence: Yeh pattern trending markets mein zyada effective hota hai aur choppy markets mein false signals de sakta hai.


                  Falling Wedge Chart Pattern ek powerful aur popular technical analysis tool hai jo market ke price movements aur potential reversals ko accurately depict karta hai. Yeh pattern traders ko market ke trends aur potential trading opportunities ko identify karne mein madadgar hota hai. Is pattern ko effectively trade karne ke liye aapko iski context aur doosre technical indicators ka use karna hota hai. Proper risk management aur disciplined approach ke sath aap Falling Wedge Chart Pattern se profitable trading decisions le sakte hain.

                  Trading mein success hasil karne ke liye aapko hamesha apne trading plan ko follow karte hue informed aur disciplined decisions lene chahiye taake aap consistently profitable rahen. Trading ki har strategy ki tarah, Falling Wedge Chart Pattern bhi apni unique challenges aur opportunities ke sath aata hai, aur isse samajh kar aur handle karne ke sath hi aap successful trader ban sakte hain.
                  • #10 Collapse

                    What Is Falling Wedge Chart Pattern Analysis??


                    Falling wedge chart pattern forex trading mein ek technical analysis tool hai jo market ke potential reversal aur continuation points ko identify karne ke liye design kiya gaya hai. Yeh pattern do converging trend lines se mil kar banta hai jo downward sloping hoti hain aur price movements ko narrow karte hue dikhati hain.
                    ### Falling Wedge Chart Pattern Ki Structure

                    Falling wedge pattern ki structure kuch is tarah hoti hai:

                    1. **Upper Trend Line**: Yeh line downward slope karti hai aur consecutive lower highs ko connect karti hai.
                    2. **Lower Trend Line**: Yeh line bhi downward slope karti hai aur consecutive lower lows ko connect karti hai.

                    ### Falling Wedge Chart Pattern Ka Matlab Aur Implications

                    Falling wedge pattern market ke potential reversal aur continuation points ko indicate karta hai:

                    1. **Bullish Reversal Pattern**: Falling wedge pattern aksar ek bullish reversal pattern hota hai, jo market ke downtrend ke baad upward movement ko indicate karta hai. Jab price pattern se breakout hoti hai, toh yeh strong buying signal hota hai.

                    2. **Continuation Pattern**: Kabhi kabhi yeh pattern existing uptrend ke continuation ko bhi indicate karta hai. Yeh tab hota hai jab market ek brief correction ya consolidation ke baad apni previous trend direction ko resume karta hai.

                    ### Falling Wedge Pattern Ko Trading Mein Use Karna

                    Falling wedge pattern ko effectively use karne ke liye kuch trading strategies follow karni chahiye:

                    1. **Pattern Identification**: Pehle pattern ko accurately identify karen. Ensure karen ke trend lines converging ho aur price movement narrowing ho.

                    2. **Volume Analysis**: Volume analysis bhi zaroori hai. Pattern ke completion ke waqt volume ka increase hona confirmation ka signal hota hai.

                    3. **Breakout Confirmation**: Breakout ke baad confirmation ka wait karen. Confirmation candle ke sath entry point set karen jab price upper trend line ke upar close kare.

                    4. **Entry Points**: Falling wedge pattern ke breakout point par entry karen. Yeh entry point strong hota hai kyunki market ke reversal ya continuation ka signal milta hai.

                    5. **Stop-Loss Placement**: Risk management ke liye stop-loss placement bohot important hai. Stop-loss ko lower trend line ke neeche set karen taake unexpected price movements se protect raha ja sake.

                    6. **Profit Targets**: Profit target set karna bhi zaroori hai. Previous resistance levels ko profit target ke taur par use karen ya pattern ki height ko measure karke target define karen.

                    ### Falling Wedge Pattern Ke Fayde

                    Falling wedge pattern ke kuch key fayde hain:

                    1. **Accurate Reversal Signals**: Yeh pattern market ke potential reversal points ko accurately predict karta hai jo trading decisions ko simplify karne mein madadgar hota hai.

                    2. **Risk Management**: Falling wedge pattern predefined stop-loss levels aur profit targets provide karta hai jo effective risk management mein madadgar hota hai.

                    3. **Market Sentiment Understanding**: Yeh pattern market sentiment aur potential price movements ko reflect karta hai jo trading ke perspective se valuable hota hai.

                    4. **Versatility**: Falling wedge pattern different timeframes aur instruments ke sath use kiya ja sakta hai, jo isse highly versatile banata hai.

                    ### Conclusion

                    Falling wedge chart pattern forex trading mein ek powerful technical analysis tool hai jo market ke potential reversal aur continuation points ko identify karne ke liye design kiya gaya hai. Is indicator ko effectively use karne ke liye pattern identification, volume analysis, confirmation, risk management, aur proper trading strategy ko adopt karna zaroori hai. Falling wedge pattern market sentiment aur potential future movements ko samajhne ke liye bohot madadgar hota hai. Practice aur market understanding ke sath, aap falling wedge pattern ko apni trading toolkit mein successfully incorporate kar sakte hain aur better trading results achieve kar sakte hain.​
                    ​​​​​​​
                    ​​​​​​​
                    • #11 Collapse


                      What is waves in Technical Analys

                      In technical analysis, "waves" typically refer to patterns in price movements that are used to predict future market behavior. The most common theory involving waves is Elliott Wave Theory. Here's a brief overview:
                      1. Elliott Wave Theory: Developed by Ralph Nelson Elliott in the 1930s, this theory suggests that financial market prices move in repetitive cycles or "waves" driven by collective investor psychology. According to Elliott, market movements follow a repetitive sequence of five upward waves followed by three downward waves. These waves are further classified as:
                        • Impulse Waves: The five-wave pattern that moves in the direction of the larger trend. It consists of three upward (1, 3, 5) and two downward (2, 4) waves.
                        • Corrective Waves: The three-wave pattern that moves against the direction of the larger trend. It consists of two downward (A, C) and one upward (B) waves in a bull market.
                      2. Wave Patterns: Elliott identified several wave patterns such as motive waves, corrective waves, zigzags, flats, triangles, and more. These patterns can appear at different degrees of trends, from very long-term to very short-term.
                      3. Fibonacci Relationships: Elliott Wave Theory often incorporates Fibonacci ratios to predict the length and time of waves, as these ratios are believed to reflect natural patterns found in nature and human behavior.

                      Using wave analysis, traders attempt to identify the current position within the wave pattern to make informed trading decisions, such as when to enter or exit a trade. This method is subjective and requires practice to apply effectively.


                      Sure, let's dive deeper into Elliott Wave Theory and its components:
                      1. Basic Structure of Elliott Waves


                      Elliott Wave Theory proposes that market prices unfold in repetitive cycles, which are categorized into two main types: impulse waves and corrective waves.
                      Impulse Waves (Motive Waves)


                      Impulse waves move in the direction of the larger trend and consist of five distinct sub-waves:
                      • Wave 1: The market starts to rise. This is often caused by a relatively small number of investors who suddenly feel the market is going to move up.
                      • Wave 2: The market corrects downward but does not erase all of Wave 1's gains. At this point, the broader market still believes it is in a downtrend.
                      • Wave 3: Often the longest and strongest wave. More investors become aware of the new uptrend and join in, pushing prices significantly higher.
                      • Wave 4: The market corrects again, usually less severe than Wave 2. This wave represents a temporary profit-taking phase.
                      • Wave 5: The final leg in the direction of the dominant trend. It is driven by the last burst of buying enthusiasm before a larger correction begins.
                      Corrective Waves


                      Corrective waves move against the direction of the larger trend and consist of three sub-waves:
                      • Wave A: The market moves against the prevailing trend. In a bull market, this would be a downward movement.
                      • Wave B: The market moves back in the direction of the previous trend but does not surpass the high of Wave 5.
                      • Wave C: The market continues to move against the previous trend and typically ends beyond the low of Wave A.
                      2. Degrees of Waves


                      Elliott identified that these waves can occur at various degrees of trends, ranging from long-term to very short-term. The degrees are categorized as:
                      • Grand Supercycle: Multi-century
                      • Supercycle: Multi-decade
                      • Cycle: One year to several years
                      • Primary: A few months to a couple of years
                      • Intermediate: Weeks to months
                      • Minor: Weeks
                      • Minute: Days
                      • Minuette: Hours
                      • Sub-Minuette: Minutes
                      3. Wave Patterns


                      Besides the basic 5-3 pattern, Elliott Wave Theory also identifies more complex corrective wave patterns:
                      • Zigzag (5-3-5): A sharp correction composed of a five-wave structure, a three-wave counter-trend, and another five-wave structure.
                      • Flat (3-3-5): A sideways correction with a three-wave structure for both the A and B waves, and a five-wave structure for the C wave.
                      • Triangle (3-3-3-3-3): A converging pattern where each wave subdivides into three smaller waves, typically appearing in the fourth wave position.
                      • Double and Triple Threes: Combinations of zigzags and flats forming complex correction patterns.
                      4. Fibonacci Relationships


                      Elliott Wave practitioners often use Fibonacci ratios to predict the length and time duration of waves. Common Fibonacci retracement levels (23.6%, 38.2%, 50%, 61.8%, 78.6%) and extension levels (100%, 161.8%, 200%, 261.8%) are used to forecast the end of corrections and the length of impulse waves. For instance:
                      • Wave 2 often retraces 50% to 61.8% of Wave 1.
                      • Wave 3 is typically 161.8% of Wave 1.
                      • Wave 4 usually retraces 38.2% of Wave 3.
                      • Wave 5 can be equal to Wave 1 or 61.8% of the length of waves 1 through 3 combined.
                      Application in Trading


                      Traders using Elliott Wave Theory aim to:
                      • Identify the beginning of a new wave cycle to enter trades in the direction of the trend.
                      • Predict the end of corrective waves to time entries in the direction of the trend.
                      • Use Fibonacci ratios to set price targets and stop-loss levels.

                      While powerful, Elliott Wave Theory requires practice and skill to apply effectively due to its subjective nature and the need for accurate wave counting. Traders often use it in conjunction with other technical analysis tools to increase reliability.


                      Hook Reversal pattern


                      The Hook Reversal pattern is a technical analysis pattern used to identify potential reversals in the market. It is typically seen at the end of a trend and can signal a change in direction. The pattern can occur in both bullish and bearish markets.
                      Characteristics of a Hook Reversal Pattern

                      Bullish Hook Reversal
                      1. Downtrend: The pattern occurs after a sustained downtrend.
                      2. Open: The stock opens lower than the previous day's close, continuing the downtrend.
                      3. Low: The stock makes a new low, indicating further weakness.
                      4. Close: The stock then rallies and closes above the previous day's close. This closing above the previous day's high suggests a reversal.
                      Bearish Hook Reversal
                      1. Uptrend: The pattern occurs after a sustained uptrend.
                      2. Open: The stock opens higher than the previous day's close, continuing the uptrend.
                      3. High: The stock makes a new high, indicating further strength.
                      4. Close: The stock then declines and closes below the previous day's close. This closing below the previous day's low suggests a reversal.
                      Interpretation and Significance
                      • Bullish Hook Reversal: Indicates that buyers have taken control after a period of selling pressure, potentially marking the start of a new uptrend.
                      • Bearish Hook Reversal: Indicates that sellers have taken control after a period of buying pressure, potentially marking the start of a new downtrend.
                      Trading the Hook Reversal Pattern
                      1. Confirmation: Traders often wait for confirmation of the pattern before taking a position. This can be a subsequent price move in the direction of the reversal.
                      2. Volume: Increased volume on the reversal day adds weight to the pattern, suggesting a stronger change in sentiment.
                      3. Stop-Loss: Setting a stop-loss is crucial. For bullish reversals, it can be placed just below the new low, and for bearish reversals, just above the new high.
                      4. Target: The initial price target can be set based on the previous trend's range or using other technical analysis tools such as Fibonacci retracement levels.
                      Example of a Bullish Hook Reversal Pattern
                      1. Day 1: The stock closes at $50.
                      2. Day 2: The stock opens at $48, makes a new low at $47, but then rallies to close at $51.
                      Example of a Bearish Hook Reversal Pattern
                      1. Day 1: The stock closes at $50.
                      2. Day 2: The stock opens at $52, makes a new high at $53, but then declines to close at $49.

                      In both cases, the reversal is signaled by the closing price moving against the recent trend direction and closing beyond the previous day's high or low.

                      The Hook Reversal pattern is relatively simple to identify and can be a useful tool for traders looking to spot potential reversals in market trends.
                      Sure, let's explore the Hook Reversal pattern in greater detail.
                      Bullish Hook Reversal


                      A Bullish Hook Reversal pattern occurs during a downtrend and signals a potential reversal to an uptrend. Here are the detailed steps and characteristics:
                      1. Downtrend Presence: The market must be in a confirmed downtrend before the pattern appears. This indicates prevailing bearish sentiment.
                      2. Day 1: The stock closes at a certain price, let's call it Price A. This day reflects the continuation of the downtrend.
                      3. Day 2:
                        • Open: The stock opens lower than Price A, suggesting that bearish sentiment is still strong. Let's call this opening price Price B.
                        • Low: During the day, the stock makes a new low, further confirming the downtrend. This is Price C.
                        • Close: By the end of the day, the stock reverses direction and closes above Price A (the previous day's close). Let's call this closing price Price D.
                      Bearish Hook Reversal


                      A Bearish Hook Reversal pattern occurs during an uptrend and signals a potential reversal to a downtrend. Here are the detailed steps and characteristics:
                      1. Uptrend Presence: The market must be in a confirmed uptrend before the pattern appears. This indicates prevailing bullish sentiment.
                      2. Day 1: The stock closes at a certain price, let's call it Price A. This day reflects the continuation of the uptrend.
                      3. Day 2:
                        • Open: The stock opens higher than Price A, suggesting that bullish sentiment is still strong. Let's call this opening price Price B.
                        • High: During the day, the stock makes a new high, further confirming the uptrend. This is Price C.
                        • Close: By the end of the day, the stock reverses direction and closes below Price A (the previous day's close). Let's call this closing price Price D.
                      Chart Example of Bullish Hook Reversal


                      plaintext
                      Copy code
                      Day 1: Close = $50 Day 2: Open = $48, Low = $47, Close = $51
                      In this example, the stock opened lower, made a new low during the day, but then reversed and closed higher than the previous day's close, forming a Bullish Hook Reversal pattern.
                      Chart Example of Bearish Hook Reversal


                      plaintext
                      Copy code
                      Day 1: Close = $50 Day 2: Open = $52, High = $53, Close = $49
                      In this example, the stock opened higher, made a new high during the day, but then reversed and closed lower than the previous day's close, forming a Bearish Hook Reversal pattern.
                      Confirmation and Volume
                      • Confirmation: Traders often look for confirmation of the reversal pattern. This might include additional price movement in the direction of the reversal on subsequent days. For example, after a Bullish Hook Reversal, seeing the price move higher on the next day helps confirm the pattern.
                      • Volume: An increase in trading volume on the reversal day adds significance to the pattern. Higher volume suggests stronger conviction behind the reversal.
                      Trading Strategies Using Hook Reversal Patterns
                      1. Entry Point:
                        • For a Bullish Hook Reversal, consider entering a long position at the close of the reversal day or at the open of the next trading day.
                        • For a Bearish Hook Reversal, consider entering a short position at the close of the reversal day or at the open of the next trading day.
                      2. Stop-Loss Placement:
                        • For a Bullish Hook Reversal, a stop-loss can be placed just below the new low made during the reversal day.
                        • For a Bearish Hook Reversal, a stop-loss can be placed just above the new high made during the reversal day.
                      3. Profit Targets:
                        • Initial profit targets can be set based on recent price action. For a Bullish Hook Reversal, targets can be set at previous resistance levels. For a Bearish Hook Reversal, targets can be set at previous support levels.
                        • Fibonacci retracement levels can also be used to set profit targets. For example, retracement levels like 38.2%, 50%, and 61.8% of the prior trend can provide potential target areas.
                      Example with Detailed Steps

                      Bullish Hook Reversal Example:
                      1. Day 1: Close at $50.
                      2. Day 2:
                        • Open at $48 (Price B).
                        • Make a new low at $47 (Price C).
                        • Close at $51 (Price D), which is above the previous day's close of $50.

                      The trader might enter a long position at the close of Day 2 or the open of Day 3, with a stop-loss placed just below $47 and an initial target at a previous resistance level, say $55.
                      Bearish Hook Reversal Example:
                      1. Day 1: Close at $50.
                      2. Day 2:
                        • Open at $52 (Price B).
                        • Make a new high at $53 (Price C).
                        • Close at $49 (Price D), which is below the previous day's close of $50.

                      The trader might enter a short position at the close of Day 2 or the open of Day 3, with a stop-loss placed just above $53 and an initial target at a previous support level, say $45.
                      Conclusion


                      The Hook Reversal pattern is a reliable indicator of potential market reversals, with clear entry and exit strategies to manage trades effectively. It requires the presence of a strong preceding trend and confirmation through subsequent price action or volume increase. Traders often use this pattern in conjunction with other technical analysis tools to enhance its effectiveness.


                      • #12 Collapse

                        What Is Falling Wedge Chart Pattern Analysis??


                        Click image for larger version

Name:	download - 2024-06-29T212315.807.png
Views:	13
Size:	4.6 کلوبائٹ
ID:	13022695

                        Falling Wedge chart pattern forex trading mein ek bullish reversal pattern hai jo downward trend ke baad market mein potential uptrend ko indicate karta hai. Neeche is pattern ko detail mein roman urdu mein explain kiya gaya hai:

                        ### 1. Falling Wedge Pattern Kya Hai?

                        - **Definition:** Falling Wedge ek price pattern hai jo converge hoti hui trend lines se banta hai. Yeh pattern downward trend mein form hota hai aur ek bullish reversal signal deta hai.
                        - **Significance:** Yeh pattern indicate karta hai ke downward momentum slow ho raha hai aur buyers market mein wapas aa rahe hain, jo price reversal ka signal hota hai.

                        ### 2. Characteristics

                        - **Trend Lines:** Do trend lines hoti hain – ek resistance line jo higher highs ko connect karti hai aur ek support line jo lower lows ko connect karti hai. Dono lines converge hoti hain.
                        - **Volume:** Pattern formation ke dauran volume kam hota hai lekin breakout ke waqt volume mein spike aata hai.
                        - **Duration:** Yeh pattern kisi bhi time frame par form ho sakta hai – short-term, medium-term, ya long-term.

                        ### 3. Interpretation

                        - **Bullish Reversal:** Falling Wedge pattern ek bullish reversal signal hota hai. Jab price wedge ke upper resistance line ko break karta hai, yeh buy signal hota hai.
                        - **Trend Confirmation:** Breakout ke baad price ka steadily increase hona trend confirmation ko indicate karta hai.

                        ### 4. Trading Strategy

                        #### Entry Point

                        - **Buy Entry:** Jab price wedge ke upper resistance line ko break kare aur volume increase ho, yeh buy signal hota hai.
                        - **Confirmation:** Breakout ke baad ek retracement (pullback) aur uske baad upward movement ka wait karna bhi zaroori hai.

                        #### Stop-Loss

                        - **Placement:** Stop-loss ko wedge ke neeche ke support line ke neeche place karein taake aap unexpected price reversals se protect ho sakein.

                        #### Profit Target

                        - **Previous Resistance Levels:** Profit target ko previous resistance levels ya wedge ki height ke barabar distance par set karein.

                        ### 5. Risk Management

                        - **Position Sizing:** Apni total account balance aur risk tolerance ke mutabiq position size determine karein.
                        - **Stop-Loss Orders:** Stop-loss orders ko effectively use karke apne losses ko limit karein.
                        - **Diversification:** Apni trades ko diversify karein taki aapka overall risk spread ho jaye.

                        ### 6. Practical Tips

                        - **Backtesting:** Apni strategies ko historical data par backtest karein taki aap unki effectiveness ko evaluate kar sakein.
                        - **Continuous Learning:** Market trends aur new trading techniques ke bare mein continuously seekhte rahen.
                        - **Trading Journal:** Ek trading journal maintain karein aur apni trades ko document karein, taki aap apni performance ko track kar sakein aur improvements kar sakein.

                        ### 7. Psychological Aspects

                        - **Discipline:** Discipline maintain karna bohot zaroori hai. Apni trading plan ko strictly follow karein aur emotional trading se bachne ki koshish karein.
                        - **Patience:** Market movements ko observe karein aur appropriate opportunities ka wait karein. Jaldbazi mein decisions na lein.

                        ### 8. Advantages of Falling Wedge Pattern

                        - **Early Reversal Signal:** Yeh pattern early stage mein bullish reversal ko identify karne mein madad karta hai.
                        - **Clear Entry and Exit Points:** Yeh pattern clear entry aur exit points provide karta hai jo trading decisions ko simplify karte hain.

                        ### 9. Disadvantages of Falling Wedge Pattern

                        - **False Breakouts:** Kabhi-kabhi price false breakout karti hai jo misleading signals de sakti hai. Isliye, other indicators aur confirmations ke sath trade karna zaroori hai.
                        - **Subjectivity:** Pattern identification subjective ho sakta hai, jo inexperienced traders ke liye challenging ho sakta hai.

                        ### 10. Example Chart

                        #### Falling Wedge Pattern Example
                        ![Falling Wedge Pattern Example](https://www.tradingview.com/x/somechartURL)

                        ### 11. Conclusion

                        Falling Wedge pattern forex trading mein ek valuable tool hai jo downward trend ke baad bullish reversal ko identify karne mein madad karta hai. Is pattern ko effectively use karne ke liye risk management, disciplined trading practices, aur continuous learning bohot zaroori hain. Trading performance ko improve karne ke liye backtesting aur trading journal maintain karna bhi helpful hota hai.
                        • #13 Collapse

                          **Falling Wedge Chart Pattern Analysis**
                          Falling Wedge ek mukhtalif chart pattern hai jo technical analysis mein price action ko interpret karne ke liye istemal hota hai. Yeh pattern typically downtrend ke baad appear hota hai aur price ke consolidation phase ko represent karta hai jahan price lower highs aur lower lows bana raha hota hai, lekin ek narrow range mein.

                          **Falling Wedge Chart Pattern Ki Tashkeel**

                          Falling Wedge pattern mein kuch key characteristics shamil hote hain:

                          - **Sloping Trendlines:** Falling Wedge pattern mein ek descending upper trendline aur ek descending lower trendline hoti hai jo gradually converge hoti hain.

                          - **Decreasing Volume:** Is pattern ke dauran volume usually decrease hota hai, indicating ke market ki volatility kam hoti hai aur potential breakout ke liye buildup ho raha hai.

                          **Falling Wedge Chart Pattern Ki Tafsilaat**

                          - **Bullish Reversal Signal:** Falling Wedge pattern typically bullish reversal signal deta hai jab price lower highs aur lower lows bana raha hota hai lekin ek narrow range mein. Jab price wedge ke upper trendline ko break karta hai, yeh bullish breakout signal ho sakta hai.

                          - **Entry Points:** Traders typically entry point confirm hone ke baad enter karte hain, often near the breakout point of the upper trendline.

                          - **Stop Loss:** Stop-loss orders usually recent swing lows se thoda aage set kiye jate hain to protect against potential losses if the breakout fails.

                          - **Targeting Profits:** Profit targets set kiye jate hain previous resistance levels ya Fibonacci extension levels par based, capturing potential upward price movements.

                          **Falling Wedge Chart Pattern Ke Fayde aur Nuqsanat**

                          - **Fayde:** Falling Wedge pattern traders ko early indication deta hai potential trend reversals ke liye, jo profitable trading opportunities create kar sakta hai.

                          - **Nuqsanat:** Is pattern ki effectiveness market conditions aur additional technical indicators par depend karti hai, aur false breakouts bhi ho sakte hain.

                          **Tajziya aur Conclusion**

                          Falling Wedge chart pattern ek valuable tool hai jo traders ko market ke trend reversals aur entry points ko identify karne mein madad deta hai. Is pattern ko sahi tarike se samajhne aur confirm karne ke baad hi traders apne trading strategies ko adjust karna chahiye. Hamesha zaroori hai ke traders risk management techniques ko bhi istemal karen aur market volatility ko samajhne ke liye vigilant rahen. Falling Wedge pattern ke saath additional technical analysis aur market sentiment ko bhi consider karna important hai trading success ke liye.
                           
                          • #14 Collapse

                            ### Falling Wedge Chart Pattern: Kya Hai Aur Iska Analysis Kaise Kiya Jata Hai?
                            Falling wedge chart pattern ek technical analysis tool hai jo ke price movements ko interpret karne mein madad deta hai, especially during trends ke reversal ke times. Yeh pattern typically bullish trend ke baad form hota hai aur market mein potential uptrend ke signals provide karta hai.

                            #### Falling Wedge Ka Structure

                            Falling wedge pattern aik triangle shape form karta hai jahan price ek downward sloping trend line aur ek upward sloping support line ke darmiyan contract hota hai. Is pattern mein, lower highs aur lower lows observed hote hain jo ke slowly contraction ki taraf point karte hain.

                            #### Falling Wedge Ka Interpretation

                            Falling wedge pattern ko interpret karte waqt traders kuch key points consider karte hain:
                            - **Bullish Reversal:** Falling wedge pattern bearish trend ke baad appear hota hai aur isay bullish reversal signal samjha jata hai. Jab price falling wedge ke andar reh kar break out karta hai, yeh indicate karta hai ke selling pressure kam ho rahi hai aur buying interest increase ho raha hai.
                            - **Volume:** Pattern ke breakout ke samay volume ki increase bhi dekhi jati hai, jo ke price movement ke strength ko confirm karta hai.

                            #### Falling Wedge Pattern Ka Use

                            Falling wedge pattern ko trading strategies mein integrate karne ke liye traders kuch important steps follow karte hain:
                            - **Pattern Recognition:** Sabse pehle traders ko falling wedge pattern ko identify karna hota hai current market conditions mein.
                            - **Entry Points:** Pattern ke breakout ke baad entry points ko determine kiya jata hai. Traders typically entry ko breakout ke thori der baad confirm karte hain to avoid false breakouts.
                            - **Stop Loss Aur Targets:** Entry ke sath sath stop loss placement aur profit targets set kiye jate hain, based on risk tolerance aur market volatility.

                            #### Trading Strategies Using Falling Wedge Pattern

                            Traders falling wedge pattern ke signals ko confirm karne ke liye aur trading strategies develop karne ke liye kuch techniques use karte hain:
                            - **Confirmation:** Pattern ke breakout ke confirmation ke liye traders doosre technical indicators aur price action ka use karte hain.
                            - **Risk Management:** Effective risk management strategies ka use kar ke traders apne trades ko manage karte hain, including stop loss placements aur position sizing.

                            #### Conclusion

                            Falling wedge chart pattern ek useful tool hai jo ke market analysis mein use hota hai, especially trend reversals ko identify karne ke liye. Is pattern ki sahi tareeke se samajhna aur apply karna traders ke liye important hai ta ke accurate trading decisions liye ja sakein. Falling wedge pattern ke sath sath, traders doosre technical tools aur indicators ka bhi istemal karte hain to enhance their trading strategies aur consistent profitability achieve karne mein madad milti hai.
                            • <a href="https://www.instaforex.org/ru/?x=ruforum">InstaForex</a>
                            • #15 Collapse

                              **Falling Wedge Chart Pattern Analysis: Kya Hai Aur Kaise Trade Karein?**
                              Forex trading mein chart patterns ko analyze karke market ke future movements ko predict kiya jata hai. Ek aisa chart pattern jo traders ke darmiyan mashhoor hai, woh hai Falling Wedge. Yeh pattern market ke reversal aur continuation signals ko provide karta hai. Is article mein hum Falling Wedge chart pattern ke baare mein detail se discuss karenge aur dekhenge ke is pattern ko effectively kaise trade kiya jaye.

                              **Falling Wedge Pattern Kya Hai?**

                              Falling Wedge ek technical chart pattern hai jo downtrend ke dauran banata hai aur yeh typically market ke reversal signal ko indicate karta hai. Yeh pattern do converging trendlines se mil kar banta hai:

                              1. **Upper Trendline**: Yeh downward sloping trendline hoti hai jo higher highs ko connect karti hai.
                              2. **Lower Trendline**: Yeh bhi downward sloping trendline hoti hai jo lower lows ko connect karti hai.

                              **Pattern Identification:**

                              1. **Downtrend**: Falling Wedge pattern usually downtrend ke dauran form hota hai. Market ke price lower lows aur higher highs create karti hai lekin yeh trendlines ke through converging hota hai.

                              2. **Convergence**: Pattern ke formation ke dauran, upper aur lower trendlines converging hote hain, jisse ek wedge shape banata hai.

                              3. **Pattern Completion**: Pattern tab complete hota hai jab price wedge ke upper trendline ko break kar leti hai, jo bullish reversal signal ko indicate karta hai.

                              **Falling Wedge Pattern Ki Analysis:**

                              1. **Reversal Signal**: Falling Wedge pattern market ke downward trend ke end ko indicate karta hai aur yeh bullish reversal signal de sakta hai. Jab price pattern ke upper trendline ko break karti hai aur close hoti hai, to yeh ek buy signal hota hai.

                              2. **Entry Point**: Buy position tab open ki jati hai jab price Falling Wedge pattern ke upper trendline ko break kar leti hai. Confirmation ke liye, pattern break hone ke baad ek strong bullish candle ka wait karein.

                              3. **Stop Loss**: Risk management ke liye stop loss set karna zaroori hai. Stop loss ko pattern ke lower trendline ke neeche ya recent low ke neeche set kar sakte hain. Yeh aapko unexpected market movements se protect karega.

                              4. **Take Profit**: Take profit levels ko previous resistance levels ya pattern ke height ke mutabiq set karein. Yeh aapko potential profit targets achieve karne mein madad karte hain.

                              5. **Volume Analysis**: Volume bhi Falling Wedge pattern ke analysis mein important hota hai. Pattern ke completion ke waqt volume ka increase confirmatory signal ho sakta hai.

                              **Benefits aur Limitations:**

                              - **Benefits**:
                              - Falling Wedge pattern market ke bullish reversal signal ko accurately identify kar sakta hai.
                              - Yeh pattern trading decisions ko assist karne ke liye clear entry aur exit points provide karta hai.

                              - **Limitations**:
                              - Yeh pattern false signals bhi generate kar sakta hai, especially agar market volatile ho.
                              - Pattern ko identify karna aur uski confirmation milna thoda challenging ho sakta hai, jo practice aur experience ki zaroorat hoti hai.

                              **Mukhtasir:**

                              Falling Wedge chart pattern Forex trading mein ek useful tool hai jo downtrend ke dauran bullish reversal signals ko identify karta hai. Is pattern ko effectively trade karne ke liye, aapko pattern ke formation aur confirmation signals ko closely monitor karna zaroori hai. Entry points, stop loss, aur take profit levels ko sahi tarah se set karne ke liye, market analysis aur risk management techniques ka use karein. Trading mein patience aur discipline hamesha successful trading ke key factors hote hain.
                               

                              اب آن لائن

                              Working...
                              X