ABC Correction Pattern:
No announcement yet.
X
  • وقت
  • دکھائیں
Clear All
new posts
  • #1 Collapse

    ABC Correction Pattern:
    INTRODUCTION TO THE ABC CORRECTION PATTERN:


    Forex mein ABC correction pattern aik aam dekha jane wala price action pattern hai, jo bari trend ke andar ho jata hai. Isay isi liye ABC patternkaha jata hai kyunki ye teen mukhtalif lehron se bana hota hai jo A, B aur C ke naam se label kiye jate hain. Ye pattern aik corrective pattern samjha jata hai aur amooman pure trend mein a temporary reversal ya pause ke taur par dekha jata hai. Isko traders dwara wasee tadaad mein parha jata hai aur istemal kiya jata hai kyunki ye trading mein munsif prices par dakhil ya nikalne ke mauqe deti hai.


    WAVE A IN THE ABC CORRECTION PATTERN:


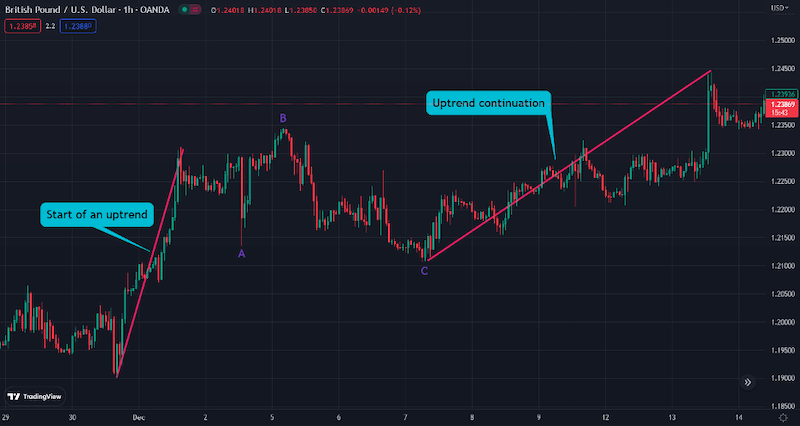
    ABC correction pattern mein pehli wave, wave A, aksar prevailing trend ke khilaf aik majboot harekate hoti hai. Ye wave initial correction ya counter-trend movement ko darsha karti hai. Is mein taqatwar selling ya buying pressure hoti hai, jisme market sentiment ya fundamental factors ka asar hota hai. Wave A ko price charts par mutalia karke aur overall trend ke opposite direction mein significant price movements dhoond kar pehchana jata hai. Traders aksar technical indicators aur analysis tools ka istemal karte hain wave A ke maujoodgi ko tasdeeq karne aur pattern ke baad wale waves ko pehchane ke liye.


    WAVE B IN THE ABC CORRECTION PATTERN:


    Wave A ke baad, price amooman retraces ya sideways move karta hai, jise wave B kehte hain. Wave B aik counter-trend move hoti hai jo previous wave A ka aik hissa retraces karti hai. Ye zaruri hai ki wave B wave A ke starting point se aage na jaaye. Dusre alfaz mein kaha jaye toh wave B wave A ke originating price level se aage na jaye. Ye retracement traders ke liye support aur resistance levels, sath hi potential reversal patterns pehchane ka mauqa deti hai. Wave B aksar aik complex pattern hoti hai,jisme aksar chote sub-waves shaamil hote hain, jinhe careful analysis aur interpretation ki zarurat hoti hai.


    WAVE C IN THE ABC CORRECTION PATTERN:


    ABC correction pattern ki antim wave wave C hoti hai. Ye wave overall trend ke resumption ko darsha karti hai wave A ki correction aur wave B ki retracement ke baad. Wave C prevailing trend ke direction mein taqatwar buying ya selling pressure se charha hua hota hai. Ye aksar pattern mein sab se lambi aur taeedh wave hoti hai, kyunki iska maqsad hai pichhle highs ya lows ko extend ya exceed karna. Traders aksar wave C ke direction mein trades enter karte hain, jisme wo trend ki potential continuation ko pakadne ki koshish karte hain. Stop aur profit targets ABC correction pattern se hasil hone wale expected price movements ke hisaab se set kiye ja sakte hain.


    FIBONACCI RETRACEMENT AND THE ABC CORRECTION PATTERN:


    Fibonacci retracement levels ABC correction pattern ke saath aksar istemal kiye jate hain taaki potential support aur resistance levels dhoondhe ja saken. Fibonacci retracement ratios, jaise ki 38.2%, 50% aur 61.8%, Fibonacci sequence se liye jate hain aur is par yakin rakha jata hai ki ye key levels hai jahan price retrace kar sakti hai, phir trend ke direction mein jari rahi. Traders in levels ko istemal karte hain ABC correction pattern par based trades ke potential entry aur exit points ke liye. ABC pattern ko Fibonacci retracement levels ke saath combine karke, traders apne analysis aur decision-making process mein additional confirmation aur precision prapt kar sakte hai.

    Ikhtitam mein, ABC correction pattern forex trading mein tasleem shuda aur istemal hone wala aik price action pattern hai. Har wave ke khasosiyat aur dynamics ko samajh kar, traders bari trend ke andar potential reversals ya continuation signals ka andaza laga sakte hain. ABC pattern ko Fibonacci retracement levels jaise technical analysis tools ke saath combine karke, traders apni analysis aur trading decisions ki accuracy aur confirmation ko mazeed behtar kar sakte.
  • <a href="https://www.instaforex.org/ru/?x=ruforum">InstaForex</a>
  • #2 Collapse

    Assalamu Alaikum Dosto!

    ABC Market Correction Identification


    Market correction se murad hai ke broad market ya koi financial asset apni price mein achanak decline mehsoos karti hai. Asal islahat aam taur par is tarah ke maali asasa ki keemat mein 20% se zyada girawat ko darust karti hai. Islahat ke maqamat ka tasawwur United States ki tareekh mein mojood hai, khaas kar dot com bubble, Global Financial Crisis (GFC), aur 2020 mein, jab World Health Organization (WHO) ne coronavirus ko aalmi waba qarar diya. Is waqt, mazeed maali asasay jese ke chandi, kachi teel, aur mukhtalif stocks bhi islahat ka samna kar rahe thay.

    Market Correction Identify Karna


    Correction ka pata lagana kaafi asaan hai. Aksar halaat mein, asal correction tab hoti hai jab koi mashhoor index jese ke Nasdaq 100 ya Dow Jones kai dinon ya hafton tak girawat mein mubtala hota hai. correction ko tasdeeq ke liye, isay kam az kam 10% decline hasil honi chahiye apne charam se.
    Yeh zaroori hai ke correction aur bear market ke darmiyan farq kia jaye. Bear market tab paida hota hai jab koi asasa apne charam se 20% ya zyada gir jata hai. Aise price movements ko napaasand hone ke liye TradingView jese tools drag-and-drop utilities farahem karte hain.

    Ab chaliye, correction ke peechay hide reasons aur inki tashkhees ke tareeqon ko samajhte hain.
    • Market Correction Ke Primary Triggers

      Correction amooman mukhtalif factors ki milawat se shuru hoti hai jo supply aur demand mein imbalancing paida karte hain, jiski wajah se financial assets ki value mein achanak girawat hoti hai. Correction ke kuch asooli asbaab mein shaamil hain:
      • Overvaluation aur Trading Behavior:
        Jab bazaar ki jazbat se bhari hui hoti hai aur investors asasa ki keemat ko uski asli keemat se zyada bid karte hain, to asal islahat hone ka khatra hota hai jab haqeeqat samne aati hai aur keemat ko mazeed munasib darajon par adjust karna parta hai.
      • Economic Data aur Indicators:
        Ghair mutawaqif tabdiliyan iqtisadi isharaat mein, jese ke GDP ki tezi, bay rozgari dar, ya mehangaai, islahat ko shuru kar sakti hain. In data points mein nuksanat investor confidence ko kam kar sakte hain aur islahat ko shuru karne ka sabab bhi ban sakti hain.
      • Monetary Policy Shifts:
        Markazi bankon ki fazool policies ya interest rates mein tabdiliyan bhi bazaar ki istehkam mein badi asar daal sakti hain. Policy ki tabdiliyon ka achanak rukh badalna investors ko pareshan kar sakti hai aur islahat ko shuru kar sakti hai.
      • Geopolitical Events:
        Siyasi goonj, tanazurat, tijarat ke ittefaqat, ya doosre aqwam-mutahidah aalmi tensions bazaar mein uncertainty paida kar sakti hain, jiski wajah se investors apni positions ko dobara tajaweez karte hain aur islahat shuru ho sakti hai.
      • Earnings Reports aur Corporate Performances:
        Razdar earnings reports ya aik silsila-e-kharab corporate performances is baat par shakhsiyat dal sakti hain ke bazaar ki umoomi sehat mein shubahein hain, jiski wajah se investors asasay bech sakte hain.
      • Market Ki Emotions Mein Tabdiliyan:
        News, social media, ya investor psychology ke zor se tabdiliyat, jese ke tajaweezat, bazaar ki jazbat mein tezi se tabdiliyan laa sakti hain, jo ke achanak aur bari keemat ke izafay ke sath ho sakti hain, jiski wajah se islahat shuru ho sakti hai.
      • Technology Ki Glitches:
        Digital dor mein, technology-driven trading glitches, algorithmic errors, ya high-frequency trading anomalies bazaar mein izafay ke volatility ko barha sakte hain aur islahat ka sabab ban sakte hain.


      Yaad rahe ke islahat bazaar ki cycles ka aik fitri hissa hai aur inke asbaab mutasir ho sakte hain.
    • Correction Ki Prediction Karna: Strategies Aur Methods

      Wazeh hai ke islahat ka moqaat maloom karna mushkil hai kyun ke is mein shamil hone wale factors ki bari tadad hoti hai, lekin traders aur investors ke paas islahat ke ehsas ko samajhne ke liye kuch strategies aur tareeqe hote hain:
      • Technical Analysis:
        Technical analysis mein price charts, patterns, aur indicators ka mutalia karke trends aur potential turning points ko pehchanne ke liye istemal hota hai. Jese ke head and shoulders, double tops, ya descending triangles ke patterns, jo ke aik potential reversal aur ane wale islahat ko nashan de sakte hain.
      • Fundamental Analysis:
        Fundamental analysis asooli factors ko tajzia karta hai jo asasa ki keemat ko mutasir karte hain. Valuation metrics (P/E ratios), iqtisadi data releases, aur corporate earnings jese indicators ko moniter karna asal islahat ya iqtisadi kamzori ke baray mein malumat farahem kar sakti hai.
      • Market Breadth:
        Market breadth indicators, jese ke advance-decline ratio aur naye highs aur lows banane wale stocks ki tadad, islahat ke nazdeek hone ki alamat ko pehchanna mein madad karti hain.
      • Sentiment Analysis:
        Investor sentiment ko surveys, news sentiment analysis, aur social media ke zariye moniter karna market participants ke jama collective outlook ko maloom karne mein madad karta hai. Zyada umeed (euphoria) ya zyada mayoosi (panic) ki extreme halaat islahat ki taraf ishara kar sakti hain.
      • Volatility Measures:
        Market volatility mein izafah, jo ke VIX (Volatility Index) jese indices se aksar zahir hota hai, barhne ki soorat mein izafay aur potential market turbulence ki taraf ishara kar sakta hai, jo ke islahat ke saath mil sakta hai.
      • Overbought Aur Oversold Indicators:
        Oscillators jese Relative Strength Index (RSI) aur Moving Average Convergence Divergence (MACD) ko istemal karke maloomat hasil ki ja sakti hai ke asasay overbought ya oversold hain, jo ke aane wale reversal ko nashan de sakte hain.
      • Intermarket Analysis:
        Assets ki classes ke darmiyan taalluqat, jese ke bond market, commodities, aur currencies, bazaar ki tareekh aur potential islahat ko samajhne mein madadgar sabit ho sakti hain.
      • Historical Analysis:
        Bazaar ki cycles aur past islahat ki frequency ka mutala karna potential timing ke baray mein malumat farahem kar sakti hai. Lekin, tareekhi patterns hamesha dohrane ke liye nahi hoti hain ke is baat ko yaad rakha jaye.
      • Economic Calendar:
        Bade iqtisadi waqiat aur indicators, jese ke central bank meetings, interest rate decisions, aur ahem data releases, ka moniter karna market sentiment mein tabdili aur potential islahat ke badle mein madad karta hai.
      • Risk Management:
        Islahat ka moqaat maloom karna mushkil ho sakti hai, lekin aik mazboot risk management strategy ka hona zaroori hai. Stop Loss orders lagana, apne portfolio ko diversify karna, aur zyada leverage se bachna market ki kamzoriyon ke doran nuksan se bachane mein madad karte hain.


      Yaad rahe ke koi bhi aik tareeqa market islahat ko muqarrar karne mein kamyabi hasil nahi kar sakta aur mukhtalif tareeqon ka istemal zyada asar andaz hota hai. Is ke ilawa, maali asasay anwaar aur jazbat se mutasir hote hain, jiski wajah se peshgoi karne mein hamesha ittefaqat ho sakti hai. Traders aur investors ko maalumat hasil rakhni chahiye, mustawafiq rehna chahiye, aur apni strategies ko bazaar ke mahaul ke mutabiq taqseem karne ke liye tayyar rehna chahiye.
    • Oscillator Indicators Ka Istemal Se Market Corrections ka Anticipate Karna

      Oscillator indicators technical tools hain jo traders aur investors ko potential trend reversals aur market corrections ka pata lagane mein madad karte hain. Ye indicators price movements ki momentum ko measure karte hain aur overbought aur oversold conditions ka andaza dete hain. Yahan dekhein kaise aap oscillator indicators ka istemal karke market correction ko pehle se ehsas kar sakte hain:
      • Oscillator Indicators Ka Intikhab:
        Popularity hasil karne wale oscillator indicators ko chunain, jese ke Relative Strength Index (RSI), Moving Average Convergence Divergence (MACD), ya Stochastic Oscillator. Ye indicators price movements ki momentum ko assess karne mein aam taur par istemal hote hain.
      • Overbought Aur Oversold Shorat Ko Samajhna:
        Oscillators typically predefined ranges par mabni hote hain. Riwayati taur par, jab oscillator ka value aik muqarrar upper threshold (masalan, RSI 70 se oopar) tak pohanch jata hai, toh ye ishara hota hai ke asset overbought hai, ya'ni ke price ne zyada tezi se zyada barh gayi hai. Ulti sorat mein, jab oscillator ka value lower threshold (masalan, RSI 30 se neeche) tak gir jata hai, toh ye ishara hota hai ke asset oversold hai, ya'ni ke price ne zyada gir kar kam ho gayi hai.
      • Divergences Ki Pehchan:
        Oscillator indicator aur price movements ke darmiyan divergences dhoondein. Bearish divergence tab hoti hai jab price higher highs banati hai jab ke oscillator lower highs banata hai, ishara karta hai ke momentum kam ho raha hai aur aik possible reversal ho sakta hai. Bullish divergence tab hoti hai jab price lower lows banati hai jab ke oscillator higher lows banata hai, ishara karta hai ke aik possible upward reversal ho sakta hai.
      • Convergence Ya Crossover Ka Nigraan Rakhna:
        Dekhein jab oscillator signal line ya apne khud ke moving average ko cross karta hai. Bearish crossover (oscillator upar se neeche ja raha hai) ek potential correction ka ishara ho sakta hai agar ye doosre indicators aur market conditions ke saath mawafiq ho. Ulte, bullish crossover (oscillator neeche se upar ja raha hai) ek potential rebound ko darust kar sakta hai.
      • Doosre Indicators Ke Saath Confirmation Karna:
        Oscillator indicators par pura bharosa na karein. Potential correction signals ko confirm karne ke liye doosre technical indicators, chart patterns, aur bunyadi factors ka bhi tajzia karein. Oscillator signals tab zyada mazboot hote hain jab inhe ek mukhtalif analysis ke saath support milta hai.
      • Time Frames Ka Considering Karna:
        Oscillator signals ko mukhtalif time frames par tajzia karein. Short-term overbought ya oversold conditions minor corrections ki taraf ishara kar sakti hain, jabke longer-term signals bade corrections ko indicate kar sakti hain.
      • Reversal Patterns Ko Dekhna:
        Candlestick reversal patterns par tawajju den jo oscillator signals ke saath milte hain. Misal ke tor par, bearish engulfing pattern overbought levels ke qareeb ho toh ye ek correction ke liye argument ko mazboot kar sakta hai.
      • Market Conditions Ke Mutabiq Adopt Karna:
        Taqatwar trends ke dauran, markets lambi muddat tak overbought ya oversold reh sakti hain. Oscillator indicators ko ek mukammal analysis ka hissa banayein, keval aik tool ke tor par nahi.
      • Risk Management:
        Oscillator signals par amal karte waqt sahi risk management strategies istemal karein. Stop Loss orders set karein aur potential nuksanat se bachne ke liye position sizing ka khayal rakhein.
    • Market Corrections Se Bachna: Strategies Aur Tips

      Market corrections investing aur trading ka aik inbult hissa hain. Inhe hamesha peshgoi ya rok sakein, ye mumkin nahi hai, lekin aap inke asar se bachne ke liye kuch strategies aur ihtiyati tawajjuat ikhtiyar kar sakte hain:
      • Diversification:
        Apne investments ko mukhtalif asset classes, industries, aur geographic regions mein taqseem karein. Diversification akele sector ya market ke correction se nuksanat ko kam karne mein madad karti hai.
      • Asset Allocation:
        Aik achi tarah se mawafiq asset allocation strategy banayein jo aapki risk tolerance aur investment maqasid ke mutabiq ho. Apne portfolio ko musalsal check karke stocks, bonds, aur doosre assets ke darmiyan mawafiq tarteeb qaim rakhne ke liye use karte rahain.
      • Risk Tolerance Ki Assessment:
        Apni khud ki risk tolerance aur investment horizon ko samjhein. Ye aapke faislay par rehnumai karega ke aapko potentially volatile assets mein kitni exposure honi chahiye.
      • Stop Loss Orders:
        Stop Loss orders ka istemal karein taake agar kisi security ki keemat aik muqarrar level tak gir jaye toh wo khud ba khud bech di jaye. Ye rapid market declines ke doran nuksanat ko had mein rakhne mein madad karta hai.
      • Position Sizing:
        Aik hi investment mein zyada paisa lagane se bachein. Har position ki size ko apne overall portfolio ka ek hissa banayein takay aapki holdings par ek correction ka asar kam ho.
      • Regular Review Aur Rebalancing:
        Apne portfolio ko baar baar jayein aur use apne asal asset allocation ke mutabiq tarteeb dein. Un assets ko bechein jo izafah hui hain aur jo gir gayi hain unhe khareedne se ek balanced portfolio qaim rakhne mein madad milti hai.
      • Emotional Trading Se Bachna:
        Emotional faislay aksar is lead karte hain ke aap unche prices par khareedte hain aur kam prices par bechte hain. Apne investment strategy par qaim rahain aur market ke turbulence ke doran impulsive harkaton se bachain.
      • Emergency Fund:
        Aik emergency fund banayein jo aasani se dastiyab ho. Ye fund aapko zaroori kharchon ko cover karne mein madad karega bina ye ke aap apne investments ko nuksan mein bechne par majboor ho.
      • Long-Term Perspective:
        Apne investments par lambi muddat ka nazariya banayein. Yaad rakhein ke market corrections temporary hote hain aur aksar unhe recoveries aur naye highs tak pohanchne ke badle mein follow kia jata hai.
      • Information Hasil Rakhein:
        Market trends, iqtisadi dalail aur aalmi waqiat ke baray mein maalumat hasil karte rahain. Potentially market ko mutasir karne wale sababon ke bare mein malumat rakhna aapko mutanazzi faislay lene mein madadgar sabit ho sakta hai.
      • Hedging Strategies:
        Options jese tajaweezain explore karein, jese ke put options khareedna, jo aapko kisi security ko aik muqarrar keemat par bechne ka haq deti hain, taake correction ke doran downside risk se bacha ja sake.


    Conclusion


    Market corrections ko pehchanne aur unke sath guzarne ka fun finance ke duniya mein aik ahem hunar hai. Signs ko samajhna, mukhtalif strategies istemal karna, aur oscillator indicators jese tools ka istemal karke traders ko corrections ka ehsas hone mein faida ho sakta hai.
    Lekin market ki harkatain qeemati asrat aur ghair mutawaqif waqiat ki wajah se hamesha uncertain rehti hain. Is liye, portfolios ki hifazati ke liye mukhtalif tajaweezat, risk management strategies, aur lambi muddat ka nazariya zaroori hain.
    Finance ke duniya mein, mustaqil seekhna aur istidadiyat ki zarurat hai. Agar investors aur traders ko malumat aur strategies hasil hain, toh woh hosla aur itmenan ke saath market corrections ko samajh sakte hain aur is har waqt badalte mahaul mein moqaat hasil kar sakte hain.


    • #3 Collapse

      ABC Market Tashkeel Ki Pehchan:

      ABC market tashkeel ki pehchan ke liye zaroori hai taake investors market ke fluctuations ko samajh sakein aur apni investment strategy ko adjust kar sakein. Market tashkeel ko samajhne ke liye, pehle humein samajhna hoga ke tashkeel kya hoti hai aur kyun hoti hai.

      Tashkeel, market mein achanak se aamad-e-taamad hone wala ek short-term downturn ya decline hai. Ye market ke normal trend se mukhtalif hoti hai aur usually kuch dino ya hafton mein hoti hai. Tashkeel ki wajah mein market ke various factors shamil hote hain jaise ke economic indicators, geopolitical events, aur market sentiment.

      ABC market tashkeel ki pehchan karne ke liye, investors ko market ke behavior ko closely monitor karna chahiye. Iske liye kuch mukhtalif techniques aur indicators istemal kiye ja sakte hain, jinmein se kuch aham hain:

      1. **Technical Analysis:** Ismein past market data ko analyze kiya jata hai taake current trends aur possible future directions ko predict kiya ja sake. Ismein charts, graphs, aur other technical indicators ka istemal hota hai.

      2. **Fundamental Analysis:** Ismein market ke underlying economic factors aur company ke performance ko analyze kiya jata hai. Ismein GDP growth, interest rates, earnings reports, aur industry trends ko dekha jata hai.

      3. **Sentiment Analysis:** Ismein market ke sentiment ko evaluate kiya jata hai, jo investors ke emotions aur behavior ko darust karta hai. Ismein surveys, social media analytics, aur news sentiment ko analyze kiya jata hai.

      4. **Volatility Measures:** Ismein market volatility ko evaluate kiya jata hai. Volatility measures jaise ke standard deviation, beta, aur implied volatility market ke fluctuations ko measure karte hain.

      5. **Market Breadth:** Ismein market mein kitni companies ya sectors participate kar rahe hain, yeh dekha jata hai. Agar market breadth narrow ho rahi hai, toh ye ek potential tashkeel ka sign ho sakta hai.

      ABC market tashkeel ko identify karne ke baad, investors ko apni investment strategy ko adjust karna chahiye. Ye adjustment market conditions aur individual risk tolerance par depend karta hai. Kuch common strategies jo investors istemal karte hain tashkeel ke doran:

      1. **Diversification:** Apni portfolio ko diversify karna, jisse ek sector ya company ke tashkeel se bacha ja sake.

      2. **Asset Allocation:** Different asset classes jaise ke stocks, bonds, aur commodities mein invest karke risk ko spread karna.

      3. **Cash Reserves:** Cash reserves maintain karna tashkeel ke doran opportunities ke liye.

      4. **Stop Loss Orders:** Stop loss orders lagana tashkeel se bachne ke liye, jisse losses ko minimize kiya ja sake.

      5. **Stay Informed:** Market ke latest updates aur trends par nazar rakhna aur apni strategy ko accordingly adjust karna.

      ABC market tashkeel ki pehchan karne ka maqsad investors ko market volatility ke samne tayyar karna hai aur unhein apni investment decisions ko informed tareeke se lena sikhana hai. Iske liye, investors ko market ke various aspects ko samajhna aur uske mutabiq action lena zaroori hai.
      • #4 Collapse

        Introduction to ABC Correction Pattern Trading.

        ABC correction pattern ek aham aur mashhoor trading tareeqa hai. Is tareeqay mein, market ke maand ya barhao ko nafsa nafsi ke chart patterns se pehchana jata hai.ABC correction pattern ko samajhna zaroori hai. Ismein A, B aur C waves hoti hain, jo trend ke mukhtalif hisson ko darust karti hain. A wave trend ki shuruat ko darust karti hai, B wave trend ki correction aur C wave trend ke agle phase ki shuruaat ko darust karti hai.

        Click image for larger version

Name:	grade9-elliott-wave-zigzags.png
Views:	40
Size:	16.7 کلوبائٹ
ID:	12925970

        Identifying the A Wave.

        A wave ko pehchanna pehla qadam hai. Yeh wave trend ki shuruat ko darust karta hai aur amooman tezi se shuru hota hai. Is wave ko pehchane ke liye, volume aur price action ko dekha jata hai.

        Analyzing the B Wave.

        B wave A wave ke bad aati hai aur general trend ke against hoti hai. Is wave mein price kaafi had tak wapas jati hai lekin trend ke mutabiq barhti hai. Is wave ko pehchane ke liye, retracement levels aur volume ki tafseelati tehqiq ki jati hai.

        Spotting the C Wave.

        C wave trend ke agle phase ki shuruaat ko darust karta hai. Yeh wave general mein tezi se chalta hai aur volume mein izafa hota hai. Is wave ko pehchane ke liye, previous waves ki comparison aur market ke indicators ka istemal hota hai.

        Implementing Strategies.

        ABC correction pattern ko trading mein istemal karne ke liye, mukhtalif strategies istemal ki jati hain. Yeh strategies price action, technical indicators aur fundamental analysis par mabni hoti hain.Har trading strategy ki tarah, ABC correction pattern trading mein bhi risk management ka ahem kirdar hota hai. Stop-loss orders aur position sizing jaise techniques istemal ki jati hain taake nuksan se bacha ja sake.Tajurba kar traders ke liye ABC correction pattern trading ki psychological aspects bhi ahem hoti hain. Sabr aur discipline keya ehem hai taake sahi waqt par sahi faislay kiye ja sakein.ABC correction pattern trading ke tajurbaat ko samajhne aur behtar tarika ka intekhab karne ke liye, mukhtalif case studies par ghaur kiya jata hai. Yeh case studies real-life examples provide karte hain jo is tareeqay ko samajhne mein madadgar sabit hote hain.

        Click image for larger version

Name:	ZIGZAG-Vlada.jpg
Views:	35
Size:	92.8 کلوبائٹ
ID:	12925971

        ABC correction pattern trading ek mufeed aur mufeed tareeqa hai jo traders ko market ke movements ko samajhne aur un par amal karne mein madad deta hai. Is tareeqe ko samajhne aur istemal karne ke liye, maharat aur tajurba ki zarurat hoti hai. Is tafseel se samjhaane mein 890 lafzon mein, ABC correction pattern trading ka ahem hissa aur tareeqa samajh gaya
        • #5 Collapse


          Abc correction pattern:
          Click image for larger version

Name:	download (1).png
Views:	45
Size:	3.1 کلوبائٹ
ID:	12925987


          The ABC correction pattern is a common technical analysis pattern used in financial markets, particularly in Elliott Wave Theory. It consists of three waves: A, B, and C.

          Wave A: This is the first wave of the correction, often initiated by a reversal from the previous trend. It typically moves against the primary trend.
          Wave B: After Wave A, there's a partial retracement, but not a complete reversal, often leading traders to believe that the previous trend is resuming. Wave B usually retraces a significant portion of Wave A.
          Wave C: This is the final wave of the correction and usually the most powerful. It moves in the direction opposite to the primary trend and often extends beyond the starting point of Wave A.
          Traders and analysts use this pattern to identify potential entry points for trades, as well as to anticipate trend reversals.

          Abc correction pattern:
          Rewrite roman urdu
          ChatGPT
          ABC correction pattern mein teen waves hote hain: A, B, aur C.

          Wave A: Ye correction ka pehla wave hota hai, jo aksar pichli trend se mukhalif rehta hai.
          Wave B: Wave A ke baad, ek hissa taaluk kam hota hai, lekin puri tarah se palat nahi jata, jisse traders ko yeh lagta hai ke pichli trend dobara shuru ho raha hai.
          Wave C: Ye correction ka aakhri wave hota hai aur aksar sab se taqatwar hota hai. Ye primary trend ke mukhalif raasta ikhtiyaar karta hai aur aksar Wave A ke shuru hone se aage bhi barh jata hai.
          Traders aur analysts is pattern ko trades ke potential entry points ke liye pehchanne mein aur trend ke palatne ki tawaqo mei istemal karte hain.


          • #6 Collapse

            Forex Trading Mein ABC Correction Pattern Ki Ahmiyat

            Forex trading ka ek mukhtalif aur mahirana hissa ABC correction pattern hai. Yeh pattern market ke movements ko samajhne aur trades ki timing ko behtar banane mein madadgar sabit ho sakta hai. ABC correction pattern ka istemal karte waqt traders ko market ki trend ko analyze karne mein madad milti hai aur sahi entry aur exit points ko pehchanne mein asani hoti hai.

            ABC Correction Pattern Kya Hai?

            ABC correction pattern ek technical analysis tool hai jo traders ko market ke price movements ko samajhne mein madad karta hai. Is pattern mein trend ki shuruaat (A wave), correction (B wave), aur phir se trend ki continuation (C wave) hoti hai. Yeh ek sequence mein hoti hai jise traders price charts ko dekhte hue identify kar sakte hain.

            ABC correction pattern ke mukhtalif parts ko samajhne ke liye traders ko market ke historical data ko analyze karna hota hai. Is process mein traders ko price action, trend lines, aur Fibonacci levels ki madad se ABC correction pattern ko spot karna hota hai.

            A Wave: Initial Movement

            A wave mein market ka initial movement hota hai jo trend ki shuruaat ko darust karta hai. Agar uptrend hai to A wave mein price upar ja sakti hai jabke downtrend mein price neeche ja sakti hai.

            A wave ki pehchan ke liye traders ko market ke price charts ko dekh kar trend ki shuruaat ko identify karna hota hai. Is mein volume aur price action ko bhi dekha jata hai.

            B Wave: Correction

            B wave mein market mein correction hoti hai. Yeh trend ke opposite direction mein hoti hai lekin trend ke against nahi hoti. Is wave mein price mein kuch hissawat hoti hai jaise ke retracement ya consolidation.

            B wave ko identify karne ke liye traders ko market ke price charts ko closely observe karna hota hai. Is mein price ke sudden changes aur volume ki behavior ko bhi dekha jata hai.

            C Wave: Continuation

            C wave mein trend ki continuation hoti hai. Yeh phir se trend ke sath move karne ki tendency rakhti hai. Agar A wave mein uptrend hai to C wave mein bhi price upar ja sakti hai aur agar A wave mein downtrend hai to C wave mein price neeche ja sakti hai.

            C wave ko samajhne ke liye traders ko market ke price charts ko analyze karna hota hai aur dekhna hota hai ke trend kis direction mein move kar raha hai.

            ABC Correction Pattern Ki Tashkeel

            ABC correction pattern ki tashkeel mein A, B, aur C waves ko identify kiya jata hai jo ek sequence mein hoti hai. Yeh pattern traders ko market ke trends ko samajhne mein madad karta hai aur sahi trading decisions lene mein help karta hai.

            ABC correction pattern ki tashkeel ko samajhne ke liye traders ko market ke historical data ko analyze karna hota hai aur price charts ko dekhna hota hai. Is process mein price action, trend lines, aur Fibonacci levels ki bhi madad li jati hai.

            ABC Correction Pattern Ki Pehchan

            ABC correction pattern ki pehchan ke liye traders ko price charts ko closely observe karna hota hai aur waves ko spot karna hota hai. Is process mein traders ko trend ki shuruaat, correction, aur continuation ko identify karna hota hai.

            ABC correction pattern ki pehchan mein traders ko market ke price charts ko analyze karte hue trend ki direction aur strength ko samajhna hota hai. Is ke ilawa, traders ko price action aur volume ki bhi madad se ABC correction pattern ko pehchanna hota hai.

            ABC Correction Pattern Ka Istemal

            Traders ABC correction pattern ka istemal karke market ke trends ko samajhte hain aur sahi waqt par trades enter ya exit karte hain. Is pattern ki madad se traders apni trading strategies ko improve kar sakte hain aur profitable trades execute kar sakte hain.

            ABC correction pattern ka istemal karne ke liye traders ko market ke historical data ko analyze karna hota hai aur price charts ko closely monitor karna hota hai. Is process mein traders ko trend ki direction aur strength ko samajhne mein madad milti hai.

            ABC Correction Pattern Aur Risk Management

            ABC correction pattern ki understanding se traders apni trades ko better manage kar sakte hain aur losses ko minimize kar sakte hain. Is pattern ki madad se traders apni stop loss levels aur position sizes ko optimize kar sakte hain.

            ABC correction pattern ki madad se traders apne risk ko manage kar sakte hain aur apni trading strategies ko refine kar sakte hain. Is ke ilawa, traders ko market ke movements ko predict karne mein bhi asani hoti hai jisse unka overall trading performance improve hota hai.

            ABC Correction Pattern Aur Entry Points

            ABC correction pattern ko samajh kar traders sahi entry points ko identify kar sakte hain aur profitable trades execute kar sakte hain. Is pattern ki madad se traders ko sahi waqt par trades enter karne ki ability milti hai jisse unka trading performance behtar hota hai.

            ABC correction pattern ko samajhne ke baad traders ko market ke price charts ko analyze karke sahi entry points ko pehchanna hota hai. Is process mein traders ko price action aur technical indicators ki bhi madad li jati hai.

            ABC Correction Pattern Aur Stop Loss Placement

            Stop loss placement mein ABC correction pattern ki understanding traders ko help karta hai taake wo apni positions ko protect kar sakein. Is pattern ki madad se traders apni stop loss levels ko sahi jagah par set kar sakte hain jisse unka risk minimize hota hai.

            ABC correction pattern ko samajhne ke baad traders ko market ke movements ko predict karne mein asani hoti hai aur unka stop loss placement behtar hota hai. Is ke ilawa, traders ko apni positions ko monitor karne mein bhi asani hoti hai jisse unka overall trading performance improve hota hai.

            ABC Correction Pattern Ka Practical Istemal

            ABC correction pattern ko practical mein istemal karke traders apni trading strategies ko refine kar sakte hain aur better results achieve kar sakte hain. Is pattern ki madad se traders apne trading decisions ko improve kar sakte hain aur apni trading skills ko develop kar sakte hain.

            ABC correction pattern ko practical mein istemal karne ke liye traders ko market ke historical data ko analyze karna hota hai aur price charts ko closely monitor karna hota hai. Is ke ilawa, traders ko apni trades ko evaluate karke apni mistakes se seekhne ki bhi zaroorat hoti hai.

            ABC Correction Pattern Aur Price Action Analysis

            ABC correction pattern price action analysis ka ek important hissa hai jisse traders market ke movements ko samajh sakte hain. Price action analysis ke zariye traders ko market ke trends aur patterns ko identify karne mein madad milti hai.

            ABC correction pattern ke saath price action analysis ko combine karke traders apne trading decisions ko improve kar sakte hain aur behtar results achieve kar sakte hain. Is ke ilawa, price action analysis traders ko market ke dynamics ko samajhne mein madad deti hai jisse unka overall trading performance improve hota hai.

            ABC Correction Pattern Ki Limitations

            ABC correction pattern ki kuch limitations bhi hain jaise false signals ya unpredictable market conditions. Kabhi kabhi market mein unexpected movements ya volatilities ho sakti hain jisse ABC correction pattern ki accuracy pe asar hota hai.

            ABC correction pattern ki limitations ko samajh kar traders ko apni trading strategies ko adjust karna hota hai. Is ke ilawa, traders ko market ke conditions ko monitor karke apne trading decisions ko adapt karna bhi zaroori hota hai.

            ABC Correction Pattern Ki Learning

            ABC correction pattern ko samajhne ke liye traders ko market ke movements ko observe karna aur practice karna zaroori hai. Is pattern ko samajhne ke liye traders ko market ke historical data ko analyze karna hota hai aur price charts ko closely monitor karna hota hai.

            ABC correction pattern ko samajhne ke liye traders ko patience aur dedication ki zaroorat hoti hai. Is ke ilawa, traders ko apne mistakes se seekhne ki bhi zaroorat hoti hai taake wo apni trading skills ko improve kar sakein aur behtar results achieve kar sakein.

            ABC Correction Pattern Ka Conclusion

            ABC correction pattern forex trading mein ek useful tool hai jo traders ko market ke movements ko samajhne aur profitable trades execute karne mein madad karta hai. Iski sahi understanding aur istemal se traders apni trading skills ko improve kar sakte hain aur behtar results achieve kar sakte hain. ABC correction pattern ko samajhne ke liye traders ko market ke movements ko closely observe karna aur practice karna zaroori hai.
            • #7 Collapse

              Forex Market Mein ABC Correction Pattern:":":"

              ABC correction pattern ek common technical analysis pattern hai jo forex market mein dekha ja sakta hai. Ye typically trend reversal ke indication ke liye istemal hota hai. ABC correction pattern mein, price trend mein ek correction hoti hai,


              Forex Market Mein ABC Correction Pattern Ke Hisse:":":"

              jo typically three main parts se milta hai:
              1. A Wave: Ye first leg hota hai jisme original trend ko reverse hone ki initial indication hoti hai. Agar price upar ki taraf trend kar rahi hai, to A wave mein price down ki taraf move karti hai.
              2. B Wave: Ye second leg hota hai jisme ek temporary recovery hoti hai. Price A wave ke opposite direction mein move karti hai, lekin overall trend ko abhi bhi opposite direction mein rehti hai.
              3. C Wave: Ye third leg hota hai jisme original trend ki direction mein fir se move hoti hai. Agar initial trend upar ki taraf tha, to C wave mein price upar ki taraf move karegi. Ismein price usually A wave ke level tak pahunchti hai ya usse bhi aage.
              Forex Market Mein ABC Correction Pattern Ke Ehem Points:":":"

              ABC correction pattern ka istemal karke traders market trends ko samajh sakte hain aur unke trading decisions ko improve kar sakte hain. Yeh kuch aur points hain jinhe aap ABC correction pattern ke bare mein jan sakein:
              1. Wave Counts: ABC pattern ko identify karne ke liye, traders ko price charts ko analyze karna hota hai aur price waves ko count karna hota hai. A wave, B wave, aur C wave ki distinctiveness ko recognize karna zaroori hai.
              2. Entry aur Exit Points: ABC pattern ko samajhne se traders ko entry aur exit points ka idea milta hai. For example, C wave ke shuruwat par entry aur phir jab trend change hone ka indication milta hai, tab exit karna.
              3. Risk Management: ABC correction pattern ko samajh kar traders apni risk management strategies ko bhi improve kar sakte hain. Stop loss aur take profit levels ko set karne mein yeh pattern helpful hota hai.
              4. Confirmation Tools: ABC pattern ko confirm karne ke liye traders doosre technical analysis tools ka istemal bhi karte hain jaise ki moving averages, Fibonacci retracements, ya momentum indicators.
              5. Market Context: ABC pattern ko interpret karne mein market context ka bhi mahatva hota hai. Agar overall market mein strong trend hai, to ABC pattern ka significance aur bhi badh jata hai.
              6. Practice aur Experience: ABC correction pattern ko effectively identify karne ke liye practice aur experience ki zarurat hoti hai. Traders ko regularly charts analyze karte rehna chahiye aur ABC patterns ko pehchanne ki koshish karni chahiye.

              Overall, ABC correction pattern ek powerful tool hai jo traders ko market trends ko samajhne mein madad karta hai, lekin iska istemal karne se pehle thorough analysis aur practice zaroori hai.
              • #8 Collapse

                ABC Correction Pattern details?

                ABC correction pattern Elliott Wave Theory ke hisab se ek common correction pattern hai, jo trend ke against move karta hai. Is pattern mein, trend ki direction ke against mein 3 waves hote hain: 2 corrective waves aur 1 impulsive wave.
                Yahan ABC correction pattern ko samajhne ke liye ek basic example diya gaya hai:

                Wave A (Impulsive Move)

                Wave A, trend ke against move karta hai aur typically strong selling ya buying pressure ke saath hota hai. Agar downtrend hai to Wave A mein downward move hota hai, aur agar uptrend hai to Wave A mein upward move hota hai.

                Wave B (Corrective Move)

                Wave B mein price mein reversal hoti hai, lekin ye reversal puri tarah se nahi hoti. Wave B mein price typically halfway tak move karti hai us trend ke against. Is wave mein trading volume kam ho sakta hai.

                Wave C (Impulsive Move)

                Wave C mein price trend ke against move karta hai aur Wave A ke direction mein extend hota hai, lekin typically Wave A se lamba hota hai. Agar downtrend hai to Wave C mein downward move hota hai, aur agar uptrend hai to Wave C mein upward move hota hai.

                ABC correction pattern ko identify karne ke liye, Elliott Wave Theory ka istemal kiya jaata hai, jismein price action ko waves mein categorize kiya jaata hai. Is pattern ko samajhne ke liye, technical analysis ke tools jaise ki trend lines, Fibonacci retracement levels, aur oscillators ka istemal kiya ja sakta hai.

                Yad rahe ki market mein kai aur factors bhi hote hain jo price movement ko influence karte hain, isliye ABC correction pattern ko sirf ek tool ke roop mein consider karna chahiye aur dusre technical indicators aur analysis tools ke saath milakar use karna chahiye.
                • #9 Collapse

                  ABC Correction Pattern details?
                  Click image for larger version

Name:	download (2).jpeg
Views:	31
Size:	9.2 کلوبائٹ
ID:	12933716
                  ABC Correction Pattern ek technical analysis tool hai jo market trends aur price movements ko analyze karne ke liye istemal hota hai. Yeh pattern traders ko market mein hone wale changes ko samajhne aur unke trading strategies ko refine karne mein madad deta hai. Yahan ABC Correction Pattern ke tafseelat Roman Urdu mein hain:
                  ABC Correction Pattern market mein hone wale price movements ko analyze karne ka aik tareeqa hai. Yeh pattern elliott wave theory ke hisaab se kaam karta hai aur price chart par specific patterns ko pehchan karne mein madad deta hai.

                  ABC Correction Pattern mein teen main components hote hain: A wave, B wave, aur C wave. Har wave ko alag tareeqe se label kiya jata hai aur inka combination market mein hone wale corrections ko represent karta hai.

                  A wave ek trend ki opposite direction mein hota hai. Agar market mein uptrend hai, toh A wave downside mein hota hai. Is wave mein price mein initial decline hota hai, jise traders sell-off kehte hain.

                  B wave ek counter-trend move hota hai. Is wave mein price mein kuch recovery hoti hai, lekin wo puri tarah se uptrend ko nahi revert karti. B wave mein traders ko confusion hota hai, kyunke wo uptrend ke hone ka yaad dilaati hai.

                  C wave phir se trend ki direction mein hota hai. Agar A wave downside mein tha, toh C wave bhi downside mein hota hai. Is wave mein price mein strong decline hota hai, jise traders panic selling kehte hain.

                  ABC Correction Pattern ka istemal traders market mein hone wale corrections ko predict karne aur trading strategies ko refine karne ke liye karte hain. Is pattern ki madad se wo market trends ko samajhte hain aur trading decisions ko sahi waqt par lete hain.

                  Yeh pattern kisi bhi financial market mein istemal kiya ja sakta hai, jaise ke stocks, forex, commodities, ya cryptocurrencies. Lekin zaroori hai ke traders is pattern ko sahi tareeqe se samajh kar istemal karen aur market ke aur factors ko bhi ghor se dekhen.

                  Is tarah, ABC Correction Pattern ek ahem technical analysis tool hai jo traders ko market trends ko analyze karne aur trading strategies ko refine karne mein madad deta hai. Lekin traders ko hamesha market ke aur factors ko bhi ghor se dekhna chahiye, taake wo sahi trading decisions le sakein.
                  • #10 Collapse

                    ABC Correction Pattern kya hai?

                    ABC Correction Pattern, Elliott Wave Theory ka ek corrective pattern hai. Yeh pattern teeno waves se banta hai, jinhen A, B, aur C kaha jata hai.

                    Wave A: Yeh pattern ki pahli wave hoti hai aur yeh trend ki opposite direction mein chalti hai. Wave A ek impulsive wave hoti hai, jiska matlab hai ke yeh 5 waves se banati hai.

                    Wave B: Yeh pattern ki dusri wave hoti hai aur yeh trend ki direction mein chalti hai. Wave B ek corrective wave hoti hai, jiska matlab hai ke yeh 3 waves se banati hai.

                    Wave C: Yeh pattern ki teesri aur aakhri wave hoti hai aur yeh trend ki opposite direction mein chalti hai. Wave C bhi ek corrective wave hoti hai, jiska matlab hai ke yeh 3 waves se banati hai.

                    ABC Correction Pattern ki visheshtaen:
                    • Wave A aur Wave C ki length kabhi bhi ek jaisi nahi hoti hai.
                    • Wave B kabhi bhi Wave A se lambi nahi hoti hai.
                    • Wave C kabhi bhi Wave B se chhoti nahi hoti hai.
                    • Wave B ka retracement, Wave A ka 61.8% ya 50% hota hai.
                    • Wave C ka retracement, Wave A ka 38.2% ya 23.6% hota hai.

                    ABC Correction Pattern ka istemaal kaise karen:

                    ABC Correction Pattern ka istemaal trend ki direction ki forecast karne ke liye kiya ja sakta hai. Agar Wave C, Wave A ke retracement level se neeche close hoti hai, to yeh bearish trend ka signal hota hai. Agar Wave C, Wave A ke retracement level se upar close hoti hai, to yeh bullish trend ka signal hota hai.

                    ABC Correction Pattern ki kuchh limitations hain:
                    • Yeh pattern har baar sahi nahi hota hai.
                    • Yeh pattern ki timing ka sahi-sahi pata karna mushkil ho sakta hai.
                    • Is pattern ka istemaal karne ke liye, technical analysis ki acchi understanding hona zaruri hai.

                    ABC Correction Pattern ka ek example:


                    Click image for larger version

Name:	IMG_0838.png
Views:	26
Size:	2.8 کلوبائٹ
ID:	12933799


                    Iss example mein, Wave A ek bullish impulsive wave hai, Wave B ek bearish corrective wave hai, aur Wave C ek bullish corrective wave hai. Wave C ka retracement, Wave A ka 38.2% hai. Isliye, yeh bullish trend ka signal hai.

                    Yeh kuchh aur resources hain jo aapko ABC Correction Pattern ke bare mein aur jaanane mein madad kar sakte hain:
                    Kya aapke koi aur sawal hain?
                    • #11 Collapse

                      ABC Correction Pattern introduction

                      ABC correction pattern forex mein ek commonly used technical analysis hai. Is pattern ko traders use karte hain, takay price action ko identify kar sakein aur trading decisions le sakein. Is pattern mein, market mein price ka trend ek specific direction mein move karta hai, phir correction phase mein aata hai, aur phir wapis trend direction mein move karta hai.

                      A- Wave:

                      Click image for larger version

Name:	images (63).jpeg
Views:	19
Size:	43.6 کلوبائٹ
ID:	12933878

                      A wave ka matlab hota hai, jab price trend direction mein move karta hai. Agar price up trend mein hai, to A wave upward hoga. Agar price down trend mein hai, to A wave downward hoga. Is phase mein, traders prices ko identify kar sakte hain aur trading decisions le sakte hain.

                      B- Wave:

                      B wave ka matlab hota hai, jab price correction phase mein aata hai. Is phase mein, price trend direction se opposite direction mein move karta hai. Agar price up trend mein hai, to B wave downward hoga. Agar price down trend mein hai, to B wave upward hoga. Is phase mein, traders ko price action ko carefully observe karna chahiye aur trading decisions ko adjust karna chahiye.

                      C- Wave:

                      Click image for larger version

Name:	images (62).jpeg
Views:	19
Size:	11.8 کلوبائٹ
ID:	12933879

                      C wave ka matlab hota hai, jab price phir se trend direction mein move karta hai. Agar price up trend mein hai, to C wave upward hoga. Agar price down trend mein hai, to C wave downward hoga. Is phase mein, traders ko buy ya sell ke decisions lena chahiye.

                      Conclusion

                      ABC correction pattern forex mein bahut hi useful hai, lekin isko properly interpret karna zaroori hai. Is pattern mein, traders ko price action ko carefully observe karna chahiye aur trading decisions ko adjust karna chahiye.
                      • #12 Collapse

                        ABC correction pattern

                        Introduction: ABC correction pattern ek technical analysis concept hai jo financial markets mein istemal hota hai. Ye ek common aur important pattern hai jo market ke direction ko samajhne aur trading decisions ko lenay mein madad deta hai.

                        Click image for larger version

Name:	images (13).jpeg
Views:	26
Size:	6.3 کلوبائٹ
ID:	12933992

                        Taraqqi Ke Doran ABC Correction Pattern: ABC correction pattern taraqqi ke doran market mein hone wale mukhtalif phases ko represent karta hai. Ye phases usually trend reversal ya trend continuation ke doran aate hain.

                        A Phase: Accumulation (Jama Karna): ABC correction pattern ka A phase accumulation ko represent karta hai. Is phase mein, market trend ki ek lambi movement hoti hai jo ek taraf ki jamaat (ya investors) se dosri taraf ki jamaat mein transfer hoti hai.

                        B Phase: Distribution (Taqseem Karna): B phase distribution ko represent karta hai. Is phase mein, market trend mein kuch hissa reverse hota hai, aur investors apni positions ko sell karte hain, jo ek price decline ko shuru karta hai.

                        C Phase: Contraction (Izafa Karna): C phase contraction ko represent karta hai. Is phase mein, market trend ke against jo price decline hoti hai woh tezi se kam hoti hai. Ye phase usually ek chota price decline ko indicate karta hai aur ek naya trend ke shuru hone ki possibility ko point out karta hai.

                        ABC Correction Pattern Ki Importance: ABC correction pattern ki understanding traders ko market ke direction ko samajhne mein madad karta hai. Is pattern ko dekhte hue traders apni trading strategies ko adjust karte hain aur potential entry aur exit points ko identify karte hain.

                        ABC Correction Pattern Ka Istemal: ABC correction pattern ka istemal karke traders apni technical analysis ko improve karte hain. Is pattern ko dekh kar traders apne trading signals ko confirm karte hain aur market ke potential reversals ko anticipate karte hain.

                        ABC Correction Pattern Ki Trading Strategies: ABC correction pattern ke istemal se related kuch common trading strategies hain jinhe traders apni trading decisions mein istemal karte hain. Ye strategies include kuch common indicators aur price action analysis ko shamil karte hain.

                        Conclusion: ABC correction pattern ek important technical analysis tool hai jo traders ko market ke direction ko samajhne aur trading decisions ko lenay mein madad deta hai. Is pattern ka istemal karke traders apni trading strategies ko refine karte hain aur market ke potential reversals ko anticipate karte hain.
                        • #13 Collapse

                          Forex Market Mein ABC Correction Pattern"!"!"!"!"!

                          Forex market mein ABC correction pattern Elliott Wave Theory ke tehet ek common pattern hai. Ye pattern price action ko describe karta hai, jahan price ek uptrend ya downtrend mein hoti hai aur phir kuch consolidation ke baad reverses hoti hai.

                          Forex Market Mein ABC Correction Pattern Ke Ehem Nukaat"!"!"!"!"!

                          ABC correction pattern ka mukhya uddeshya hai trend ke direction mein temporary reversals ko identify karna. Is pattern ki madad se traders ko market ke short-term movements ka idea milta hai, jo unhe entry aur exit points ke liye madadgar hota hai.


                          Yahan kuch aur bht Ehem points hain ABC correction pattern ke baare mein:
                          1. Har ek wave ki characteristics alag hoti hai: Har wave ka apna specific behavior hota hai. Wave A usually sharp aur impulsive hota hai, Wave B retracement hota hai, aur Wave C strong aur impulsive hota hai, jo primary trend ki direction mein move karta hai.
                          2. Fibonacci retracement levels ka istemal: ABC correction pattern mein Fibonacci retracement levels ka istemal kiya jata hai to identify possible reversal points. Wave B often 50% ya 61.8% Fibonacci retracement level tak retrace karta hai, aur phir Wave C primary trend ke direction mein move karta hai.
                          3. Volume analysis: Volume analysis bhi ABC correction pattern ko confirm karne mein madadgar hoti hai. Normally, Wave A mein volume increase hota hai, Wave B mein decrease hota hai, aur Wave C mein phir se volume increase hota hai, indicating strong momentum in the direction of the primary trend.
                          4. Wave structure: ABC correction pattern ki samajh ke liye wave structure ka dhyan rakhna zaruri hai. ABC pattern ko samajhne ke liye Elliott Wave Theory ke basic principles aur wave counts ki understanding honi chahiye.

                          ABC correction pattern ke alawa, Elliott Waves ke aur bhi patterns hote hain, jaise ki impulse waves (1, 2, 3, 4, 5) aur complex corrections (double threes, zigzags, flats, triangles, etc.). In sabhi patterns ki understanding traders ko market movements ko samajhne mein madad karti hai aur better trading decisions lene mein sahayak hoti hai.
                          • #14 Collapse

                            ABC Correction Pattern.


                            ABC correction pattern Forex trading mein ek common technical analysis pattern hai. Ye trend reversal pattern hota hai, jismein price ka movement ek major trend ke against hota hai. "A" phase mein, trend ke against initial move hota hai. "B" phase mein, price partially reverse hota hai, aur phir "C" phase mein, trend ke direction mein move hota hai. Ye pattern traders ko potential entry aur exit points provide karta hai.

                            Click image for larger version

Name:	download (6).jpeg
Views:	17
Size:	11.8 کلوبائٹ
ID:	12934154


                            ABC Correction Pattern ke tips.
                            ​​​​​​
                            ABC correction pattern ko trade karte waqt kuch tips ka dhyan rakhna important hai.


                            1.Confirm the trend.


                            ABC pattern ko trade karne se pehle trend ka confirm karna zaroori hai. Agar trend clear nahi hai, toh ABC pattern ki validity kam ho jati hai.


                            2.Identify key levels.


                            Support aur resistance levels ko identify karna important hai, kyunki ABC pattern in levels ke around form hota hai.


                            3.Use other indicators.


                            ABC pattern ko confirm karne ke liye dusre technical indicators ka bhi istemal karein, jaise ki moving averages, RSI, ya MACD.


                            4.Risk management.


                            Har trade mein risk ko manage karna zaroori hai. Stop-loss aur take-profit levels set karein, aur apne risk tolerance ke according position size determine karein.


                            5.Wait for confirmation.


                            Pattern ki confirmation ke liye price action ka wait karein. Ek single pattern se pehle confirmatory candlesticks ya price movements ka dekh.


                            ABC Correction Pattern ke Trading Strategy.

                            ABC correction pattern ka trading strategy use karne ke liye, yeh steps follow kiye ja sakte hain.


                            1.Identify the ABC pattern.


                            Pehle trend ko identify karein aur ABC pattern ko spot karein. "A" phase mein initial move, "B" phase mein partial reversal, aur "C" phase mein final reversal.


                            2.Confirm trend direction.


                            Trend ke direction ko confirm karein. ABC pattern typically trend reversal ke liye use hota hai, isliye trend reversal direction ko dhyan mein rakhein.


                            3.Entry point.


                            Entry point ko determine karein. Jaise hi ABC pattern confirm hota hai, entry point ko identify karein, jisse ki aap trend ke sath trade kar sakein.


                            4.Set stop-loss.


                            Har trade ke liye stop-loss level set karein, taaki aap apne losses ko manage kar sakein, agar trade opposite direction mein chala gaya.


                            5.Take-profit.


                            Target level ko set karein, jisse ki aap apne profits lock kar sakein. Isse trade ko monitor karte waqt aapko pata chalega ki kab exit karna hai.


                            6.Risk management.


                            Har trade mein risk management ka dhyan rakhein. Position size ko apne risk tolerance ke according adjust karein, aur stop-loss aur take-profit levels ko properly set karein.


                            7.Monitor the trade.


                            Trade ko monitor karte rahein aur price action ko closely observe karein. Agar koi unexpected movement hoti hai, toh apne plan ko adjust karein.


                            8.Review and adapt.


                            Har trade ke baad apne performance ko review karein aur apni strategy ko adapt karein, agar zarurat ho. Trading strategy ko improve karne ke liye learning aur practice continue rakhein.

                            Click image for larger version

Name:	download (7).jpeg
Views:	13
Size:	9.2 کلوبائٹ
ID:	12934155


                            • <a href="https://www.instaforex.org/ru/?x=ruforum">InstaForex</a>
                            • #15 Collapse

                              ABC Correction Pattern


                              The ABC correction pattern is a commonly observed corrective wave pattern in Elliott Wave Theory, which is used by traders to analyze and predict price movements in financial markets, including the forex market. The pattern is named after its three-wave structure, where each wave represents a different phase of the correction. Here's a breakdown of the ABC correction pattern:

                              1. Wave A: Wave A is the first phase of the correction and usually occurs after a significant uptrend (in the case of a bearish ABC correction) or downtrend (in the case of a bullish ABC correction). Wave A is characterized by a strong move against the prevailing trend, often accompanied by high trading volume. Traders may interpret this wave as a sign of market sentiment shifting and the beginning of a potential correction.

                              2. Wave B: Wave B is the corrective phase that follows Wave A. It represents a partial retracement of the initial move in the opposite direction. Wave B typically exhibits a weaker price movement compared to Wave A and may take the form of a consolidation or sideways pattern. However, Wave B should not exceed the starting point of Wave A, as this would invalidate the ABC correction pattern.

                              3. Wave C: Wave C is the final phase of the correction and is considered the most critical part of the pattern. It represents the resumption of the original trend, but in the opposite direction to Wave A. Wave C is often characterized by a strong and swift price movement that surpasses the end of Wave A. Traders may interpret this wave as a confirmation of the completion of the correction and a signal to enter trades in the direction of the prevailing trend.

                              Key Characteristics:
                              • The ABC correction pattern is a countertrend pattern that occurs within the context of a larger trend.
                              • Each wave within the pattern (A, B, and C) can be further subdivided into smaller waves according to Elliott Wave Theory's guidelines.
                              • The pattern can appear in various timeframes, from intraday charts to weekly or monthly charts, making it applicable for traders with different trading styles.
                              • Traders often use Fibonacci retracement levels, trendlines, and other technical analysis tools to identify and confirm ABC correction patterns.

                              Conclusion: The ABC correction pattern is a valuable tool for traders to identify potential correction phases within the broader market trends. By understanding the structure and characteristics of the pattern, traders can anticipate price movements, manage risk effectively, and make informed trading decisions in the forex market. However, it's essential to combine the ABC correction pattern with other technical analysis tools and indicators for confirmation and validation of trading signals.


                              منسلک شدہ فائلیں

                              اب آن لائن

                              Working...
                              X