What is Falling Wedge pattern:
X
  • وقت
  • دکھائیں
Clear All
new posts
  • #1 Collapse

    What is Falling Wedge pattern:
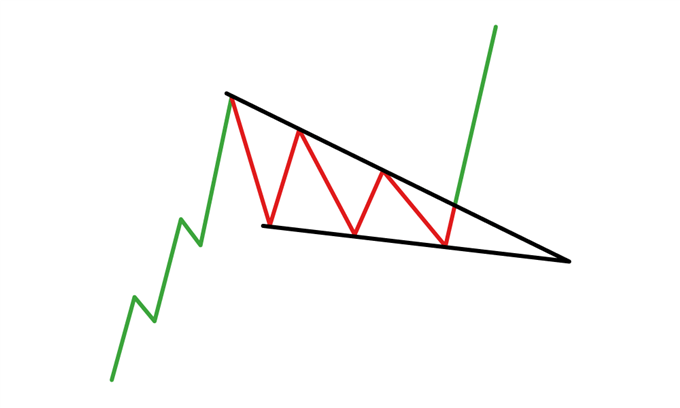
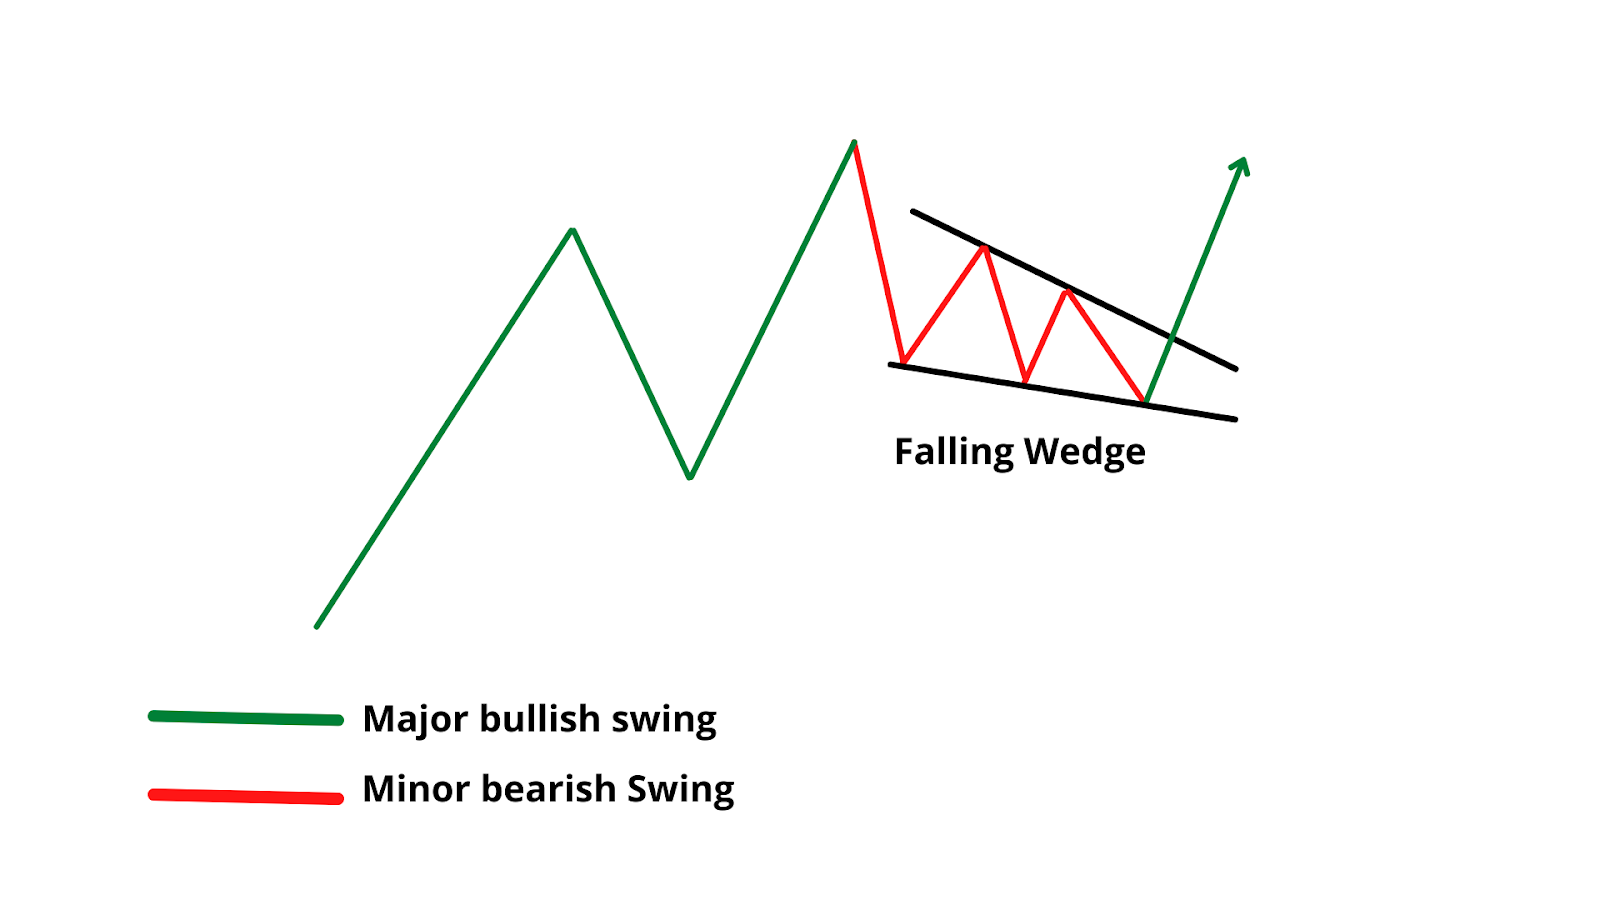
    DEFINITION OF THE FALLING WEDGE PATTERN :


    Forex trading mein, Falling Wedge Pattern hai jab price action do trendlines ke beech consolidate hoti hai, jisse ek neeche ki taraf mudne wala wedge shape banta hai. Upper trendline ek neeche ki aur slope wali resistance line hoti hai, jabki lower trendline ek tezi se oopar ki taraf slope wali support line hoti hai. Is pattern mein bechne wala dabav kam hota hai aur buyers apna control badha rahe hote hain, isliye ye ek bullish indication hai.

    Traders often Falling Wedge pattern ko ek potential bullish opportunity ke signal ke roop mein dekhte hain. Jab price upper trendline se bahar nikalti hai, to ye bullish trend aur long positions ke liye potential entry point ki tasdiq samjhi jati hai. Isko confirm karne ke liye breakout mein trading volume ka bhi badhna chahiye.


    CHARACTERISTICS AND FORMATION OF THE FALLING WEDGE PATTERN :


    Is pattern ka formation kuchh weeks se lekar kuchh months ka time period tak ho sakta hai, jisse timeframe par depend karta hai. Is dauran, price action trendlines ke beech consolidate hoti hai, jisse wedge shape ban jata hai.

    Ek characteristic of the Falling Wedge pattern yeh hai ki har successive high aur low kam hona chahiye. Isse pata chalta hai ki range narrow ho rahi hai aur selling pressure kam ho rahi hai. Upward sloping support line dikhata hai ki buyers dominant ho rahe hain aur gradual tarike se price ko upar push kar rahe hain.

    Falling Wedge pattern ki ek important characteristic hai ki volume pattern ke formation ke sath-sath kam hoti hai. Ye trader ki kam ruchi ya participation ka sanket hai aur breakout ka potential signal bhi ho sakta hai. Pattern ko analyze karte samay traders ko volume par dhyan dena chahiye, kyunki breakout ideally trading activity mein badhne ke sath hona chahiye.


    IMPORTANCE OF VOLUME CONFIRMATION IN THE FALLING WEDGE PATTERN :


    Jaisa ki pehle bhi kaha gaya hai, volume confirmation Falling Wedge pattern ko analyze karte samay dhyan dene ki zaroorat hai. Upper trendline se breakout hone par trading volume ka increase dekhna bahut zaroori hai.

    Volume traders ko breakout ki strength aur bullish move ke potential follow-through ka indication deta hai. High volume ke saath breakout strong buyers ki interest ka signal hai aur sustained uptrend ki probability ko badhata hai.

    Dusri taraf, agar breakout low volume par hota hai ya volume mein koi increase na ho, toh ye false breakout ya buyers ki conviction ki kami ka sanket ho sakta hai. Traders ko Falling Wedge pattern par base karke position lete samay volume confirmation ka intezar karna chahiye.


    TARGET AND STOP LEVELS IN THE FALLING WEDGE PATTERN :


    Falling Wedge pattern ko trade karte samay, target aur stop levels ke establish karna risk aur potential rewards manage karne ke liye zaroori hai.

    Target level usually breakout point se wedge pattern ki height ka measurement karke aur use breakout ki direction mein project karke determine kiya jata hai. Traders is measurement ko use karke profit targets set kar sakte hain aur trade se bahar nikal sakte hain jab price projected target tak pahunchti hai.

    Stop levels lower trendline ya recent swing low se neeche set kiye jana chahiye. Isse traders potential false breakouts aur reversals se protect ho sakte hain. Stop level ko bahut tight set karne se premature exits ho sakte hain, jabki bahut wide set karne se bade nuksan ka exposure ho sakta hai.


    TRADING STRATEGIES FOR THE FALLING WEDGE PATTERN :


    Falling Wedge pattern ko trade karte samay traders kuchh alag strategies use kar sakte hain. Ek strategy ye hai ki price upper trendline se breakout hone par long position le. Ismein confirmation ke liye trading volume ka increase hona chahiye. Traders profit targets set kar sakte hain wedge pattern ki projected height par aur stop ko lower trendline ya recent swing low ke neeche rakhsakte hain.

    Dusri strategy ye hai ki breakout level ki retest pe trade me enter hona. Kuch traders breakout level pe pullback ka wait karte hain, phir long position me enter hote hain. Isse trade ke success ke chances badh sakte hain aur risk-to-reward ratio bhi improve ho sakta hai. Lekin agar price significant pullback ke bina rally karti hai, to initial move miss karne ka risk hota hai.

    Overall, Falling Wedge pattern ek bullish chart pattern hai jo uptrend ka continuation signal karta hai. Traders ke liye mahatvapurna hai ki pattern ko caution se analyze kare aur volume se confirmation ka wait kare, phir position enter kare. Target aur stop levels establish karna trading ke risk aur potential rewards ko manage karne ke liye crucial hota hai jab is pattern ko trade kiya ja raha hai.
  • <a href="https://www.instaforex.org/ru/?x=ruforum">InstaForex</a>
  • #2 Collapse

    Falling Wedge pattern aik bullish reversal pattern hai jo market mein potential trend reversal ko indicate karta hai. Yeh pattern typically downtrend mein form hota hai aur yeh batata hai ke selling pressure dheere dheere kam ho raha hai aur buyers market mein wapas interest lena shuru kar rahe hain. Is pattern ko identify karna aur samajhna traders ke liye bohot important hai kyunki yeh bullish move ke start hone ka signal deta hai.


    Falling Wedge Pattern Ki Pehchan


    Falling Wedge pattern ka structure distinctive hota hai. Yeh pattern do converging trendlines se mil kar banta hai jo niche ki taraf slope karti hain. In trendlines ke beech price action confined hota hai aur yeh gradually converge hoti hain. Is pattern ki kuch khas pehchan yeh hain:
    1. Two Converging Trendlines:
      • Falling Wedge pattern do trendlines se mil kar banta hai. Upper trendline downward slope karti hai aur lower trendline bhi downward slope karti hai. Yeh dono trendlines converge hoti hain jaise jaise pattern progress karta hai.
    2. Decreasing Volume:
      • Pattern ke formation ke doran volume gradually decrease hoti hai jo selling pressure ke kam hone ko indicate karti hai. Yeh dikhata hai ke sellers ka interest dheere dheere kam ho raha hai.
    3. Lower Lows and Lower Highs:
      • Price lower lows aur lower highs banati hai jo pattern ke downward slope ko maintain karti hain. Lekin, price movement confined rehti hai aur eventually trendlines converge ho jati hain.
    Pattern Ki Construction


    Falling Wedge pattern ki construction aur formation ko detail mein samajhte hain:
    1. Upper Trendline:
      • Upper trendline ko form karne ke liye price ke lower highs ko connect karte hain. Yeh trendline downward slope karti hai aur resistance ke tor par act karti hai.
    2. Lower Trendline:
      • Lower trendline ko form karne ke liye price ke lower lows ko connect karte hain. Yeh trendline bhi downward slope karti hai aur support ke tor par act karti hai.
    3. Volume Analysis:
      • Pattern ke formation ke doran volume gradually decrease hoti hai. Volume ka decrease hona selling pressure ke kam hone ko indicate karta hai jo pattern ki strength ko enhance karta hai.
    4. Breakout:
      • Pattern complete hone par price upper trendline ko break karti hai. Yeh breakout bullish reversal ko confirm karta hai aur price ke upward move ko start karta hai.
    Falling Wedge Pattern Ka Matlab


    Falling Wedge pattern ke formation ka matlab hota hai ke market mein bullish reversal hone ke chances barh rahe hain. Yeh pattern ke kuch important aspects yeh hain:
    1. Bullish Reversal:
      • Falling Wedge pattern typically bullish reversal ka signal hota hai. Jab price upper trendline ko breakout karti hai, yeh buyers ke strong presence aur market mein bullish sentiment ko indicate karta hai.
    2. Decreasing Selling Pressure:
      • Pattern ke formation ke doran volume decrease hoti hai jo selling pressure ke kam hone ko indicate karti hai. Yeh batata hai ke sellers ka interest dheere dheere kam ho raha hai aur buyers ka interest barh raha hai.
    3. Potential Entry Point:
      • Falling Wedge pattern ke breakout point par buy position open karna ek effective strategy hoti hai. Yeh entry point bullish move ke start hone ka signal hota hai aur price ke upward move ko capture karne ka moka deta hai.
    Falling Wedge Pattern Ka Use


    Falling Wedge pattern ko effectively use karne ke liye traders ko isko context aur confirmation signals ke sath analyze karna chahiye. Is pattern ko identify karne aur use karne ke kuch tips yeh hain:
    1. Trend Analysis:
      • Falling Wedge pattern ka best use tab hota hai jab yeh downtrend ke baad form hota hai. Aise mein yeh pattern bullish reversal ka signal hota hai. Uptrend ke doran yeh pattern kabhi kabar continuation pattern bhi ho sakta hai.
    2. Confirmation:
      • Falling Wedge pattern ko kabhi bhi akela use nahi karna chahiye. Is pattern ke baad confirmation signals ka wait karna zaroori hai. Confirmation candles jo strong bullish move ko dikhati hain, yeh pattern ke validity ko confirm karti hain.
    3. Volume Analysis:
      • Volume analysis ko include karna bhi zaroori hai. Falling Wedge pattern ke formation ke doran agar volume decrease ho, to yeh pattern ki reliability ko enhance karta hai. High volume breakout ke doran buyers ke strong presence ko indicate karta hai.


    Limitations


    Har technical pattern ki tarah, Falling Wedge pattern ke bhi kuch limitations aur considerations hain jo traders ko yaad rakhni chahiye:
    1. False Signals:
      • Falling Wedge pattern kabhi kabar false signals bhi de sakta hai, especially agar market mein low volume ho ya pattern form hone ke baad confirmation nahi milta. Isliye hamesha confirmation signals ka wait karna zaroori hai.
    2. Market Conditions:
      • Yeh pattern trending markets mein zyada effective hota hai. Ranging ya sideways markets mein iski reliability kam ho sakti hai. Market conditions ko analyze karte hue pattern ka use karna chahiye.
    3. Combination with Other Indicators:
      • Falling Wedge pattern ko doosre technical indicators ke sath combine karke use karna chahiye. Indicators jaise ke Relative Strength Index , Moving Averages, aur Support/Resistance levels ko include karna pattern ki accuracy ko enhance kar sakta hai.

    Falling Wedge pattern aik powerful aur important tool hai jo traders ko market ke potential bullish reversals ko identify karne mein madadgar hota hai. Yeh pattern do converging trendlines se mil kar banta hai jo niche ki taraf slope karti hain aur volume ke decrease hone ko indicate karti hain. Falling Wedge pattern typically bullish reversal ka signal hota hai, lekin isko context aur confirmation signals ke sath analyze karna zaroori hai. Traders ko is pattern ko identify karte waqt trend analysis, confirmation candles, aur volume analysis ko consider karna chahiye taake is pattern ka effectively use kar sakein. Har pattern ki tarah, Falling Wedge ke bhi kuch limitations hain, lekin isko doosre technical indicators ke sath combine karke traders apne trading decisions ko better aur accurate bana sakte hain.
    • #3 Collapse

      A Falling Wedge pattern is a technical analysis chart pattern characterized by a series of lower highs and lower lows that ultimately narrows as the price moves lower. It is formed by two converging trend lines sloping downward, where the upper trend line (resistance line) is steeper than the lower trend line (support line).
      Key features of a Falling Wedge pattern include:

      1. **Slope of Trend Lines**: Both the upper (resistance) and lower (support) trend lines slope downward, but the resistance line typically has a steeper slope than the support line.

      2. **Converging Lines**: The price oscillates between these two trend lines, creating a narrowing price range over time.

      3. **Volume**: During the formation of the Falling Wedge, trading volume often diminishes. However, towards the end of the pattern, there may be an increase in volume as the price nears the apex.

      4. **Breakout**: The pattern is typically considered bullish. A breakout above the upper trend line (resistance line) is seen as a potential buy signal, indicating a possible reversal or continuation of the prior uptrend.

      Traders and analysts use Falling Wedge patterns to anticipate potential bullish price movements. It's important to wait for confirmation with a breakout above the upper trend line and consider other technical indicators to validate the pattern's signal.
      • #4 Collapse

        Falling Wedge Pattern in Forex Trading


        Falling Wedge Pattern ek bullish reversal pattern hai jo price chart par form hota hai jab price downward trend mein ho. Yeh pattern indicate karta hai ke current downtrend khatam hone wala hai aur bullish trend shuru hone wali hai.
        Structure of Falling Wedge Pattern
        1. Converging Trendlines: Falling wedge do downward sloping trendlines se milke banta hai jo converge kar rahi hoti hain. Upper trendline highs ko connect karti hai aur lower trendline lows ko.
        2. Decreasing Volume: Jaise price wedge ke andar move karti hai, volume bhi decrease hota jata hai. Yeh indicate karta hai ke selling pressure kam ho raha hai.
        3. Breakout: Jab price upper trendline ko break karti hai, woh bullish breakout ka signal hota hai. Is breakout ke baad volume barhna chahiye taake move ko confirm kiya ja sake.
        Identification of Falling Wedge Pattern
        • Trendlines: Do trendlines draw karo; ek upper trendline jo lower highs ko connect kare aur ek lower trendline jo lower lows ko connect kare.
        • Convergence: Trendlines ek dusre ke qareeb aati hain, forming a narrowing pattern.
        • Breakout Point: Jab price upper trendline ko cross kar jati hai, woh breakout ka point hota hai.
        Trading the Falling Wedge Pattern
        1. Entry Point: Upper trendline ke breakout point par buy position open karo. Ensure karo ke breakout strong ho aur volume increase ho.
        2. Stop Loss: Lower trendline ke neeche stop-loss place karo taake risk manage ho sake.
        3. Profit Target: Previous high ya nearest resistance level ko profit target set karo.
        Example


        Suppose EUR/USD pair downward trend mein hai aur ek falling wedge pattern form kar rahi hai. Price multiple times lower highs aur lower lows create karti hai, aur trendlines converge karti hain. Finally, price upper trendline ko break karti hai with increased volume. Yeh signal hai ke downtrend khatam ho gaya aur ek bullish trend shuru hone wala hai.
        Conclusion


        Falling Wedge Pattern ek powerful bullish reversal signal hai jo traders ko downtrend ke end aur uptrend ke start ko identify karne mein madad karta hai. Proper trendline analysis, volume confirmation, aur risk management strategies se traders is pattern se profitably trade kar sakte hain.

        For further details, you can refer to these resources:
        • Investopedia on Falling Wedge
        • TradingView on Wedge Patterns
        Additional Options

        Pattern Variations
        1. Rising Wedge: Yeh pattern opposite hai falling wedge ka aur ek bearish reversal pattern hai. Jab price upward trend mein ho aur converging trendlines form kare, rising wedge indicate karta hai ke uptrend khatam hone wala hai aur bearish trend shuru ho sakta hai.
        2. Symmetrical Triangle: Yeh pattern jab form hota hai jab price range bound hoti hai aur ek contracting triangle form karti hai. Yeh pattern continuation aur reversal dono indicate kar sakta hai, depending on breakout direction.
        Indicators to Confirm the Pattern
        1. Volume Analysis: Falling wedge breakout ko confirm karne ke liye, volume increase hona chahiye. High volume breakout indicate karta hai ke bullish momentum strong hai.
        2. Moving Averages: Moving averages (like 50-day or 200-day MA) ko use karke trend direction aur strength ko confirm kiya ja sakta hai. Jab price moving average ko cross kare, yeh additional confirmation provide karta hai.
        3. Relative Strength Index (RSI): RSI ko use karke overbought ya oversold conditions identify ki ja sakti hain. Falling wedge breakout ke time RSI bullish divergence bhi indicate kar sakta hai.
        Trading Strategies
        1. Multiple Timeframe Analysis: Different timeframes (like 1-hour, 4-hour, daily) ko analyze karna useful hota hai taake pattern confirmation aur trade entry ke liye better decision liya ja sake.
        2. Combination with Other Patterns: Falling wedge ko dusre patterns ke sath combine kar sakte hain jaise double bottom ya head and shoulders taake stronger signals milein.
        3. Risk-Reward Ratio: Trade planning karte waqt, risk-reward ratio ko consider karo. Proper ratio maintain karke potential gains maximize aur losses minimize kiye ja sakte hain.

        By integrating these additional techniques and considerations, traders can enhance their understanding and execution of the falling wedge pattern in forex trading.


        4o
        • #5 Collapse

          What is Falling Wedge pattern?

          Falling Wedge pattern ek technical analysis ka tool hai jo stock market mein traders aur investors ke liye future price movements ko predict karne mein madad karta hai. Ye pattern typically bullish reversal signal ke taur par dekha jata hai, matlab ke agar ye pattern form ho raha hai, to price downtrend ke baad uptrend mein convert ho sakti hai.

          Falling Wedge pattern do sloping trendlines se milkar banta hai. Upper trendline downward sloping hoti hai jo ke series of lower highs ko connect karti hai, jabke lower trendline bhi downward sloping hoti hai jo ke series of lower lows ko connect karti hai. Yeh donon trendlines ek dusre ke qareeb aati hain, aur pattern ka width kam hota chala jata hai.

          Pattern tab complete hota hai jab price upper trendline ko break karti hai aur uske baad uptrend shuru hota hai. Yani ke, jaise hi price upper trendline ke upar close hoti hai, ye bullish signal hota hai aur traders is waqt stock kharidne ka sochte hain.

          Falling Wedge pattern typically do scenarios mein form hota hai. Pehla, downtrend ke baad, jo ke bottom reversal ka signal deta hai. Doosra, uptrend ke during, jo ke continuation pattern ka signal hota hai, matlab ke price temporary dip ke baad firse uptrend ko continue karegi.

          Pattern ka reliability increase ho jati hai agar trading volume bhi support karta hai. Agar volume bhi increase hota hai jab price upper trendline ko break karti hai, to bullish reversal ke chances zyada hote hain.

          Yeh pattern identify karne ke liye kuch important points yeh hain:
          1. Donon trendlines downward sloping honi chahiye.
          2. Pattern ka duration usually few weeks se le kar several months tak ho sakta hai.
          3. Upper trendline ka break hona chahiye taake bullish signal confirm ho sake.

          Falling Wedge pattern ko understand karna aur use karna traders ke liye beneficial ho sakta hai kyunki yeh unko market ke turning points identify karne mein madad karta hai. Lekin, jaise har technical indicator ke sath hota hai, isko bhi dusre indicators aur market analysis ke sath combine karna zaroori hota hai taake false signals ko avoid kiya ja sake.

          In conclusion, Falling Wedge pattern ek valuable tool hai technical analysis mein, jo ke traders ko potential buying opportunities identify karne mein madad karta hai, especially jab market ek downtrend se uptrend mein convert hone wala hota hai.
          • #6 Collapse

            What is Falling Wedge pattern?

            Falling Wedge pattern aik technical analysis chart pattern hai jo financial markets mein use hota hai, khaaskar stock or forex trading mein. Ye pattern bullish reversal signal hota hai, iska matlab ye hai ke ye downtrend ke baad market ke uptrend ki taraf move hone ka indication deta hai.

            Falling Wedge pattern tab banta hai jab price action gradually contract ho raha hota hai, jani lower highs aur lower lows bana raha hota hai. Ye do converging trend lines se mil kar banta hai: ek upper trend line jo lower highs ko connect karti hai aur ek lower trend line jo lower lows ko connect karti hai. Ye dono trend lines neeche ki taraf slant hoti hain lekin upper trend line ki slope lower trend line ki slope se zyada steep hoti hai.

            Is pattern ka formation is tarah hota hai:
            1. Downtrend: Pehle ek clear downtrend hota hai.
            2. Contracting Price Range: Price gradually contract hoti hai aur wedge shape banta hai.
            3. Volume Decrease: Is dauran trading volume bhi kam hota jata hai, jo price contraction ke sath coincide karta hai.
            4. Breakout: Jab price upper trend line ko breach karti hai, tab pattern complete hota hai aur breakout confirm hota hai. Breakout ke baad, volume mein aksar significant increase hota hai, jo bullish momentum ko support karta hai.

            Falling Wedge pattern ko samajhne ke liye kuch key points dhyan mein rakhna zaroori hai:
            • Duration: Ye pattern kuch weeks se lekar kuch months tak ka time le sakta hai.
            • Volume: Volume contraction aur phir breakout ke time volume ka increase important confirmation signals hain.
            • Confirmation: Sirf trend lines break hone se breakout confirm nahi hota, volume aur price action ko bhi consider karna zaroori hai.

            Traders aksar is pattern ko potential buying opportunity ke tor par dekhte hain. Jab Falling Wedge pattern complete hota hai aur breakout hota hai, traders long positions enter karte hain, anticipating ke market ab uptrend mein move karega. Stop-loss orders upper trend line ke neeche place kiye jate hain taake downside risk ko minimize kiya ja sake.

            Ye pattern natural market corrections ke baad bhi dekhne ko milta hai, jab investors aur traders cautiously buy karte hain. Ye gradual buying pressure eventually breakout ki taraf lead karta hai.

            Summing up, Falling Wedge pattern ek useful tool hai jo traders ko downtrend ke baad potential reversal points identify karne mein madad karta hai. Iska accurate interpretation aur timely action financial success ke liye critical hai.
            • #7 Collapse

              What is Falling Wedge pattern?

              Falling Wedge pattern aik chart pattern hai jo technical analysis mein istemal hota hai. Yeh pattern typically bullish reversal ka signal hota hai, lekin kabhi kabhi yeh continuation pattern bhi ho sakta hai.

              Falling Wedge pattern tab banta hai jab price ek slope ke sath neeche ja rahi hoti hai aur dono upper aur lower trend lines converge karti hain. Yeh pattern usually tab form hota hai jab market consolidation phase mein hota hai, yani buyers aur sellers ka equilibrium hota hai, lekin dheere dheere buyers ka pressure barh raha hota hai.

              Is pattern ko samajhne ke liye, humein do trend lines draw karni padti hain. Pehli trend line, jo upper trend line kehlati hai, price ke lower highs ko connect karti hai. Dusri trend line, jo lower trend line kehlati hai, price ke lower lows ko connect karti hai. Dono lines neeche ja rahi hoti hain lekin ek point par converge karti hain.

              Falling Wedge pattern mein jab price upper trend line ko break karti hai, to yeh ek bullish signal hota hai aur yeh indicate karta hai ke price further uptrend mein ja sakti hai. Is breakout ke baad, investors aksar buying start kar dete hain, jo price ko aur bhi upar le jata hai.

              Pattern ko confirm karne ke liye volume ka dekhna bhi zaroori hai. Usually, pattern ke formation ke dauran volume decrease hoti hai lekin breakout ke waqt volume mein significant increase hota hai. Yeh increase volume confirmation deta hai ke trend reversal ho raha hai.

              Yeh pattern stocks, forex, commodities aur cryptocurrency markets mein equally effective hota hai. Falling Wedge pattern ka size aur duration vary kar sakti hai. Yeh kuch dinon se lekar kuch hafton tak bhi chal sakta hai.

              Is pattern ko successfully trade karne ke liye, risk management techniques ka istemal karna zaroori hai. Stop loss levels ko identify karna aur set karna chahiye taa ke potential losses ko minimize kiya ja sake. Profit targets ko bhi define karna zaroori hai taa ke pata ho ke kab exit karna hai.

              Summarize karte hue, Falling Wedge pattern ek valuable tool hai technical analysts aur traders ke liye. Yeh pattern bullish reversal ka strong signal de sakta hai agar sahi tareeke se identify aur trade kiya jaye. Is pattern ko effectively use karne ke liye, chart analysis ke sath-sath volume ka bhi dhyaan rakhna zaroori hai aur risk management techniques ko implement karna bhi equally important hai.
              • #8 Collapse

                What is Falling Wedge Pattern


                Falling wedge pattern aik bullish reversal pattern hai jo technical analysis mein use hota hai. Ye pattern usually downtrend ke end par banta hai aur indicate karta hai ke price ab reverse hokar upar jaane wali hai. Falling wedge pattern do converging trendlines se banta hai jo dono neeche ki taraf slope karti hain. Yeh trendlines higher highs aur lower lows ko connect karti hain, is tarah ke ek narrowing structure banta hai.

                **Pattern Ki Pehchaan:**

                1. **Trendlines:** Do trendlines hoti hain. Upper trendline downward slope karti hai aur lower trendline bhi downward slope karti hai, magar ye dono converge hoti hain.
                2. **Volume:** Volume kehtay hain ke price movement ka measure hota hai. Falling wedge mein, volume initial phase mein high hota hai magar jaise jaise pattern develop hota hai, volume decrease hoti jati hai.
                3. **Duration:** Ye pattern kuch weeks se lekar kuch months tak develop ho sakta hai. Iska time frame depend karta hai market aur asset par.

                **Formation:**

                Falling wedge tab banta hai jab price consistently lower highs aur lower lows banati hai. Is dauraan, price gradually ek narrow range mein move karti hai. Jab price lower trendline ko touch karti hai aur wapas upper trendline ki taraf move karti hai, to ye indicate karta hai ke buyers strength gain kar rahe hain aur sellers weak ho rahe hain.

                **Breakout:**

                Is pattern ka breakout tab hota hai jab price upper trendline ko breach karti hai. Breakout ke baad, volume usually increase hoti hai jo confirmation deta hai ke reversal trend ab start ho gaya hai. Is waqt, traders often long positions lete hain kyun ke expectation hoti hai ke price upward direction mein move karegi.

                **Falling Wedge Pattern Trading Strategy:**

                1. **Identification:** Sabse pehle pattern ko identify karo. Confirm karo ke price lower highs aur lower lows bana rahi hai aur converging trendlines ke beech move kar rahi hai.
                2. **Wait for Breakout:** Upper trendline ke breakout ka intezar karo. Breakout ke saath volume increase hona chahiye.
                3. **Entry Point:** Jab price upper trendline ko break kare aur volume increase ho, to ye ek achi entry point hoti hai.
                4. **Stop Loss:** Stop loss lower trendline ke neeche set karo. Yeh is liye zaroori hai ke agar pattern fail ho jaye to loss limited ho.
                5. **Target Price:** Target price ko measure karne ke liye pattern ki height ko measure karo aur breakout point par add karo.

                **Example:**

                Misaal ke taur par, agar ek stock $50 se $30 tak gir raha hai aur falling wedge pattern ban raha hai, to upper trendline $50 se start hokar lower highs ko touch karte hue neeche ki taraf slope karegi. Lower trendline $30 se start hokar lower lows ko touch karte hue neeche ki taraf slope karegi. Jab price $40 par upper trendline ko break karte hue upar move karegi aur volume bhi increase hogi, to ye breakout hoga. Is waqt ek trader buy kar sakta hai aur target price ko $50 par set kar sakta hai.

                **Conclusion:**

                Falling wedge pattern ek powerful bullish reversal signal hai. Iska sahi tareeke se use karna traders ko profit generate karne mein madad de sakta hai. Magar, is pattern ko samajhne ke liye practice aur experience zaroori hai. Risk management aur proper analysis ke saath, falling wedge pattern trading mein valuable tool sabit ho sakta hai.
                • #9 Collapse

                  What is Falling Wedge pattern:
                  Click image for larger version

Name:	Falling_Wedge_Continuation_Patterns.png
Views:	20
Size:	93.4 کلوبائٹ
ID:	13013401
                  What is Falling Wedge pattern:
                  The falling wedge pattern is a bullish chart pattern that signals future upward momentum. Here's a concise explanation:

                  ## What is a Falling Wedge Pattern?

                  A falling wedge pattern is formed when the price bounces between two downward sloping, converging trendlines. It is considered a bullish continuation pattern, as it typically appears within an uptrend and indicates the uptrend will resume after a consolidation period.[1][2][3]

                  ## Identifying a Falling Wedge Pattern

                  To identify a falling wedge pattern:

                  ### 1. Identify an Uptrend
                  The falling wedge is a bullish continuation pattern, so it must appear within an existing uptrend.[2][3]

                  ### 2. Draw Converging Trendlines
                  Connect the lower highs and lower lows with two downward sloping, converging trendlines.[1][2][3]

                  ### 3. Look for Bullish Divergence
                  Check for bullish divergence between the price and an oscillator like RSI or stochastics, indicating waning downward momentum.[2]

                  ### 4. Confirm Breakout
                  Wait for the price to break above the upper trendline of the wedge, signaling the resumption of the uptrend.[1][2][3]

                  ## Trading the Falling Wedge Pattern

                  1. Continuation Pattern: If the falling wedge appears in an uptrend, it signals the uptrend will continue after the consolidation.[2]

                  2. Reversal Pattern: If the falling wedge appears in a downtrend, it signals a potential bullish reversal.[2][3]

                  Traders can use a measured move technique to set price targets by projecting the height of the wedge above the breakout point.[2] Stop losses can be placed below the lowest point of the wedge.[2][3]

                  The falling wedge is a reliable bullish pattern that traders can use to identify potential opportunities in uptrending markets.[1][2][3]

                  Citations:
                  [1] Wedge Meaning In Urdu | Pachar پچر | English to Urdu Dictionary https://www.urdupoint.com/dictionary...rdu/96814.html
                  [2] Trading the Falling Wedge Pattern - DailyFX https://www.dailyfx.com/education/te...ing-wedge.html
                  [3] What Is a Wedge and What Are Falling and Rising Wedge Patterns? https://www.investopedia.com/terms/w/wedge.asp

                  • <a href="https://www.instaforex.org/ru/?x=ruforum">InstaForex</a>
                  • #10 Collapse

                    ### Falling Wedge Pattern Kya Hai?
                    Agar aap stock market mein trading karte hain ya trading sikhna chahte hain, to aapko "Falling Wedge Pattern" ke baare mein zaroor maloom hona chahiye. Ye ek bullish reversal pattern hai jo usually price downtrend ke baad banta hai aur is se price ka upar jana indicate hota hai.

                    #### Falling Wedge Pattern ki Pehchaan:

                    Falling Wedge Pattern tab banta hai jab price ek narrowed down range mein move kar rahi hoti hai aur higher highs aur higher lows bante hain. Is pattern ki main khasiyat ye hai ke do converging trendlines banti hain. Upper trendline jo ke lower highs ko connect karti hai aur lower trendline jo ke lower lows ko connect karti hai. Yeh dono trendlines ultimately converge hoti hain aur ek wedge ka shape banati hain.

                    #### Pattern ka Formation:

                    1. **Downtrend**: Pehle ek strong downtrend hota hai jo market ko neeche lekar aata hai.
                    2. **Converging Trendlines**: Phir price range gradually choti hoti jati hai aur dono trendlines converge hoti hain.
                    3. **Volume**: Is period mein volume bhi kam hoti jati hai jo pattern ko aur strong banata hai.
                    4. **Breakout**: Jab price upper trendline ko break karti hai to is se ek bullish breakout ka signal milta hai. Is waqt volume ka increase hona bhi zaroori hai taake breakout ki confirmation ho sake.

                    #### Importance of Falling Wedge Pattern:

                    Falling Wedge Pattern traders ke liye kaafi useful hota hai kyunki ye ek strong bullish reversal ka signal hota hai. Is pattern ko samajhne aur use karne se traders ko ache profit margins mil sakte hain. Yad rahe ke is pattern ki success ke liye proper analysis aur confirmation signals ka hona zaroori hai.

                    #### Risk Management:

                    Jaise har trading strategy mein, yahan bhi risk management zaroori hai. Agar breakout confirm na ho ya price waapas wedge ke andar aa jaye to stop-loss levels ka set hona zaroori hai. Is se traders apni investment ko unnecessary losses se bacha sakte hain.

                    #### Conclusion:

                    Falling Wedge Pattern ek powerful tool hai jo traders ko market ke trend reversals ko identify karne mein madad karta hai. Proper analysis aur risk management ke sath, ye pattern trading mein significant profits la sakta hai. Trading karte waqt hamesha yaad rakhen ke market unpredictable hai, is liye har step ko soch samajh kar lena chahiye.

                    Agar aapko trading mein naya ho to ye pattern zaroor seekhein aur practice karen. Kam volume aur narrowing range ko pehchaan kar aap is pattern se kaafi fayda utha sakte hain.

                    اب آن لائن

                    Working...
                    X