INTRODUCTION TO THE TRIPLE BOTTOM PATTERN :
Triple Bottom Pattern ek bullish reversal pattern hai jo forex charts ki technical analysis mein aata hai. Ye pattern generally downtrend ke baad banta hai aur ek trend reversal ka sanket deta hai. Pattern me teen consecutive troughs hote hai, jisme har trough lagbhag same level par hota hai, jiske baad resistance level se breakout hota hai. Is pattern se ye samjha jaata hai ki selling pressure exhaust ho chuki hai aur buyers prices ko higher push kar rahe hai.
IDENTIFYING THE TRIPLE BOTTOM PATTERN :
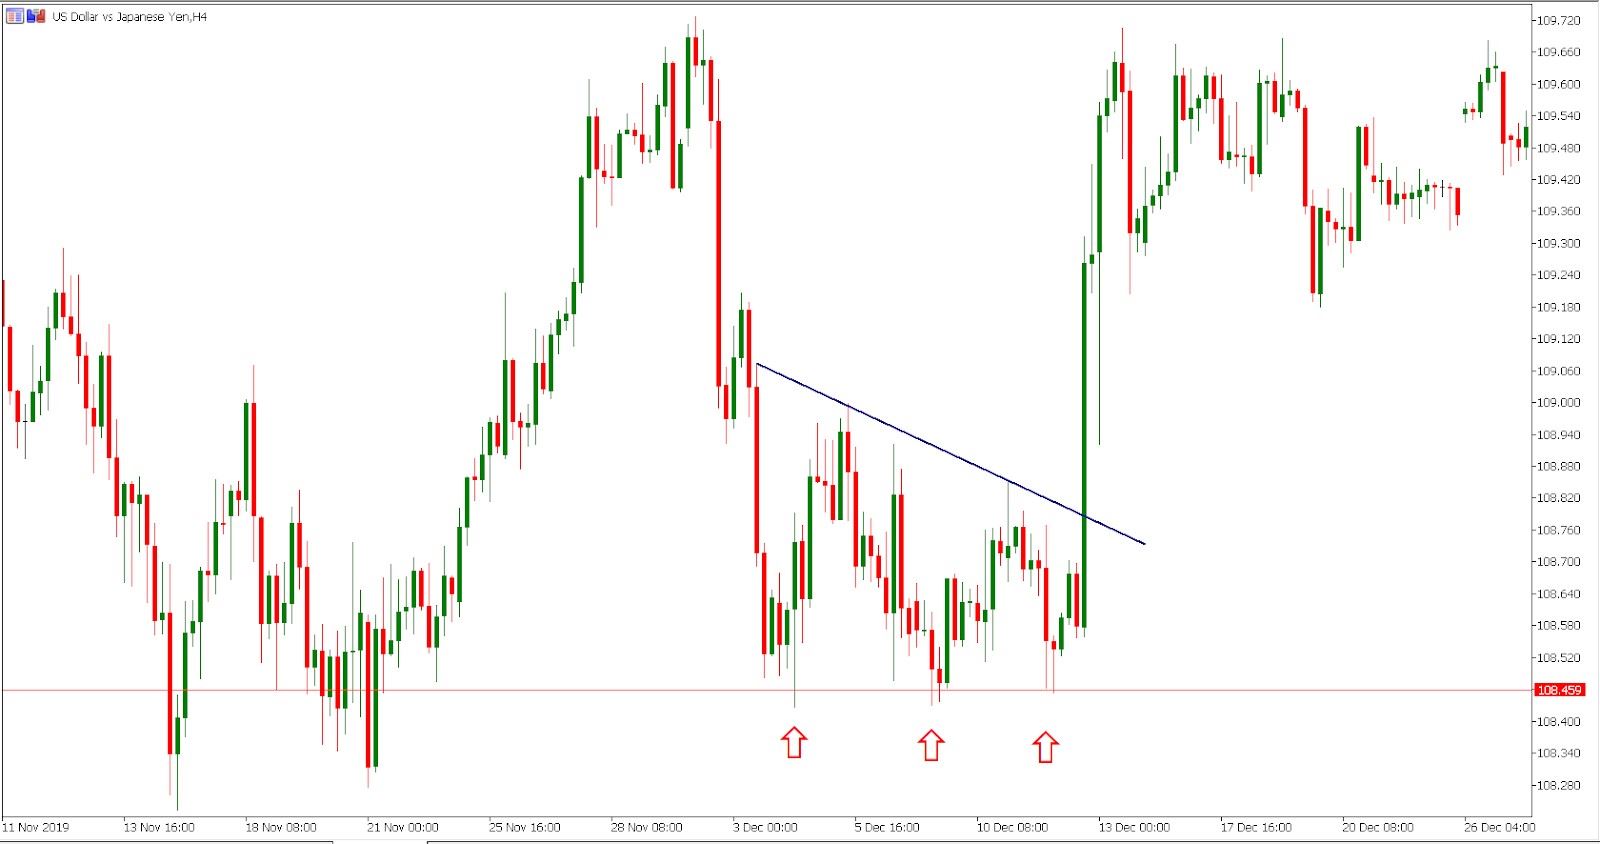
Triple Bottom Pattern ko pehchanne ke liye, traders ko sabse pehle price action me ek lambe samay tak downtrend observe karna hota hai. Isse pata chalta hai ki sellers control mein hai aur prices ko lower drive kar rahe hai. Is phase me teen alag alag troughs banne chahiye, jisme doosra trough sabse niche hona chahiye. Har trough ideally same level par ya ek chote range ke andar hona chahiye. Pattern ko confirm karne ke liye, troughs ke beech wale peaks se bane resistance level se breakout hona zaruri hai.
CONFIRMATION OF THE TRIPLE BOTTOM PATTERN :
Triple Bottom Pattern ko pehchanne ke baad, iski tasdeek karna trading actions lene se pehle important hai. Traders is pattern ki tasdeek ke liye kuch indicators ko dekhte hai, jaise ki breakout ke waqt trading volume ka increase hona, breakout ke baad price ka significant upward move hona, aur resistance-turned-support level ka subsequent retest hona. Jitna zyada trading volume breakout ke waqt ho, utna hi strong potential trend reversal ka signal hota hai.
TRADING STRATEGIES USING THE TRIPLE BOTTOM PATTERN :
Traders Triple Bottom Pattern ka istemal karke trading strategies develop kar sakte hai aur potential bullish reversals ka fayda utha sakte hai. Jab pattern confirm ho jaaye, traders long position enter karne ka soch sakte hai, last confirmed trough ke neeche stop loss rakh kar aur target profit level ko measured move ya previous resistance level ke base par set kar sakte hai. Risk ko effectively manage karna aur reversal har baar successful nahi hota, isliye trade chase karne se bachna zaruri hai.
LIMITATIONS OF THE TRIPLE BOTTOM PATTERN :
Triple Bottom Pattern reliable trend reversal signal ho sakta hai, lekin ye foolproof nahi hai aur false signals bhi de sakta hai. Traders ko potential fake breakouts ka dhyan rakhna chahiye aur additional technical indicators ya confirmation signals ka istemal karne ka soch sakte hai successful trade ki probability ko increase karne ke liye. Pattern ki tasdeek ka intezaar karna aur bekaar ke nuksaan se bachne ke liye trading actions lene se pehle sabar rakhna zaruri hai.
Antim mei, Triple Bottom Pattern forex technical analysis me ek powerful tool hai jo potential trend reversal indicate kar sakta hai. Traders ko pattern ko sahi tarah se pehchan aur alag alag indicators ka istemal karke uski tasdeek karna zaruri hai. Proper risk management implement karna aur additional technical analysis tools consider karna trading strategies using this pattern ki effectiveness ko enhance karne mei madadgar ho sakte hai.
Triple Bottom Pattern ek bullish reversal pattern hai jo forex charts ki technical analysis mein aata hai. Ye pattern generally downtrend ke baad banta hai aur ek trend reversal ka sanket deta hai. Pattern me teen consecutive troughs hote hai, jisme har trough lagbhag same level par hota hai, jiske baad resistance level se breakout hota hai. Is pattern se ye samjha jaata hai ki selling pressure exhaust ho chuki hai aur buyers prices ko higher push kar rahe hai.
IDENTIFYING THE TRIPLE BOTTOM PATTERN :
Triple Bottom Pattern ko pehchanne ke liye, traders ko sabse pehle price action me ek lambe samay tak downtrend observe karna hota hai. Isse pata chalta hai ki sellers control mein hai aur prices ko lower drive kar rahe hai. Is phase me teen alag alag troughs banne chahiye, jisme doosra trough sabse niche hona chahiye. Har trough ideally same level par ya ek chote range ke andar hona chahiye. Pattern ko confirm karne ke liye, troughs ke beech wale peaks se bane resistance level se breakout hona zaruri hai.
CONFIRMATION OF THE TRIPLE BOTTOM PATTERN :
Triple Bottom Pattern ko pehchanne ke baad, iski tasdeek karna trading actions lene se pehle important hai. Traders is pattern ki tasdeek ke liye kuch indicators ko dekhte hai, jaise ki breakout ke waqt trading volume ka increase hona, breakout ke baad price ka significant upward move hona, aur resistance-turned-support level ka subsequent retest hona. Jitna zyada trading volume breakout ke waqt ho, utna hi strong potential trend reversal ka signal hota hai.
TRADING STRATEGIES USING THE TRIPLE BOTTOM PATTERN :
Traders Triple Bottom Pattern ka istemal karke trading strategies develop kar sakte hai aur potential bullish reversals ka fayda utha sakte hai. Jab pattern confirm ho jaaye, traders long position enter karne ka soch sakte hai, last confirmed trough ke neeche stop loss rakh kar aur target profit level ko measured move ya previous resistance level ke base par set kar sakte hai. Risk ko effectively manage karna aur reversal har baar successful nahi hota, isliye trade chase karne se bachna zaruri hai.
LIMITATIONS OF THE TRIPLE BOTTOM PATTERN :
Triple Bottom Pattern reliable trend reversal signal ho sakta hai, lekin ye foolproof nahi hai aur false signals bhi de sakta hai. Traders ko potential fake breakouts ka dhyan rakhna chahiye aur additional technical indicators ya confirmation signals ka istemal karne ka soch sakte hai successful trade ki probability ko increase karne ke liye. Pattern ki tasdeek ka intezaar karna aur bekaar ke nuksaan se bachne ke liye trading actions lene se pehle sabar rakhna zaruri hai.
Antim mei, Triple Bottom Pattern forex technical analysis me ek powerful tool hai jo potential trend reversal indicate kar sakta hai. Traders ko pattern ko sahi tarah se pehchan aur alag alag indicators ka istemal karke uski tasdeek karna zaruri hai. Proper risk management implement karna aur additional technical analysis tools consider karna trading strategies using this pattern ki effectiveness ko enhance karne mei madadgar ho sakte hai.
تبصرہ
Расширенный режим Обычный режим