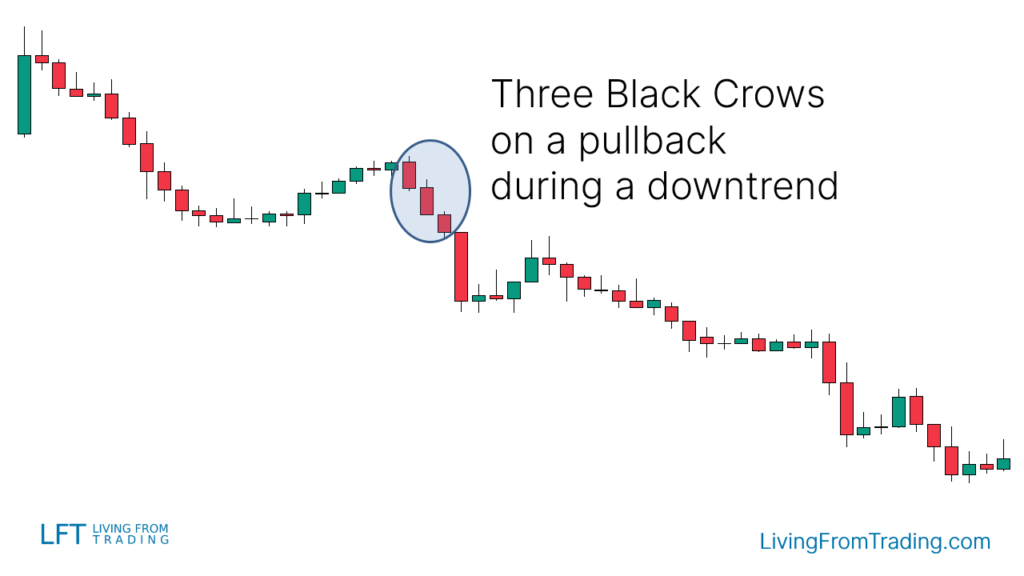
Three Black Crow candlestick pattern
X
  • وقت
  • دکھائیں
Clear All
new posts
  • #1 Collapse

    Three Black Crow candlestick pattern

    Three Black Crow candlestick pattern

    Three black crow kai pattern ki tashree kaise ki jati hai three black crow kai pattern mein har aik candle pahle ki nisbat kam hoti hai bulls ki keemat ko wapis lana bulls ka fawaid ko reverse karna ka liya aik jarana ikdam ki nisandahe karta hai pattern nicha kai wakfa kai sath kul sakta hai dosri aur third candles mein taqreeban aik hi size ka barah jisam hona chahiya is ko itemad pattern samjha jata hai astamal krnay ka msale treqh degr tkneke asharay say tsdeq kay leay aek asharh hay۔ ten kalay koon ka petrn ktna achhe trh say zahr hota hay as ka as pr ahm asr prrta hay kh aek tajr ko as pr ktna aatmad ho skta hay۔ maqol hd tk lmbay jsmon kay sath msale mnde oale mom btean jo mdt kay leay km qemt pr ya as kay qreb hote hen ten kalay koّon ke shkl akhtear kren۔ ya، dosray treqay say، shma dan men lmbay، asle jsm aor chhotay، ya nhen، sae'ay honay chahe'en۔ agr sae'ay lmbay ho rhay hen، to yh teze aor mnde ke rftar men aek lmhate tbdele ho skte hay as say phlay kh ap trend dobarh shroa ho jaey hree Black Crow candlestick pattern ki judgement kay liye trader ko bahot experience ki zaroorat hoti hea kyn kay is pattern ki development main market ki volatility bahot aihm factors considered kia ja sakta hea friends is kee candlesticks kee technical shape kuch is tarha hoti hea kay Pahle candle long real body bullish candle banti hai aur 2nd candle long real body bearish candle banti hai jo kay gap up ke sath open hoti hai aur is patton mein Main third candle second candle ki real body mein say open hoti hai aur is ka close first candle se niche hona chahie aur is patton mein fourth candle third candle kay real body mein say open hoti hai.
    example tor par koi saya nhi ya zahir karta hai kah reach section kam ka qareeb keemat rakhna ka qabil hai
  • <a href="https://www.instaforex.org/ru/?x=ruforum">InstaForex</a>
  • #2 Collapse

    Three Black Crow candlestick pattern


    Click image for larger version

Name:	download - 2023-11-28T193907.544.jpeg
Views:	61
Size:	10.5 کلوبائٹ
ID:	12784242

    "Three Black Crows" ek bearish reversal candlestick pattern hai, jo market analysis mein istemal hota hai. Ye pattern market mein uptrend ke baad aata hai aur bearish reversal ko indicate karta hai. "Three Black Crows" ka formation jab hota hai, to ye ek potential trend reversal ka signal deta hai.

    Three Black Crows Candlestick Pattern Ki Tafseelat:
    1. Formation:
      • "Three Black Crows" pattern tab banta hai jab teenday consecutive sessions mein three bearish (downward) candles aati hain. Har ek candle ek dusre se neeche close hoti hai aur new lows banti hain.
    2. Color:
      • Har candle ka color typically black ya red hota hai, jo ke indicate karta hai ke har ek session mein selling pressure zyada hai.
    3. Size:
      • Har ek candle ki size bhi important hai. Ideally, har successive candle ka size pehle se bada hota hai, jo ke ek aur indication hai ke sellers control mein hain aur downtrend strong hai.
    4. Volume:
      • Is pattern ki confirmation ke liye, traders ko volume ka bhi dhyan rakhna hota hai. Agar is downtrend ke doran volume bhi badh raha hai, to ye bearish reversal signal ko strengthen karta hai.

    Three Black Crows Pattern ka Istemal:
    1. Bearish Reversal Signal:
      • "Three Black Crows" pattern bearish reversal signal provide karta hai, yani ke uptrend ke baad market mein bearish trend start hone ke chances hote hain.
    2. Confirmation:
      • Traders ko is pattern ko confirm karne ke liye doosre technical indicators ka istemal karna chahiye. RSI (Relative Strength Index), MACD (Moving Average Convergence Divergence), aur doosre momentum indicators ka istemal karna useful ho sakta hai.
    3. Risk Management:
      • Trading ke decisions lene se pehle, risk management ka khayal rakhna important hai. Stop-loss orders ka istemal karein taki market conditions ke against hone wale trades ko control kiya ja sake.
    4. Trend Analysis:
      • "Three Black Crows" pattern ke pehle, overall trend analysis karna bhi important hai. Agar market mein strong uptrend hai, to bearish reversal signals ko samajhna zaroori hai.

    Yeh important hai ke kisi bhi ek pattern par pura bharosa na karein. Always, market conditions aur doosre technical indicators ko bhi dhyan mein rakhein aur apne trading decisions ko confirm karne ke liye comprehensive approach istemal karein.
    • #3 Collapse

      Three Black Crow candlestick pattern


      "Three Black Crows" ek technical analysis concept hai jo financial markets mein istemal hota hai, khaas karke candlestick charts par. Yeh pattern ek bearish reversal signal provide karta hai, iska matlab hai ke jab yeh pattern market mein dikhai deta hai, toh yeh indicate karta hai ke ek uptrend ke baad bearish trend shuru ho sakta hai.Three Black Crows pattern teen consecutive days ki price action par mabni hota hai. Har din ek lambi body wali candle hoti hai jismein closing price pichle din ke closing price se neeche hoti hai. Har naya candle pichle din ke body ke andar open hoti hai aur apni low par close hoti hai. Yeh dikhai dene wala pattern market ke bullish momentum ki kamzori ko darust karta hai.

      Click image for larger version

Name:	IMG_4099.png
Views:	70
Size:	10.6 کلوبائٹ
ID:	12784260

      Technical Explanation


      Pehla candle uptrend ke baad dikhai deta hai aur iski opening price pichle din ke closing price se zyada hoti hai.Is candle ki body lambi hoti hai aur closing price, low ke kareeb hoti hai, jo ke bearish sentiment ko reflect karta hai.


      Dusra candle pehle ke close ke neeche open hoti hai, jise gap-down kehte hain.Iski bhi body lambi hoti hai aur closing price low ke kareeb hoti hai, indicating continued selling pressure.


      Teesra candle doosre ke close ke neeche open hoti hai.Iski bhi body lambi hoti hai aur closing price low ke bohot kareeb hoti hai.


      Three Black Crows ka appearance market ke sentiment mein ek tezi se badalne ko darust karta hai. Pehle candle ke baad, doosre aur teesre candles ke bearish nature ne market mein ek clear shift create kiya hota hai. Traders ko yeh signal milta hai ke buyers ki strength kamzor ho rahi hai aur sellers control mein aarahe hain.


      ders doosre technical indicators ka istemal karte hain jaise ki RSI, MACD, ya moving averages.Agar yeh indicators bhi bearish signals provide kar rahe hain, toh Three Black Crows ka impact aur bhi strong ho sakta hai.


      Har trading strategy mein risk management ka ahem hissa hota hai. Traders ko chahiye ke stop-loss orders ka istemal karein taki agar market unexpected movement kare, toh nuksan se bacha ja sake.


      Is pattern ka asar time frame par bhi depend karta hai. Chhoti time frames par yeh signal jaldi develop hota hai, lekin iski authenticity ko confirm karne ke liye longer time frames ka bhi analysis kiya jata hai.Three Black Crows ek powerful bearish reversal signal hai, lekin har ek trading strategy ki tarah, iska bhi sahi dhang se istemal karna zaroori hai. Traders ko chahiye ke market conditions, aur doosre technical factors ko dhyan mein rakhein jab woh is pattern ka istemal karte hain. Iske saath hi, risk management ka bhi khayal rakhna bohot zaroori hai taki trading losses se bacha ja sake.
      • #4 Collapse

        Three Black Crow candlestick pattern


        Click image for larger version

Name:	threestar.png
Views:	82
Size:	4.9 کلوبائٹ
ID:	12784290 Click image for larger version

Name:	three star 2.png
Views:	35
Size:	3.9 کلوبائٹ
ID:	12784291

        1. Introduction (Tehqiqat):
        • "Three Black Crows" ek bearish candlestick pattern hai jo market mein potential reversal ko darust karti hai. Is pattern mein teeno consecutive black (girawat ko darust karti hai) candles shamil hote hain.

        2. Pattern Ki Tashkeel:
        • "Three Black Crows" pattern mein teeno candles hamesha neeche girte hain, aur her ek candle pehle se ziada girawat darust karti hai.

        3. Kaise Pehchanein (Identification):
        • Har candle ki opening price, closing price se ooper hoti hai, aur her ek candle ki closing price, pehle se ziada girawat darust karti hai. Iske teht, aapko teeno candles ko dekhte waqt yeh dhyan rakhna chahiye.

        4. Bearish Reversal Indicator:
        • Three Black Crows pattern, bearish reversal indicator hai, yani ke yeh dikhata hai ke market jo trend upar ki taraf ja raha tha, woh ab neeche ki taraf ja sakta hai.

        5. Psychological Aspect (Nafsiati Pehloo):
        • Is pattern ka asar nafsiati bhi hota hai, kyun ke jab traders teeno consecutive bearish candles dekhte hain, toh unka yeh khayal hota hai ke sellers market control mein hain.

        6. Volume Ka Tafseel (Volume Analysis):
        • Is pattern ko confirm karne ke liye, traders ko volume analysis ka bhi khayal rakhna zaroori hai. Agar teeno candles ke sath tez volume bhi hota hai, toh yeh pattern aur bhi strong ho jata hai.

        7. Trading Signals (Tijarat Ki Isharat):
        • Jab aap Three Black Crows pattern dekhte hain, toh yeh aapko signal deti hain ke market mein girawat hone ka imkan hai. Traders is pattern ko dekhte huye apne sell positions plan karte hain.

        8. Confirmation Zaroori Hai:
        • Jese ke har technical indicator, Three Black Crows pattern ko bhi doosre confirmatory signals ke saath dekha jana chahiye. Yeh confirmatory signals, trading decisions ko aur bhi reliable bana dete hain.

        9. Risk Management:
        • Three Black Crows pattern ka istemal karte waqt, risk management ka khas khayal rakhna zaroori hai. Stop-loss orders ka istemal karna aapko apne nuksan ko control mein rakhne mein madad karega.

        10. Seekhne Ka Jazba:
        • Three Black Crows pattern ko samajhne mein aur iska istemal karne mein waqt aur tahammul ki zarurat hoti hai. Isme istiqamat aur seekhne ka jazba rakhna bohot zaroori hai.

        Akhiri Guftagu (Conclusion):
        • Three Black Crows, bearish market conditions ko samajhne mein ek ahem tool hai. Lekin, isay istemal karte waqt hamesha ehtiyaat aur doosre indicators ka bhi istemal karna zaroori hai.


        • #5 Collapse

          Three Black Crows Pattern


          teen siyah kvon ka patteren : tamam tafseelaat teen siyah kvon ka patteren takneeki tajzia mein aik aam bearish candle stuck patteren hai. yeh aam tor par is baat ki nishandahi karta hai ke aaya oopar ka rujhan rivers ho jaye ga ya neechay ka rujhan jari rahay ga. teen lambay jism wali kaali ( ya surkh ) mom batian jo aik qitaar mein apni nichli satah ke qareeb hoti hain yeh namona banati hain, jis se pata chalta hai ke bohat ziyada farokht ho rahi hai. yeh mazmoon three black cruise patteren ki khususiyaat, tashreeh, aur mumkina tijarti hikmat amlyon ke baray mein tafseel mein jaye ga .


          I. Characteristics of the Three Black Crows Pattern:


          patteren teen bearish candles par mushtamil hai jo aik dosray ke sath seedh mein hain .


          har mom batii ka body lamba aur kaafi hona chahiye, jo ke qeemat mein numaya kami ki nishandahi karta hai .


          har mom batii ki ibtidayi qeemat pichli mom batii ki body ke andar honi chahiye .


          Muawin farokht ke dabao ki alamat ke tor par, hatmi mom batii ko apni kam satah tak pohanchna chahiye .


          II. Interpretation of the Three Black Crows Pattern:


          3Dark karo design ke zareya market mein taizi se manfi ehsas ki taraf tabdeeli ki sifarish ki gayi hai. yeh aik mazboot saylng hungama ko zahir karta hai jis mein reechoon ne belon ka faida uthaya hai. Lagtain musalsal gir rahi hain, jis se zahir hota hai ke market neechay ki taraf barh rahi hai aur is ke baad mazeed kami anay ka imkaan hai .


          III. Trading Strategies Using the Three Black Crows Pattern:


          : 3Dark cruise ki misaal taajiron ke liye mumkina patteren ulat jane ki tasdeeq ke tor par kaam kar sakti hai. izafi tasdeeqi signals ka intzaar karna danishmandi hai, jaisay ke support level se neechay waqfa, khusoosi imtihani alaat se manfi isharay, ya tijarti hajam mein kami .


          mawaqay ko khatam karna : jab three black karo ka namona zahir hota hai to bunyadi asasa ko mukhtasir karna taajiron ke liye aik option ho sakta hai. is ka matlab hai ke asasay ko beech kar is ki kami se faida uthany ki koshish karna. –apne indraaj ke liye aik waqt muntakhib karen jo agli mom batii ke khilnay ke qareeb ho, trjihan teesri mom batii khatam honay ke baad .


          rissk managment : three black cruise patteren ki tijarat karte waqt rissk managment ki munasib hikmat amlyon ka istemaal bohat zaroori hai. patteren ki onche ya qareebi muzahmati satah ke oopar stap las order rakhna nuqsanaat ko mehdood karne mein madad kar sakta hai agar market mutawaqqa ulat phair ke khilaaf harkat karti hai .


          deegar asharion ko yakja karna : traders three black karo ke patteren mein deegar takneeki isharay ya chart patteren shaamil karkay –apne tijarti faislon ki aitbaar ko barha satke hain. yeh trained lines, moving evrrages, ya osclicater ho satke hain, yeh sab aik rujhan ko mazeed ulat jane ki himayat karne ki salahiyat rakhtay hain .


          Conclusion:


          teen lagataar lambay jism wali kaali mom batian jo –apne nichale hissay ke qareeb hoti hain three black karo bearish reversal patteren banati hain. chunkay yeh market ke jazbaat mein taizi se mandi ki taraf tabdeeli ka mahswara deta hai, is liye tajir usay neechay ke rujhanaat ya ulat jane ke mawaqay ki tawaqqa ke liye istemaal kar satke hain. taham, trading ki hikmat amlyon mein patteren ko shaamil karte waqt khatraat ka muaser tareeqay se intizam karna aur deegar takneeki tajzia tools ki madad se three black karo patteren ki tasdeeq karna zaroori hai .
          • #6 Collapse

            Three Black Crow candlestick pattern

            Click image for larger version

Name:	download (2).png
Views:	42
Size:	4.8 کلوبائٹ
ID:	12784348
            Certainly! Here's an explanation of the "Three Black Crows" candlestick pattern
            1. Ta'aruf (Introduction):
              • Candlestick ka aik khaas pattern hai jise "Three Black Crows" kehte hain.
            2. Pattern Ki Tashheer (Pattern Formation):
              • Ye pattern teen saath aane wale kaley candles se bana hota hai.
            3. Candle Ki Pechan (Identification of Candle):
              • Har candle choti body aur badi lower shadow ke saath aati hai.
            4. Pehla Kala Kauwa (First Black Crow):
              • Pehla candle bullish trend ko todta hai aur neeche ki taraf jata hai.
            5. Dusra Kala Kauwa (Second Black Crow):
              • Dusra candle bhi neeche girta hai aur pehle candle ki range mein aata hai.
            6. Teesa Kala Kauwa (Third Black Crow):
              • Teesra candle bhi neeche ja kar pehle dono ki range mein rehta hai.
            7. Trend Ki Toot (Breakdown of Trend):
              • Ye pattern bullish trend ko indicate karta hai aur bearish reversal ki taraf ishara karta hai.
            8. Volume Ki Ahmiyat (Importance of Volume):
              • Is pattern ke sath aane wale volumes ki bhi ghaur karna zaroori hai.
            9. Bearish Reversal Signal (Bearish Ulatne Ka Signal):
              • Ye pattern market mein bearish reversal ko darust karti hai.
            10. Trading Strategy (Trading Strategy):
              • Is pattern ko samajh kar traders apni trading strategies tajwez kar sakte hain.
            11. Stop Loss Aur Target (Stop Loss and Target):
              • Trading mein mukhtalif risk aur reward levels ko tay karna ahem hai.
            12. Dusra Confirmation Indicator (Second Confirmation Indicator):
              • Is pattern ko confirm karne ke liye doosre technical indicators ka bhi istemal kiya ja sakta hai.
            13. Historical Performance (Tareekhi Performance):
              • Is pattern ki tareekhi performance ka bhi moolya karna chahiye.
            14. Pattern Ki Nakami (Failure of Pattern):
              • Kuch dafa ye pattern asar nahi karti, is liye traders ko hamesha cautious rehna chahiye.
            15. Conclusion (Nateeja):
              • "Three Black Crows" pattern ek powerful bearish reversal signal ho sakta hai, lekin hamesha market conditions ko madde nazar rakhte hue iska istemal karna chahiye.
            • #7 Collapse

              Intro :

              Candlestick patterns market analysis mein ek mahatvapurna tool hote hain jo traders ko price action ke moolya ko samajhne mein madad karte hain. "Three Black Crows" ek aise pramukh candlestick pattern hai jo downtrend ko darust karti hai. Chaliye is pattern ko aur uske arth ko vistaar se samajhte hain.

              "Three Black Crows" ek bearish reversal candlestick pattern hai, jo uptrend ke bad market ke trend ko badalne ka sanket deta hai. Is pattern mein, teeno consecutive black (kale) candles hote hain, jinke opening prices previous candle ke closing prices se upar hote hain.

              Kaise Pehchanein Three Black Crows:

              Is pattern ko pehchanne ke liye, aapko teeno consecutive trading sessions mein black candles dekhne honge, jismein har ek candle ke opening price previous candle ke closing price se upar hota hai. Yeh dikhata hai ki sellers ne control lena shuru kar diya hai aur market mein bearish sentiment badh gayi hai.

              Three Black Crows Ka Arth:

              Three Black Crows ka aana ek bearish reversal signal hai, jo market mein reversal ko darust karta hai. Yeh pattern traders ko batata hai ki buyers ne control kho diya hai aur ab sellers ne market mein apna dominance shuru kar diya hai. Is pattern ke appearance ke baad, traders bearish positions ko consider karte hain.


              Trading Strategies:

              Three Black Crows dekhkar traders apne trading strategies ko adjust kar sakte hain. Agar aapko yeh pattern dikhta hai, toh aap short positions consider kar sakte hain, yaani ki stock ya asset ko bech kar profit kamane ki koshish kar sakte hain. Lekin, hamesha yaad rahe ki market predictions mein risk hota hai, aur yeh pattern bhi kisi bhi samay galat ho sakta hai.

              Risk Management:

              Three Black Crows ya koi bhi candlestick pattern ka istemal karne se pehle, risk management ka dhyan rakhna zaroori hai. Stop-loss orders ka istemal karke aap apne nuksan ko control mein rakh sakte hain. Iske alawa, multiple indicators aur confirmatory signals ka bhi istemal karna aapki trading decision ko sudhar sakta hai.

              Conclusion:

              Three Black Crows candlestick pattern ek powerful indicator ho sakta hai agar ise sahi taur par samjha jaye aur dusre technical analysis tools ke saath milaye jaye. Market mein hamesha volatility aur risk hota hai, isliye traders ko savdhan rehna chahiye aur proper risk management ke saath trading karna chahiye. Candlestick patterns ke sahi taur par samajhne aur istemal karne se traders apne trading decisions ko improve kar sakte hain.


              There is a time to go long, a time to go short and a time to go fishing.
              ​​​​​​​

              ​​​​​​​
              • #8 Collapse

                Three Black Crow Candlestick Pattern: A Comprehensive Guide

                1. Introduction


                Candlestick patterns are crucial tools for traders in the financial markets, providing insights into market sentiment and potential future price movements. Among these patterns, the "Three Black Crows" is one of the most significant bearish indicators, signaling potential reversals in upward trends. This article will explore the Three Black Crows candlestick pattern in detail, discussing its formation, significance, and how traders can effectively use it in their trading strategies.
                2. Candlestick Patterns: An Overview


                Candlestick patterns are graphical representations of price movements within a specific time frame. Each candlestick consists of a body and wicks, which represent the open, close, high, and low prices of the asset. Traders analyze these patterns to predict future price movements, making them essential for technical analysis. The Three Black Crows pattern is a critical bearish reversal signal that indicates a potential trend reversal from bullish to bearish.
                3. Understanding the Three Black Crows Pattern


                The Three Black Crows pattern is formed when three consecutive black (or red) candlesticks appear after an uptrend. Each candlestick opens lower than the previous close and closes at or near its low, indicating strong selling pressure. This pattern reflects a shift in market sentiment from bullish to bearish, suggesting that buyers are losing control and sellers are taking over.
                4. Formation of the Pattern


                To identify the Three Black Crows pattern, traders look for the following characteristics:
                1. Trend Preceding the Pattern: The pattern typically follows a significant uptrend.
                2. Three Consecutive Bearish Candlesticks: Each of the three candlesticks must close lower than the previous candlestick's close.
                3. Lower Openings: Each candlestick should open lower than the close of the previous candlestick, indicating increasing bearish momentum.
                5. Significance of the Pattern


                The Three Black Crows pattern is significant for several reasons. Firstly, it indicates a potential reversal in the market trend, signaling to traders that it may be time to exit long positions or consider short positions. Secondly, the pattern reflects strong selling pressure, suggesting that market sentiment is shifting from bullish to bearish. Lastly, it can be used in conjunction with other technical indicators to enhance trading decisions.
                6. Confirming the Pattern


                While the Three Black Crows pattern is a strong bearish signal, it is essential to confirm the pattern with other technical indicators. Traders often look for increased volume during the formation of the pattern, which can indicate strong selling pressure. Additionally, using indicators such as the Relative Strength Index (RSI) or Moving Average Convergence Divergence (MACD) can help confirm the bearish trend suggested by the pattern.
                7. Trading Strategies


                Traders can implement various strategies when trading the Three Black Crows pattern. A common approach is to wait for the pattern to complete before entering a short position. This ensures that traders are entering at the right time, as premature entries can lead to losses. Setting stop-loss orders above the high of the last candlestick can help manage risk, allowing traders to limit potential losses if the market moves against them.
                8. Managing Risk


                Risk management is crucial when trading the Three Black Crows pattern. Traders should consider their risk tolerance and position size before entering a trade. Utilizing stop-loss orders, trailing stops, and proper position sizing can help mitigate risks associated with trading this pattern. It is essential to have a well-defined risk management plan to protect capital while taking advantage of potential market reversals.
                9. Psychological Aspect of the Pattern


                The psychological aspect of the Three Black Crows pattern is essential for understanding market behavior. The pattern reflects a shift in sentiment, where buyers become hesitant and sellers gain confidence. This psychological shift can lead to panic selling, further driving prices down. Understanding the emotions driving market movements can help traders anticipate potential price movements and adjust their strategies accordingly.
                10. Limitations of the Pattern


                Like all trading patterns, the Three Black Crows pattern has its limitations. False signals can occur, leading to potential losses for traders. Additionally, market conditions, such as high volatility or unexpected news events, can impact the effectiveness of the pattern. Traders should be cautious and use additional analysis tools to enhance their trading decisions.
                11. Combining with Other Indicators


                To increase the reliability of the Three Black Crows pattern, traders often combine it with other technical indicators. For example, using moving averages can help identify the overall trend, while oscillators like RSI can indicate overbought or oversold conditions. This combination of indicators can provide a more comprehensive view of the market and improve trading accuracy.
                12. Real-Life Examples


                Analyzing real-life examples of the Three Black Crows pattern can provide valuable insights into its effectiveness. Historical price charts can illustrate how the pattern played out in various markets, showcasing successful trades and potential pitfalls. By studying these examples, traders can gain a better understanding of how to apply the pattern in their trading strategies.
                13. Conclusion


                The Three Black Crows candlestick pattern is a powerful bearish reversal signal that can provide traders with valuable insights into market sentiment and potential price movements. By understanding its formation, significance, and trading strategies, traders can effectively incorporate this pattern into their trading approach. However, it is crucial to confirm the pattern with other technical indicators and employ sound risk management practices to enhance trading success.
                14. Final Thoughts


                In the dynamic world of trading, recognizing patterns like the Three Black Crows can significantly impact a trader's success. Continuous learning and adaptation to market conditions are vital for thriving in the financial markets. By mastering the Three Black Crows pattern and combining it with other analysis tools, traders can improve their decision-making processes and navigate the complexities of trading with greater confidence.


                • <a href="https://www.instaforex.org/ru/?x=ruforum">InstaForex</a>
                • #9 Collapse

                  Stochastic Oscillator Indicator: Ek Jaiza

                  1. Tasawwur


                  Stochastic Oscillator ek technical analysis ka tool hai jo stock ya kisi aur asset ki price movement ki taazgi aur momentum ko jaanchne ke liye istemal hota hai. Yeh indicator kisi asset ki current price ko uski specific time period ke high aur low ke muqablay mein dekhta hai, jisse traders ko market ke overbought ya oversold conditions ka andaza hota hai.
                  2. Stochastic Oscillator Ka Formula


                  Iska formula kuch is tarah hai:

                  %K=(C−L)(H−L)×100\%K = \frac{(C - L)}{(H - L)} \times 100 %K=(H−L)(C−L)​×100

                  Yahan par:
                  • C = Current closing price
                  • L = Lowest price over the specified period
                  • H = Highest price over the specified period

                  Yeh formula indicator ko ek value deta hai jo 0 se 100 tak hoti hai.
                  3. Indicator Ki Taraqqi


                  Stochastic Oscillator ko 1950s mein George C. Lane ne develop kiya tha. Unka maqsad yeh tha ke wo market ki momentum ko samjhein aur trend reversal points ka andaza lagain. Yeh indicator ab duniya bhar ke traders mein popular hai aur yeh different financial markets mein istemal hota hai.
                  4. Overbought Aur Oversold Conditions


                  Stochastic Oscillator ka main faida yeh hai ke yeh overbought aur oversold levels ko identify karne mein madad karta hai. Jab %K line 80 se zyada hoti hai, to market overbought samjhi jati hai, jabke 20 se kam hone par oversold condition hoti hai. Yeh levels traders ko yeh samajhne mein madad dete hain ke kab unhein positions leni ya sell karni chahiye.
                  5. Signal Generation


                  Stochastic Oscillator signals generate karta hai jab %K line, %D line ke saath cross hoti hai. Jab %K line %D line ko upar ki taraf cross karti hai, to yeh buy signal hota hai. Iske baraks, jab %K line neeche ki taraf %D line ko cross karti hai, to yeh sell signal hota hai.
                  6. Divergence


                  Divergence Stochastic Oscillator ka ek aur important feature hai. Jab price new high ya low banata hai lekin indicator aisa nahi karta, to isay divergence kehte hain. Positive divergence tab hoti hai jab price lower low bana raha hota hai lekin oscillator higher low bana raha hota hai, jo trend reversal ka indication hota hai. Negative divergence uska ulta hota hai.
                  7. Trading Strategies


                  Stochastic Oscillator ka istemal karte waqt traders apni strategies ko customize kar sakte hain. Kuch traders sirf overbought aur oversold levels par hi trade karte hain, jabke doosre log signal crossovers aur divergence ko bhi consider karte hain. Har trader apne style aur risk appetite ke mutabiq strategy tay kar sakta hai.
                  8. Period Selection


                  Indicator ka accuracy period selection par bhi depend karta hai. Commonly, 14-period ko use kiya jata hai, lekin traders apne trading style ke mutabiq isay adjust kar sakte hain. Choti periods zyada sensitive hote hain, jabke bade periods zyada stable signals dete hain.
                  9. Stochastic Oscillator Ki Limitations


                  Har indicator ki tarah, Stochastic Oscillator bhi kuch limitations rakhta hai. Yeh kabhi kabhi false signals generate kar sakta hai, khas taur par volatile markets mein. Isliye, traders ko chahiye ke is indicator ko dusre indicators ke saath combine karain taake unki trading ki accuracy barh sake.
                  10. Combination with Other Indicators


                  Stochastic Oscillator ko doosre technical indicators ke saath combine karna ek acha approach hai. Moving Averages ya Relative Strength Index (RSI) ke saath iska istemal karne se signal confirmation milta hai. Yeh traders ko zyada confidence deta hai aur unhein zyada informed decisions lene mein madad karta hai.
                  11. Real-Time Monitoring


                  Real-time monitoring Stochastic Oscillator ki ek aur khasiyat hai. Yeh market ki real-time movement par react karta hai, jisse traders ko instant signals milte hain. Isse traders jaldi decisions le sakte hain, jo fast-moving markets mein faida mand hota hai.
                  12. Psychological Aspect


                  Traders ka psychological aspect bhi Stochastic Oscillator ki effectiveness ko influence karta hai. Jab market overbought ya oversold hota hai, to traders ki emotional state bhi us par asar dalti hai. Isliye, indicator ka istemal karte waqt apni psychological condition par bhi nazar rakhna zaroori hai.
                  13. Conclusion


                  Stochastic Oscillator ek powerful tool hai jo traders ko market ki momentum aur price trends ko samajhne mein madad karta hai. Iska istemal overbought aur oversold conditions ko identify karne, signal generation, aur divergence analysis ke liye kiya jata hai.
                  14. Final Thoughts


                  Traders ko yeh samajhna chahiye ke Stochastic Oscillator sirf ek tool hai aur iska istemal kisi bhi trading strategy ka hissa hona chahiye. Is indicator ko dusre tools aur apne personal experiences ke saath integrate karne se unki trading ki effectiveness barh sakti hai. Aakhir mein, Stochastic Oscillator ek aisa indicator hai jo market ki complexities ko samajhne mein madadgar hai, lekin isay samajhne aur istemal karne ke liye practice aur patience ki zarurat hoti hai.


                  اب آن لائن

                  Working...
                  X