Butterfly candlestick pattern
X
  • وقت
  • دکھائیں
Clear All
new posts
  • #1 Collapse

    Butterfly candlestick pattern

    Butterfly Candlestick Pattern

    Butterfly candlestick pattern ye ishara karta hai keh sellers apni sell pressure khatam kar chuke hain aur buyers ke dabaav ke bajaaye keemat ko oonchi karne mein mautaad hain. Bearish pattern mein, ye ishara karta hai keh buyers apni buy pressure khatam kar chuke hain aur sellers ke dabaav ke bajaaye keemat ko neechay le jane mein mautaad hain.

    Butterfly pattern ka presence trendline break ya Fibonacci retracement level ke saath ek zyada confluence of signals provide kar sakta hai. Iske ilawa, traders alag-alag timeframes par candlestick patterns ka istemal karke potential reversal ki aur evidence hasil kar sakte hain. Multip0le factors ko apni analysis mein shamil karke....ye aik reversal pattern ha, jaisa k name sa zahir ha k is ma three candles hoti hain jo teeno lambi aur bullish hoti hain, teeno candles ki lambai b aik jaisi hoti ha aur har candle ka oppening point dusri k upar hota ha, 
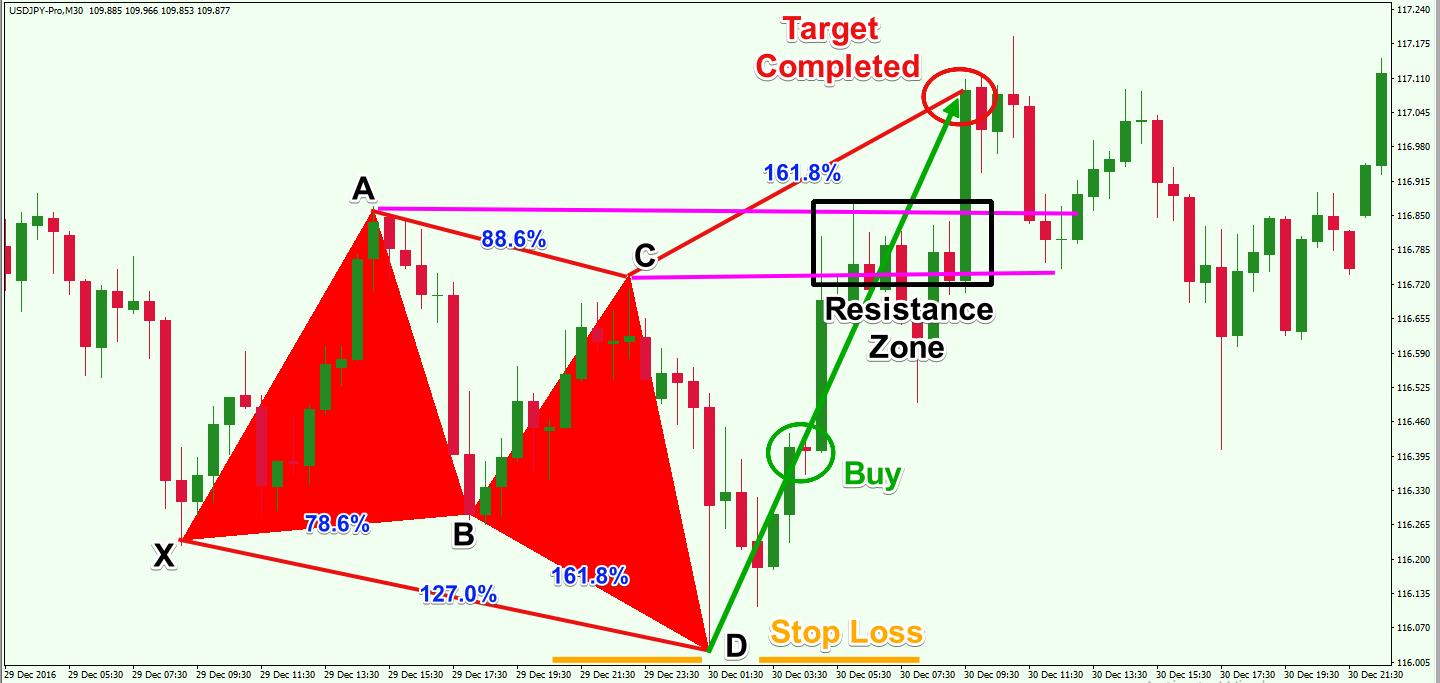
down trend ki bottom ma traders nafsiati aur buniadi wajoohat ki waja sa market ma trend changing ka andaza lagatay hain aur wo buy ki trades kartay hain, ye buy ka amal three white soldiers pattern bnata ha, Multiple factors ko apni analysis mein shamil karke,ye ishara karta hai keh sellers apni sell pressure khatam kar chuke hain aur buyers ke dabaav ke bajaaye keemat ko oonchi karne mein mautaad hain. jiska matlab hai ki yeh indicate karta hai ke market ka trend reverse hone wala hai. Is pattern mein kuch khas candlesticks ka combination hota hai, jise dekh kar traders infer karte hain ke market mein reversal hone ke chances hain.
  • <a href="https://www.instaforex.org/ru/?x=ruforum">InstaForex</a>
  • #2 Collapse

    Butterfly candlestick pattern kai hai
    Click image for larger version

Name:	download - 2023-11-28T075448.025.png
Views:	28
Size:	8.5 کلوبائٹ
ID:	12783811


    "Butterfly" candlestick pattern ek technical analysis tool hai jo market mein trend reversal ko darust karta hai. Yeh pattern typically strong reversals ko suggest karta hai. Butterfly pattern three distinct swings ko represent karta hai, aur isme Fibonacci retracement levels ka istemal hota hai. Yahan, main Butterfly candlestick pattern ke key features aur tafsiliyat Roman Urdu mein batata hoon:

    Butterfly Candlestick Pattern Ka Tafsili Ta'aruf:

    **1. Candlestick Structure:
    • Butterfly pattern 5 candlesticks par mabni hota hai.
    • Pehli candle bullish (upward) trend ko darust karta hai.
    • Dusri candle ki body choti hoti hai aur neeche ki taraf hoti hai, indicating a pause or retracement in the existing trend.
    • Teesri candle bullish trend mein hoti hai aur dusre candle ki body ke andar fit hoti hai, indicating a continuation of the original trend.
    • Chothi candle, yaani ke retracement candle, dusri candle ki tarah hoti hai aur isme bhi downtrend ko darust karta hai.
    • Panchvi aur aakhri candle bullish trend mein hoti hai aur pehli candle ki tarah upar ki taraf move karti hai, confirming the trend reversal.

    **2. Fibonacci Levels:
    • Butterfly pattern mein Fibonacci retracement levels ka istemal hota hai. Dusre aur chouthi candles ki bodies ke high aur low points ko connect kar ke retracement levels ko identify kiya jata hai.

    Tafsili Tafseelat:
    • Butterfly pattern ek strong reversal indicator hai aur traders ko suggest karta hai ke market ka trend reverse hone wala hai.
    • Fibonacci retracement levels, especially 0.786 aur 1.272, butterfly pattern mein key role play karte hain.
    • Pattern ko confirm karne ke liye traders doosre technical indicators aur price action ko bhi dekhte hain.

    Butterfly Pattern Caveats:
    • Butterfly pattern ka istemal ke saath, traders ko aur bhi confirmatory signals ki zarurat hoti hai.
    • Market conditions aur overall trend ko madde nazar rakhte hue butterfly pattern ko interpret karna chahiye.

    Butterfly pattern ko samajhna zaroori hai taake aap isko apni trading strategy mein shamil kar sakein. Lekin, hamesha yaad rahe ke kisi bhi pattern ka istemal ke saath risk management aur doosre confirmatory indicators ka bhi istemal karna zaroori hai.
    • <a href="https://www.instaforex.org/ru/?x=ruforum">InstaForex</a>
    • #3 Collapse

      Butterfly Candlestick Pattern

      Butterfly candlestick pattern trading aur technical analysis mein aik unique aur powerful tool hai. Yeh pattern traders ko market ke potential price movements ko samajhne aur predict karne mein madadgar hota hai. Yeh pattern khas taur par price reversals ko identify karne ke liye use hota hai.


      Butterfly Candlestick Pattern Kya Hai?


      Butterfly candlestick pattern aik reversal pattern hai jo bullish aur bearish trends dono mein paaya jata hai. Yeh pattern do types mein divided hai: Bullish Butterfly aur Bearish Butterfly. Har type market ke trend reversal ko indicate karta hai aur traders ko buy ya sell signals provide karta hai.

      Bullish Butterfly Pattern


      Bullish Butterfly pattern tab banta hai jab market aik downward trend follow kar raha hota hai aur phir aik significant support level par price reverse hoti hai. Is pattern ka formation kuch is tarah hota hai:
      1. Leg XA: Pehla leg downward movement hota hai jo initial price drop ko represent karta hai.
      2. Leg AB: Doosra leg aik upward retracement hota hai jo XA leg ka kuch hissa recover karta hai.
      3. Leg BC: Teesra leg aik aur downward movement hota hai jo AB leg ka kuch hissa retrace karta hai.
      4. Leg CD: Chautha aur final leg aik upward movement hota hai jo BC leg ke baad banta hai aur price ko reversal ka signal deta hai.

      Bullish Butterfly pattern ka confirmation tab hota hai jab CD leg XA leg ka significant portion recover kar leta hai aur price ek strong upward movement show karti hai.

      Bearish Butterfly Pattern


      Bearish Butterfly pattern tab banta hai jab market aik upward trend follow kar raha hota hai aur phir aik significant resistance level par price reverse hoti hai. Is pattern ka formation kuch is tarah hota hai:
      1. Leg XA: Pehla leg upward movement hota hai jo initial price rise ko represent karta hai.
      2. Leg AB: Doosra leg aik downward retracement hota hai jo XA leg ka kuch hissa recover karta hai.
      3. Leg BC: Teesra leg aik aur upward movement hota hai jo AB leg ka kuch hissa retrace karta hai.
      4. Leg CD: Chautha aur final leg aik downward movement hota hai jo BC leg ke baad banta hai aur price ko reversal ka signal deta hai.

      Bearish Butterfly pattern ka confirmation tab hota hai jab CD leg XA leg ka significant portion recover kar leta hai aur price ek strong downward movement show karti hai.

      Butterfly Pattern Ki Calculation


      Butterfly pattern ki calculation Fibonacci retracement levels ko use karke ki jati hai. Yeh levels pattern ke different legs ko define karte hain aur pattern ki accuracy ko ensure karte hain.
      1. Leg AB: XA leg ka 78.6% retracement hota hai.
      2. Leg BC: AB leg ka 38.2% to 88.6% retracement hota hai.
      3. Leg CD: XA leg ka 127.2% to 161.8% extension hota hai.

      In levels ko use karke pattern ki identification aur confirmation ki jati hai.

      Butterfly Candlestick Pattern Ka Istimaal


      Butterfly candlestick pattern ko trading mein asar daramad istimaal karne ke liye kuch key points hain jo dhyan mein rakhne chahiye:
      1. Confirmation: Pattern ko hamesha confirm karna chahiye. Fibonacci retracement levels ko use karke pattern ki accuracy ko check karna chahiye. Iske alawa, doosre technical indicators jaise moving averages aur volume analysis ko bhi use karke pattern ko confirm karna chahiye.
      2. Context: Pattern ko context ke sath samajhna bohot zaroori hai. For instance, agar bullish butterfly pattern aik significant support level par banta hai, to iska bullish reversal signal zyada strong hoga. Isi tarah, agar bearish butterfly pattern aik resistance level par banta hai, to iska bearish reversal signal zyada reliable hoga.
      3. Time Frames: Butterfly pattern different time frames par different meanings rakhte hain. Aik pattern jo daily chart par strong signal de raha ho, wo weekly ya monthly chart par utna effective nahi hoga. Is liye, time frame ko samajhna aur uske mutabiq analysis karna bohot zaroori hai.
      4. Risk Management: Pattern ko use karke trading decisions lene se pehle risk management strategies ko zaroor follow karna chahiye. Stop-loss orders ko appropriate levels par place karna aur position sizing ko dhyan mein rakhna chahiye taake potential losses ko minimize kiya ja sake.


      Butterfly Pattern Ka Importance


      Butterfly candlestick pattern trading mein aik bohot hi powerful aur informative tool hai. Yeh pattern market ke sentiment ko samajhne aur potential price movements ko predict karne mein bohot madadgar hota hai. Is pattern ke kuch important aspects hain:
      1. Reversal Signals: Pattern market ke reversal points ko accurately identify karta hai. Yeh bearish trends mein bullish reversal aur bullish trends mein bearish reversal signals provide karta hai.
      2. Fibonacci Retracement Levels: Pattern Fibonacci retracement levels ko use karke price movements ko accurately predict karta hai. Yeh levels pattern ke different legs ko define karte hain aur pattern ki accuracy ko ensure karte hain.
      3. Risk Management: Pattern traders ko precise entry aur exit points provide karta hai. Yeh risk management ke liye bohot useful hai kyun ke traders stop-loss aur take-profit orders ko appropriate levels par place kar sakte hain.
      4. Flexibility: Pattern ko kisi bhi financial instrument ke sath use kiya ja sakta hai, chahe wo stocks ho, forex ho ya commodities. Yeh har tarah ki trading style ke liye suitable hai, chahe wo day trading ho, swing trading ho ya long-term investing.

      Butterfly candlestick pattern trading aur technical analysis mein aik bohot hi powerful aur informative tool hai. Yeh pattern market ke sentiment ko samajhne aur potential price movements ko predict karne mein bohot madadgar hota hai. Is pattern ko samajhna aur uska sahi tarah se istimaal karna trading decisions ko significantly improve kar sakta hai. Har trader ko butterfly pattern ke concepts, types aur unke practical applications ko samajhkar apne trading strategy mein incorporate karna chahiye taake market ke price movements ko effectively analyze aur trade kiya ja sake.

      اب آن لائن

      Working...
      X