What is Tasuki Gap Down Candlestick Pattern :
X
  • وقت
  • دکھائیں
Clear All
new posts
  • #1 Collapse

    What is Tasuki Gap Down Candlestick Pattern :
    DEFINITION OF THE TASUKI GAP DOWN CANDLESTICK PATTERN :


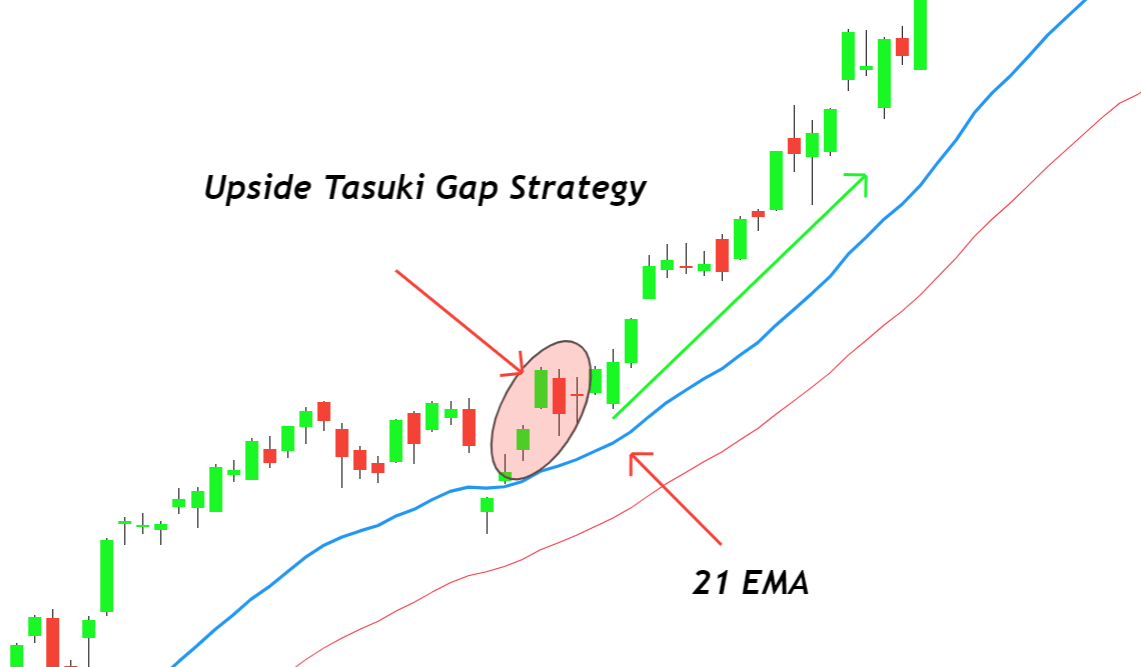
    Tasuki Gap Down Candlestick Pattern ka matlab hai jab ek downtrend ke baad gap opening hoti hai, phir ek chhota bullish candlestick aata hai jo pichle bearish candlestick mein jaata hai. Is pattern se pehle ke downtrend ka reversal aur momentum ke upside shift ki possibility hoti hai.

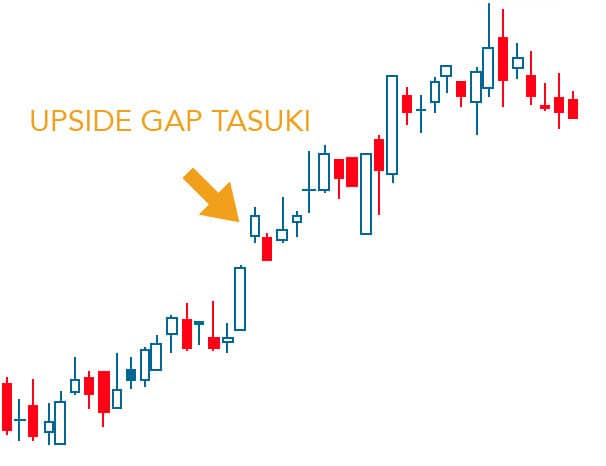
    Tasuki Gap Down Candlestick Pattern teen candlestick se banta hai. Pehli candlestick ek bearish candlestick hoti hai jo gap down ke saath open hoti hai. Dusra candlestick ek chhota bullish candlestick hoti hai jo pichli candlestick ke andar gap up karke close hoti hai. Teesri candlestick ek bearish candlestick hoti hai jo dusri candlestick ke close se neeche open hoti hai aur downtrend ko extend karti hai.


    CONFIRMATION AND FILTERING CRITERIA :


    Tasuki Gap Down Candlestick Pattern ki validity confirm karne ke liye, traders aur confirmation signals dekh sakte hain. Ek common approach yeh ho sakti hai ki teesri candlestick pe wait karein jab pehli candlestick ke low se neeche close hoti hai. Yeh bearish momentum ko confirm karegi aur reversal ke liye strong signal degi.

    Iske alawa, traders dusre technical indicators aur chart patterns ka upyog kar sakte hain false signals ko filter karne ke liye. Jaise ki woh Tasuki Gap Down Candlestick Pattern ke saath Relative Strength Index (RSI) jaise oscillator pe overbought conditions dekh sakte hain. Yeh suggest karega ki market reversal ke liye taiyaar hai aur success ki probability increase hogi.


    TRADING STRATEGIES :


    Traders Tasuki Gap Down Candlestick Pattern ka upyog bearish reversal ke liye short positions mein enter karne aur potential profits capture karne ke liye kar sakte hain. Ek strategy yeh ho sakti hai ki confirmation criteria pe wait karein aur jab teesri candlestick pehli candlestick ke low se neeche close ho, tab short trade mein enter karein. Stop-loss order ko dusri candlestick ke high se upar rakh sakte hain risk manage karne ke liye.

    Ek aur approach yeh ho sakta hai ki Tasuki Gap Down Candlestick Pattern ko dusre technical analysis tools ke saath combine karein. Jaise ki traders pattern ke saath ek key support level ka break dekh rahe hain taki successful trade ki probability increase ho.


    RISK MANAGEMENT :


    Tasuki Gap Down Candlestick Pattern trade karte waqt risk management bahut zaroori hai. Traders ko hamesha appropriate position sizing ka upyog karna chahiye aur stop-loss orders set karna chahiye taki potential losses limit mein rahein. Yaad rakhein ki sabhi patterns successful trade mein successful nahi hote, aur loss trading ka natural hissa hai.


    LIMITATIONS AND CONSIDERATIONS :


    Tasuki Gap Down Candlestick Pattern potential reversals ko identify karne ke liye powerful ek tool hai, lekin iski limitations ko consider karna zaroori hai. Jaise ki kisi bhi technical analysis tool ki tarah, yeh foolproof nahi hai aur false signals generate kar sakta hai. Traders ko hamesha additional confirmation signals ka upyog karna chahiye aur overall market context ko consider karna chahiye trading decisions lene se pehle.

    Aur yeh bhi zaroori hai ki candlestick patterns subjective hote hain, kyun ki ye individual traders ke interpretation par depend karte hain. Isliye, Tasuki Gap Down Candlestick Pattern ko dusre technical analysis tools ke saath combine karke, success ki probability increase karne ki salah di jati hai.

    Ant mein, Tasuki Gap Down Candlestick Pattern forex traders dwara market mein potential opportunities ko identify karne ke liye ek powerful bearish reversal pattern hai. Upar di gayi technical information ko samajhkar aur apply karke, traders is pattern ki gehri samajh hasil kar sakte hain aur informed trading decisions le sakte hain.
  • <a href="https://www.instaforex.org/ru/?x=ruforum">InstaForex</a>
  • #2 Collapse

    INTRODUCE OF THE TASUKI GAP DOWN CANDLESTICK PATTERN :


    Dear Friends hopefully Ap Sab khariat Say Hon gy AJ TASUKI Gap Down CANDLESTICK Pattern ka matlab hai jab ek downtrend ke baad gap opening hoti hai, phir ek chhota bullish candlestick aata hai jo pichle bearish CANDLESTICKS mein jaata hai. Is pattern se pehle ke downtrend ka reversal aur momentum ke upside ki Truf ho jay gy

    Dear jab tasuki Gap Downs Candle Patterns teen candles se banta hai. Pehli candlestick ek bearish candlestick hoti hai jo gap down ke saath open hoti hai. Dusra candlestick ek Chota bullish CANDLESTICKS hoti hai jo pichli candlestick ke andar gap up karke close hoti hai. Third CANDLESTICK ek bearish candlestick hoti hai jo dusri candlestick ke close se neeche open hoti hai aur downtrend ko extend asaani Say hy


    CONFIRMATIONS & FILTERING CRITERIA :


    Dear jab bh Tasuki Gap Down Candlestick Pattern ki validity confirm karne ke liye, traders aur confirmations signals dekh sakte hain. Ek common approach yeh ho sakti hai ki teesri candlestick pe wait karein jab pehli candlestick ke low se neeche close hoti hai. Yeh bearish Momentums ko confirm strong ho jy
    Ess ka alawa, traders dusre technically indicators aur chart patterns ka upyog kar sakte hain false signal's ko filter karne ke liye. Jaise ki woh Tasuki Gap Down Candlestick Pattern ke saath Relative Strength Index (RSI) jaise oscillator pe overbought condition asaani Say ho gy aor Trad Len gy .


    TRADING STRATEGY'S:


    Traders Tasuki Gap Down Candlestick Pattern ka upyog bearish reversal ke liye short positions mein enter karne aur potential profits capture karne ke liye kar sakte hain. Ek strategy yeh ho sakti hai ki confirmations criteria pe wait karein aur jab teesri candlestick pehli CANDLESTICK ke low se Neeche close ho, tab short trade mein enter karein. Stop-loss order ko dusri candlestick ke high se hongy


    RISK MANAGEMENT KA USE:


    Dear Jab TASUKI GAP Down Candlestick PATTERN trade karte waqt risk management bahut zaroori hai. Traders ko hamesha appropriate position sizing ka up you karna chahiye aur Stop-Loss orders set karna chahiye taki potential losses limit mein rahein. Yaad rakhein ki sabhi patterns successful trade mein successfully hongy


    LIMITATIONS AND CONSIDERATIONS KA FORMULAS:


    Dear tasuki GAP DOWN CANDLESTICK Pattern potential reversals ko identify karne ke liye powerful ek tool hai, lekin iski limitations ko considering karna zaroori hai. Jaise ki kisi bhi technical analysis tool ki tarah, yeh foolproof nahi hai aur false signals generate kar sakta hai. Traders ko hamesha additional confirmation signals ko identifying karein gy

    Dear yah say yeh bhi zaroori hai ki candlestick patterns subjective hote hain, kyun ki ye individuals trader's ke interpretation par depending karte hain. Isliye, Tasuki Gap Down Candlestick Pattern ko dusre technical analysis tools ke saath combine karke, success ki probability increased hongy

    • #3 Collapse

      DEFINITION OF THE TASUKI GAP DOWN CANDLESTICK PATTERN :
      Click image for larger version

Name:	download - 2023-11-27T215530.934.png
Views:	56
Size:	3.4 کلوبائٹ
ID:	12783701

      Tasuki Gap Down Candlestick Pattern, technical analysis mein ek specific candlestick pattern hai jo price action ko interpret karne mein istemal hota hai. Yeh pattern market mein potential reversal ko indicate karta hai. Chaliye is pattern ki roman Urdu mein tafseel se samajhte hain:

      Tasuki Gap Down Candlestick Pattern Ki Tafseel:
      1. Definition (تعریف):
        • Tasuki Gap Down ek bearish reversal pattern hai. Isme three consecutive candlesticks hote hain. Pehli candlestick ek downtrend ke dauran aati hai, doosri ek gap down ke saath shuru hoti hai, aur teesri candlestick doosri ki kuch had tak cover kar leti hai, lekin overall downtrend mein rehti hai.
      2. Components (اہم حصے):
        • Pehli Candlestick (Bullish): Pehli candlestick bearish trend ke dauran hoti hai.
        • Doosri Candlestick (Bearish): Doosri candlestick gap down ke saath shuru hoti hai, jo indicate karta hai ke selling pressure mehsoos ho rahi hai.
        • Teesri Candlestick (Bearish): Teesri candlestick doosri ki kuch had tak cover kar leti hai, lekin overall bearish trend mein rehti hai. Agar iski closing price doosri se neeche hoti hai, to pattern aur bhi strong hota hai.
      3. Interpretation (تشخیص):
        • Tasuki Gap Down pattern ek potential bearish reversal ko suggest karta hai. Yeh dikhata hai ke initial selling pressure ke baad bhi bears control mein hain aur downtrend jari reh sakta hai.
      4. Trading Strategies (ٹریڈنگ چالیں):
        • Agar traders Tasuki Gap Down pattern ko dekhte hain, to woh potential short (sell) positions consider kar sakte hain. Lekin hamesha yaad rahe ke kisi bhi trading decision ko aur confirmatory signals ke saath milana chahiye aur risk management ka bhi dhyan rakhna zaroori hai.

      Tasuki Gap Down Candlestick Pattern ko samajh kar, traders market trends aur reversals ko anticipate karne mein madad le sakte hain.
      • #4 Collapse

        Click image for larger version

Name:	download (4).png
Views:	59
Size:	4.5 کلوبائٹ
ID:	12783712

        For exit strategies,


        traders often consider taking profits when the price reaches a predetermined target or when signs of a potential reversal appear. Monitoring the volume during the third candlestick is crucial; if volume remains strong, it supports the validity of the bullish reversal.
        Remember, trading the Unique Three River pattern requires careful analysis and consideration of multiple factors, including candlestick formations, volume, and overall market conditions. Traders should practice risk management and use appropriate tools to
        enhance their decision-making process.


        Support and resistance levels play a crucial role in identifying potential reversal or continuation points in price movements. Support levels represent areas where buying support prevents the price from falling further, while resistance levels indicate points where selling pressure limits further upward movement.

        Traders can employ various tools and techniques to identify these levels:
        1. Price action analysis: Examining past price movements on a chart helps identify areas where the price reversed or consolidated significantly. These areas may act as future support or resistance levels.
        2. Trend lines: Drawing trend lines on a chart can highlight support and resistance levels. An upward-sloping trend line may act as support, while a downward-sloping trend line can serve as resistance.
        3. Moving averages: Utilizing moving averages on a chart aids in recognizing support and resistance levels by depicting the average price trend. If the price crosses above a moving average, it may act as resistance, and if it falls below, it could function as support.
        4. Fibonacci retracements: By applying Fibonacci retracements, traders can identify potential support and resistance levels based on Fibonacci sequence numbers, indicating areas where a trend change might occur.

        Incorporating support and resistance levels into trading strategies can offer valuable insights for traders. These levels often signal potential reversals or changes in trend, guiding traders in making decisions on entry and exit points.

        Some common trading strategies involving support and resistance levels include:
        1. Breakout trading: When the price breaks above a resistance level or below a support level, it generates a breakout signal. Traders use this signal to enter positions, with a break above suggesting a buy signal and a break below indicating a sell signal.
        2. Range trading: Trading within the range defined by support and resistance levels can be seen as a range trading signal. Buying when the price approaches support and selling when it nears resistance are common practices in range trading.
        3. Trend trading: Identifying the direction of the trend using trend lines helps traders make decisions. Trading in the direction of an uptrend or downtrend, based on the price's relation to the trend line, is a common trend trading strategy.


        INTRODUCTION TO THE UNIQUE THREE RIVER PATTERN :


        Unique Three River pattern, yaani "Teen Nadi" pattern forex market mein ek aisi technical trading pattern hai jo trend reversals ko pehchanne mein apni buland rawayat ke liye mashoor hai. Is pattern mein teen musalsal candlesticks hote hain jo price chart par ek mukhtalif formation banaate hain. Yeh pattern ek downtrend se uptrend ya phir ulta signal kar sakta hai. Is pattern ko "Teen Nadi" ke naam se pukara jaata hai kyunki yeh teen nadiyon ki tarah ek mukarrar rukh mein bahne ki tarah dikhta hai. Traders aksar is pattern ko talash karte hain kyunke yeh potential market reversals ke baare mein mayane daar maalumaat pradaan kar sakta hai.


        IDENTIFYING THE UNIQUE THREE RIVER PATTERN :


        Unique Three River pattern ko pehchanna ke liye traders ko teen khaas candlestick formations ki talaash karni hoti hai. Pehla candlestick lamba aur bearish hota hai jo price mein ek majboot downward move ko darshaata hai. Yeh dikhata hai ki market mein bechne wale logon ka qabza raha hai. Dusra candlestick chota aur bullish hota hai jo pehle candlestick ke close se niche khulta hai aur upar close ho jaata hai. Yeh candlestick downward move mein ek waqtanwi rok ko darshaata hai aur yeh ishara karta hai ki market mein kuch kharidne wali taqat dakhil ho sakti hai. Teesra candlestick lamba aur bullish hota hai jo dusre candlestick ke close se oopar khulta hai aur ooncha close ho jaata hai. Yeh candlestick batata hai ki trend reversal hai kyunki kharidne wale market par qabza karte hain aur price ko ooncha le jaate hain.


        THE ROLE OF VOLUME IN THE UNIQUE THREE RIVER PATTERN :

        Volume Unique Three River Pattern ko tajziya karne mein ek ahem hissa hai. Jab dusri candlestick banti hai, to traders ko uss se judi volume par tawajjo deni chahiye. Agar volume average se zyada hai, toh yeh pattern ki taqat ko tasdeeq karta hai aur trend reversal ki imkaanat ko badhata hai. Dusri candlestick par high volume yeh dikhata hai ki kharidne wali taqat market mein dakhil ho rahi hai, jo bullish reversal ko support karta hai. Saath hi, kam volume uss par aitmaad kam karta hai aur dikhata hai ki kharidne walon ki itmenaan kam hai.


        ENTRY AND EXIT STRATEGIES FOR TRADING THE UNIQUE THREE RIVER PATTERN :


        Jab Unique Three River pattern par trading karte hain, tradersdoray nadi hai pattern mein trading karte waqt, traders aksar khas dakhla aur nikalne ke tareekay istemaal karte hain takay unki munafa kay imkanat ko zyada kia ja sake. Aik aam tareeka hai ke jab teesri candlestick dusri candlestick ki high se oopar band hojaye toh aik lamba position lein. Is dakhla waqat bullish kay mukhalif hoti hai aur niche aik wazeh maqam hojata hai jahan stop-loss order

        can be placed.

        For exit strategies, traders often consider taking profits when the price reaches a predetermined target or when signs of a potential reversal appear. Monitoring the volume during the third candlestick is crucial; if volume remains strong, it supports the validity of the bullish reversal.

        Remember, trading the Unique Three River pattern requires careful analysis and consideration of multiple factors, including candlestick formations, volume, and overall market conditions. Traders should practice risk management and use appropriate tools to enhance their decision-making process.

        • #5 Collapse


          :
          download - 2023-11-27T215530.934.png

          Tasuki Gap Down Candlestick Pattern, technical analysis mein ek specific candlestick pattern hai jo price action ko interpret karne mein istemal hota hai. Yeh pattern market mein potential reversal ko indicate karta hai. Chaliye is pattern ki roman Urdu mein tafseel se samajhte hain:

          Tasuki Gap Down Candlestick Pattern Ki Tafseel:
          1. Definition (تعریف):
            • Tasuki Gap Down ek bearish reversal pattern hai. Isme three consecutive candlesticks hote hain. Pehli candlestick ek downtrend ke dauran aati hai, doosri ek gap down ke saath shuru hoti hai, aur teesri candlestick doosri ki kuch had tak cover kar leti hai, lekin overall downtrend mein rehti hai.
          2. Components (اہم حصے):
            • Pehli Candlestick (Bullish): Pehli candlestick bearish trend ke dauran hoti hai.
            • Doosri Candlestick (Bearish): Doosri candlestick gap down ke saath shuru hoti hai, jo indicate karta hai ke selling pressure mehsoos ho rahi hai.
            • Teesri Candlestick (Bearish): Teesri candlestick doosri ki kuch had tak cover kar leti hai, lekin overall bearish trend mein rehti hai. Agar iski closing price doosri se neeche hoti hai, to pattern aur bhi strong hota hai.
          3. Interpretation (تشخیص):
            • Tasuki Gap Down pattern ek potential bearish reversal ko suggest karta hai. Yeh dikhata hai ke initial selling pressure ke baad bhi bears control mein hain aur downtrend jari reh sakta hai.
          4. Trading Strategies (ٹریڈنگ چالیں):
            • Agar traders Tasuki Gap Down pattern ko dekhte hain, to woh potential short (sell) positions consider kar
          • #6 Collapse


            Tasuki Gap Down Candlestick Pattern ek technical analysis tool hai jo forex aur stock markets mein istemal hota hai. Yeh pattern market trends aur price reversals ko identify karne mein madad karta hai. Chaliye is pattern ki tafsilaat ko samajhte hain.


            Click image for larger version

Name:	images (3).png
Views:	50
Size:	13.2 کلوبائٹ
ID:	12785209


            Pattern Ki Tashkeel:

            Tasuki Gap Down pattern tashkeel mein teen mukhtalif candlesticks ko shamil karta hai. Yeh pattern ek downtrend ke baad ata hai aur bullish reversal ko darust karta hai.

            Pehla Candlestick: Pehle din ka candlestick down gap ke sath shuru hota hai, yani ke iski opening price pehle din ki closing price se neeche hoti hai.

            Dusra Candlestick:*​ Dusra candlestick pehle din ke downtrend ke neeche girta hai lekin gap down nahi hota. Iska closing price pehle din ke closing price ke qareeb hota hai.

            -Teesa Candlestick: Teesra candlestick pehle din ke closing price ke upar open hota hai. Iska closing price doosre din ke closing price ke qareeb hota hai.

            Bullish Reversal Signal:

            Jab Tasuki Gap Down pattern complete hota hai, toh ye ek bullish reversal signal provide karta hai. Yani ke downtrend ke badle uptrend ka aghaz hone wala hai. Isko dekhte hue traders apne positions ko adjust karte hain.

            Volume Ka Tafseel:​​

            Is pattern ki tafsilaat mein volume ka bhi barah-e-karam hota hai. Normally, jab ye pattern banta hai, toh volume barh jata hai, jo ke bullish reversal ko confirm karta hai.

            Entry Points Aur Stop-Loss:​​​​​​

            Traders Tasuki Gap Down pattern ko dekhte hue entry points aur stop-loss levels tay karte hain. Entry point teesre din ke candlestick ke opening price par set kiya jata hai, jabke stop-loss doosre din ke closing price ke neeche set hota hai.

            Risk Aur Reward:

            Tasuki Gap Down pattern ke istemal mein risk aur reward ka bhi khayal rakhna zaroori hai. Traders ko apne risk tolerance ke mutabiq positions open karni chahiye aur profit target tay karte waqt bhi hoshiyari se kaam leni chahiye.
            Click image for larger version

Name:	images (3).png
Views:	42
Size:	13.2 کلوبائٹ
ID:	12785210


            Let's take an example to understand Tasuki Gap Down pattern. Suppose, market mein ek downtrend chal raha hai aur ek din down gap ke sath shuru hota hai. Dusra din price neeche girti hai lekin gap nahi hota. Teesre din price upar ja kar doosre din ke closing price ke qareeb closing hoti hai. Is scenario mein, Tasuki Gap Down pattern complete hota hai aur traders ko signal milta hai ke market ka trend badalne wala hai.


            Tasuki Gap Down Candlestick Pattern ek tez aur effective tool ho sakta hai market trends ko identify karne mein. Lekin, har technical analysis tool ki tarah, isko standalone signal ke taur par na lein. Dusre confirmatory signals aur market conditions ko bhi madad hasil karne ke liye shamil karein.image wiimage widgimage widget


            There is a time to go long, a time to go short and a time to go fishing.
            ​​​​​​​

            ​​​​​​​
            • #7 Collapse

              Tasuki Gap Down candlestick pattern ek bearish continuation pattern hai jo technical analysis mein use hota hai. Yeh pattern downtrend ke during form hota hai aur price ki further decline ko indicate karta hai. Tasuki Gap Down pattern ka samajhna traders ke liye important hai kyunki yeh pattern market ke bearish sentiment aur selling pressure ko highlight karta hai.


              Tasuki Gap Down Candlestick Pattern Ka Structure


              Tasuki Gap Down pattern ka structure teen major candlesticks par based hota hai:
              1. First Candlestick: Yeh pattern ka pehla part hota hai aur ek long bearish candlestick hota hai jo market ke strong selling pressure ko indicate karta hai. Yeh candlestick downtrend ke continuation ko support karta hai.
              2. Second Candlestick: Second candlestick bhi bearish hoti hai lekin yeh pehle candlestick ke closing price se neeche open hoti hai, yani ke yeh ek gap down ke sath start hoti hai. Is candlestick ka formation market ke further bearish sentiment ko confirm karta hai.
              3. Third Candlestick: Third candlestick bullish hoti hai lekin yeh second candlestick ke body ke halfway mark se zyada upar close nahi hoti. Yeh candlestick gap fill karne ki koshish karti hai lekin complete nahi kar pati, jo market ke weak bullish sentiment ko indicate karta hai.
              Formation of Tasuki Gap Down Pattern


              Tasuki Gap Down pattern ka formation downtrend ke during hota hai aur ismein different phases include hote hain:
              1. Downtrend: Pattern ka formation downtrend ke during hota hai jab market mein selling pressure zyada hota hai aur price consistently lower lows aur lower highs bana rahi hoti hai. Yeh phase pehle bearish candlestick ke formation se start hota hai.
              2. First Candlestick Formation: Price ek strong bearish candlestick banati hai jo market ke strong selling pressure aur bearish sentiment ko indicate karta hai. Yeh candlestick previous downtrend ko support karti hai.
              3. Gap Down Opening: Second candlestick previous candlestick ke closing price se neeche open hoti hai jo gap down ko indicate karta hai. Yeh gap down market ke further bearish sentiment ko confirm karta hai aur selling pressure ko enhance karta hai.
              4. Second Candlestick Formation: Second candlestick bhi bearish hoti hai aur gap down ke baad further decline ko indicate karti hai. Yeh candlestick market ke bearish sentiment aur downtrend ke continuation ko support karti hai.
              5. Third Candlestick Formation: Third candlestick bullish hoti hai aur gap fill karne ki koshish karti hai lekin second candlestick ke halfway mark se zyada upar close nahi hoti. Yeh candlestick market ke weak bullish sentiment ko indicate karti hai aur bearish trend ke continuation ko support karti hai.
              Trading Strategis


              Tasuki Gap Down pattern ko interpret karne aur trading strategies banane ke liye kuch important points aur approaches hain:

              1. Confirmation of Pattern


              Pattern ka confirmation gap down ke baad second aur third candlestick ke formation ke through hota hai. Jab third candlestick second candlestick ke halfway mark se zyada upar close nahi hoti, to yeh bearish continuation ka strong signal hota hai. Traders ko confirmation ka wait karna chahiye taake false signals se bacha ja sake.

              2. Entry Point


              Entry point third candlestick ke formation ke baad hota hai. Jab third candlestick second candlestick ke halfway mark se neeche close hoti hai, to yeh sell signal hota hai. Entry point ko confirmation ke sath align karna zaroori hota hai taake successful trade execute ho sake.

              3. Stop-Loss Placement


              Stop-loss placement risk management ke liye bohot zaroori hota hai. Stop-loss ko third candlestick ke high ke thoda upar place karna chahiye taake unexpected price movements se bach sakein. Yeh risk ko minimize karta hai aur capital protection ensure karta hai.

              4. Take-Profit Levels


              Take-profit levels ko previous support levels ya predefined risk-reward ratio ke hisaab se set karna chahiye. Yeh profit targets set karne mein madadgar hota hai aur optimal returns achieve karne mein help karta hai.

              5. Combining with Other Indicators


              Tasuki Gap Down pattern ko dusre technical indicators ke sath combine karke zyada accurate trading decisions liye ja sakte hain.
              • Moving Averages: Moving averages ko use karke trend direction aur strength ko confirm kiya ja sakta hai. Jab pattern aur moving averages dono bearish signals dete hain, to yeh strong confirmation hota hai.
              • Volume Analysis: Volume analysis pattern ke formation aur breakout ko confirm karne mein madadgar hoti hai. High volume ke sath pattern ka formation zyada reliable hota hai aur strong bearish continuation ka indication deta hai.
              • Relative Strength Index: RSI ko use karke overbought aur oversold conditions identify ki ja sakti hain jo pattern ke signals ko confirm kar sakti hain.

              Advantages of Tasuki Gap Down Pattern


              Tasuki Gap Down pattern ke kai advantages hain jo trading decisions ko enhance karte hain:
              1. Clear Continuation Signal: Yeh pattern clear bearish continuation signal provide karta hai jo trading decisions ko simplify karta hai.
              2. Effective in Different Markets: Yeh pattern different financial markets jaise ke stocks, forex, commodities aur indices mein effective hota hai.
              3. Reliable Signals: High volume ke sath pattern ke formation aur breakout signals zyada reliable hote hain jo profitable trading opportunities create karte hain.
              4. Easy to Identify: Is pattern ko identify karna relatively easy hota hai aur beginners bhi isse efficiently use kar sakte hain.
              Limitations


              Tasuki Gap Down pattern ke kuch limitations bhi hain jo traders ko samajhne chahiye:
              1. Requires Confirmation: Yeh pattern hamesha reliable signals nahi deta aur additional confirmation ki zaroorat hoti hai taake false signals se bacha ja sake.
              2. Market Context Dependent: Pattern ka effectiveness market context aur trend ke hisaab se vary karta hai.
              3. False Breakouts: Kabhi-kabhi pattern mein false breakouts ho sakte hain jo misleading signals dete hain.


              Tasuki Gap Down pattern ek valuable technical analysis tool hai jo market mein bearish continuation ka signal deta hai. Iska use trading strategies mein trend continuation ko identify karne aur profitable trading opportunities create karne ke liye hota hai. Pattern ka structure, formation aur trading strategies ko samajhkar traders better trading decisions le sakte hain. Trading aur investing ek continuous learning process hain aur traders ko market conditions aur trends ke sath adjust karte rehna chahiye taake long-term success achieve kiya ja sake.
              • #8 Collapse

                **Tasuki Gap Down Candlestick Pattern: Ek Tafseeli Jaiza**
                Tasuki Gap Down candlestick pattern ek technical analysis tool hai jo traders ko price movements aur trend reversals ke liye signals provide karta hai. Ye pattern typically downtrend ke baad bullish reversal ke liye indicate karta hai.

                **Tasuki Gap Down Pattern Kya Hai?**

                1. **Gap Down:**
                Tasuki Gap Down pattern mein pehla candle gap down open karta hai, yani previous candle ke close se neeche open hota hai. Is gap se indicate hota hai ke selling pressure market mein dominate kar rahi hai.

                2. **Doji Candle:**
                Doosra candle Doji hoti hai jo pehle candle ke neeche aur upper open hoti hai. Ismein open aur close price almost same hoti hai lekin high aur low significant positions par hotay hain.

                3. **Bullish Candle:**
                Teesra candle bullish hoti hai jo Doji ke upper form hoti hai aur pehli candle ko cover karti hai. Ye candle bullish reversal ki shuruat ko indicate karta hai.

                **Tasuki Gap Down Pattern Ka Istemal:**

                1. **Confirmation:** Tasuki Gap Down pattern ko confirm karne ke liye traders volume aur dusre technical indicators ka bhi analysis karte hain. High volume ke saath agar ye pattern form hota hai, toh uska significance aur zyada hota hai.

                2. **Entry aur Exit Points:** Pattern ke formation ke baad traders entry aur exit points determine karte hain. Usually, jab teesri bullish candle close hoti hai, traders apni positions enter karte hain. Stop-loss levels set karne mein bhi ye pattern madadgar hota hai.

                **Trading Strategies Using Tasuki Gap Down Pattern:**

                1. **Bullish Reversal:** Tasuki Gap Down pattern bullish reversal ko signal karta hai, especially jab ye significant volume ke saath form hota hai. Traders is pattern ke signals ko follow karke long positions lete hain.

                2. **Risk Management:** High volatility ke daur mein risk management crucial hota hai. Stop-loss orders set karna aur position sizing ka dhyan rakhna Tasuki Gap Down pattern trading ke essential components hain.

                **Conclusion:**

                Tasuki Gap Down candlestick pattern ek powerful technical analysis tool hai jo traders ko potential bullish reversal signals provide karta hai. Is pattern ka sahi tareeqe se istemal karke traders market ke dynamics ko better understand kar sakte hain aur profitable trading decisions le sakte hain. Lekin, trading mein success ke liye thorough analysis, risk management, aur market ki samajh zaroori hai jo ek balanced approach provide karte hain.
                • #9 Collapse

                  Tasuki Gap Down Candlestick Pattern: Ek Jaiza


                  Muqaddama

                  Tasuki Gap Down candlestick pattern ek important technical analysis tool hai jo traders ko market trends aur potential reversals identify karne mein madad deta hai. Ye pattern typically downtrend ke baad appear hota hai aur bullish reversal ke indication ke liye use hota hai. Is article mein hum Tasuki Gap Down candlestick pattern ko detail mein samjhenge.

                  Tasuki Gap Down Candlestick Pattern Kya Hai?

                  Tasuki Gap Down pattern do candlesticks se bana hota hai aur bearish trend ke baad bullish reversal ke indication ke liye use hota hai. Is pattern mein:
                  • Pehla candle bearish trend ke baad gap down (neeche se start) open karta hai.
                  • Dusra candle gap down ke baad open hota hai aur pehle candle ke low level par close hota hai.
                  • Tisra candle bullish (upward) movement show karta hai aur doosre candle ke close level par open hota hai.
                  • Tisra candle ki close pehle candle ke halfway point ke near close hoti hai.

                  Tasuki Gap Down pattern bullish reversal ke potential signal ke liye important hota hai. Is pattern ke baad market ka upside movement expected hota hai.

                  Tasuki Gap Down Pattern Ka Istemaal
                  1. Pattern Identification: Tasuki Gap Down pattern ko identify karna traders ke liye important hota hai. Iske liye traders ko candlestick charts par specific criteria ko dekhna hota hai jaise ki gaps, open/close prices, aur candle bodies ki size.
                  2. Confirmation: Pattern ko confirm karne ke liye traders dusre technical indicators jaise ki volume analysis, Moving Averages, aur RSI (Relative Strength Index) ka istemaal karte hain. Agar dusre indicators bhi bullish signals show karte hain toh Tasuki Gap Down pattern ki reliability barh jati hai.
                  3. Entry aur Exit Points: Jab Tasuki Gap Down pattern form hota hai, toh traders entry aur exit points decide karne mein madad lete hain. Pattern ke baad buy signal generate hota hai aur traders is point par entry kar sakte hain. Stop loss levels ko set karne ke liye previous support levels ya pattern ke low price ka use kiya jata hai.

                  Tasuki Gap Down Pattern Ki Limitations
                  1. False Signals: Kabhi kabhi Tasuki Gap Down pattern false signals generate kar sakta hai, khas tor par choppy ya range-bound markets mein. Isliye pattern ko confirm karne ke liye dusre technical indicators ka istemaal zaroori hota hai.
                  2. Market Conditions: Market conditions Tasuki Gap Down pattern ke reliability par bhi asar dalte hain. Is pattern ka istemaal trending markets mein zyada effective hota hai jabke choppy ya sideway markets mein iski accuracy kam ho sakti hai.

                  Conclusion

                  Tasuki Gap Down candlestick pattern ek powerful tool hai jo traders ko bearish trend ke reversal points identify karne mein madad deta hai. Is pattern ko sahi tarah se samajh kar aur confirmatory indicators ke saath use karke traders apne trading strategies ko improve kar sakte hain. Har trader ke liye zaroori hai ke wo candlestick patterns ko recognize karne mein maharat hasil kare taki wo market movement ko better anticipate kar sake aur profitable trading decisions le sake.
                  • #10 Collapse

                    ### Tasuki Gap Down Candlestick Pattern Kya Hai?
                    Candlestick patterns forex trading mein market ki sentiment aur potential reversals ko samajhne ke liye bohot ahem hote hain. In patterns mein se ek hai **Tasuki Gap Down** candlestick pattern. Is post mein hum is pattern ke baare mein detail se baat karenge aur dekhenge ke yeh traders ke liye kaise useful hai.

                    #### Tasuki Gap Down Pattern Ki Pehchaan

                    Tasuki Gap Down pattern tab banta hai jab ek strong bearish candlestick ke baad ek gap down hota hai, aur iske baad ek bullish candlestick banti hai. Is pattern mein pehle do candlesticks ka gap third candlestick se zyada important hota hai. Iska structure kuch is tarah hota hai:

                    1. **Pehli Candlestick:** Ek long bearish candlestick jo market ki selling pressure ko darshata hai.
                    2. **Doosri Candlestick:** Is candlestick ki opening pehli candlestick se niche hoti hai, jo gap down ko darshata hai. Yeh candlestick chhoti hoti hai aur isse market ki bearish trend ki continuation ka indication milta hai.
                    3. **Teesri Candlestick:** Yeh ek bullish candlestick hoti hai jo doosri candlestick ke close hone ke baad banti hai. Is candlestick ki closing pehli candlestick ke body ke beech mein hoti hai.

                    #### Pattern Ki Importance

                    Tasuki Gap Down pattern ka analysis traders ko market ki sentiment ko samajhne mein madad deta hai. Jab yeh pattern form hota hai, to yeh darshata hai ke market mein bearish pressure abhi bhi maujood hai, lekin bullish activity bhi dikhayi deti hai. Iska matlab yeh ho sakta hai ke sellers abhi bhi dominate kar rahe hain, lekin buyers bhi market mein apni jagah bana rahe hain.

                    #### Trading Strategy

                    Tasuki Gap Down pattern ke saath trading karne ke liye, traders ko kuch key points par focus karna chahiye:

                    1. **Confirmation:** Pattern ke banne ke baad, confirmation candle ka intezar karna zaroori hai. Isse aapko pata chalega ke market ki direction kya hai.
                    2. **Stop-Loss:** Aapko apne stop-loss ko tasuki gap ke niche rakhna chahiye taake kisi bhi unexpected movement se bacha ja sake.
                    3. **Target Levels:** Target levels set karte waqt aap previous support aur resistance levels ko madde nazar rakh sakte hain. Yeh levels aapko trade exit karne mein madad denge.

                    #### Conclusion

                    Aakhir mein, Tasuki Gap Down candlestick pattern ek valuable tool hai jo traders ko market ki dynamics ko samajhne aur trading decisions lene mein madad karta hai. Is pattern ka istemal karte waqt, traders ko caution rakhna chahiye aur confirmation candles ka intezar karna chahiye. Agar aap is pattern ko sahi tarah se analyze karte hain, to yeh aapki trading strategies ko mazid behtar bana sakta hai. Trading mein success paane ke liye, is pattern ke nuances ko samajhna aur inhe apni trading plan mein shamil karna zaroori hai.
                    • #11 Collapse

                      **Tasuki Gap Down Candlestick Pattern**

                      Tasuki Gap Down ek candlestick pattern hai jo technical analysis mein kaafi ahmiyat rakhta hai. Yeh pattern aksar bearish trend ke dauran banta hai aur iski pehchaan se traders ko market ki possible direction ka andaza hota hai. Is pattern ka naam Japanese candlestick charting se aaya hai, jahan "Tasuki" ka matlab hai "to cut" ya "to slice."

                      Tasuki Gap Down tab banta hai jab market ek strong bearish candle ke baad, ek gap down ke saath khulta hai. Iska matlab hai ke market ki opening price pichli candle ki closing price se neeche hoti hai. Iske baad, ek bullish candle banti hai jo gap ke andar close hoti hai. Yeh combination market mein bearish momentum ka darshata hai lekin bullish reversal ki bhi nishani hai.

                      Is pattern ka formation jab hota hai, to isse traders ko yeh signal milta hai ke market mein kuch uncertainty hai. Agar market gap down ke saath khulta hai, to iska matlab hai ke sellers ka pressure zyada hai. Lekin jab ek bullish candle gap ke andar close hoti hai, to yeh dikhata hai ke buyers bhi market mein entry kar rahe hain.

                      Tasuki Gap Down pattern kaafi reliable hota hai, lekin iski pehchaan ke liye kuch conditions ka dhyan rakhna zaroori hai. Sabse pehle, pichli bearish candle ka size bada hona chahiye, taake market ki selling pressure ki tasveer wazeh ho. Dusra, gap down clear hona chahiye, jisse yeh pata chale ke market ne pichli closing se neeche khulta hai. Aur teesra, bullish candle ka close gap ke andar hona chahiye.

                      Yeh pattern kisi bhi time frame par ban sakta hai, lekin yeh short-term trading ke liye zyada faida mand hota hai. Traders ko chahiye ke wo is pattern ke sath dusre technical indicators ka bhi istemal karein, jaise volume analysis ya momentum indicators, taake wo behtar decision le sakein.

                      Aakhir mein, Tasuki Gap Down ek mazedar aur useful candlestick pattern hai jo bearish market conditions ko samajhne mein madad karta hai. Agar aap is pattern ko sahi tarah se samajh kar apne trading strategy mein shamil karte hain, to aap market ke changes se behter faida utha sakte hain. Is pattern ko pehchan kar aur samajh kar, aap apne trading decisions ko behtar bana sakte hain.
                       
                      • #12 Collapse

                        **Fill or Kill Orders in Trading**
                        Trading ki duniya mein, investors aur traders ko apne orders ko behtar tareeqe se manage karne ke liye mukhtalif order types ki zaroorat hoti hai. Inmein se ek khaas order hai "Fill or Kill" (FOK) order. Yeh order khas tor par un traders ke liye faydemand hota hai jo apne trades ko specific conditions ke sath execute karna chahte hain.

                        ### Fill or Kill Order Kya Hai?

                        Fill or Kill order ek aisa order hai jo tabhi execute hota hai jab poora quantity ek hi waqt par fill kiya ja sake. Agar order ka poora hissa turant fulfill nahi hota, to yeh order automatically cancel ho jata hai. Iska matlab hai ke aapko partial fills se bachne ka mauqa milta hai, jo aksar trading decisions ko mushkil bana deta hai.

                        ### Iske Faide

                        1. **Quick Execution**: FOK orders aapko turant execution ka mauqa dete hain. Agar market mein required quantity available ho, to aapka order foran execute ho jata hai.

                        2. **Market Impact Kam Karna**: Badi trades karte waqt, yeh order aapko market ko zyada affect kiye bina desired price par entry ya exit dene ki ijazat deta hai. Isse aapki trading strategy behtar hoti hai.

                        3. **Risk Management**: FOK orders se aap apne capital ko protect kar sakte hain, kyunki agar aapka order fill nahi hota, to aapko loss nahi hoga. Yeh aapko unexpected market movements se bachata hai.

                        ### Iske Nuksan

                        1. **Order Cancel Hone Ka Risk**: FOK order ki sabse badi limitation yeh hai ke agar market mein required quantity available nahi hai, to order turant cancel ho jata hai. Is wajah se kabhi kabhi aap market ki valuable opportunities kho dete hain.

                        2. **Market Volatility**: Jab market bohot volatile hota hai, to FOK orders itne effective nahi hote, kyunki price movements itne rapid hote hain ke required quantity aasani se fill nahi hoti.

                        ### FOK Order Kab Istemal Karna Chahiye?

                        - Jab aapko pata ho ke aap ek specific price level par trade karna chahte hain.
                        - Jab aap kisi badi quantity ko jaldi se buy ya sell karna chahte hain.
                        - Jab aap partial fills nahi chahte aur sirf poora order turant chahte hain.

                        ### Conclusion

                        Fill or Kill orders trading ke liye ek important tool hain. Yeh aapko trades ko manage karne mein flexibility aur control dete hain. Agar aapko fast execution aur specific price levels par entry chahiye, to FOK orders aapke liye behtar option ho sakte hain. Inka sahi istemal aapki trading strategy ko zyada effective bana sakta hai. Inhe samajh kar, aap apne trading decisions ko behter bana sakte hain aur market se behtar faida utha sakte hain.
                           
                        • #13 Collapse

                          **Trading Mein Loss Se Bachne Ke Tareeqe**
                          Trading ki duniya mein profit kamaana zaroori hai, lekin loss se bachna bhi utna hi ahmiyat rakhta hai. Har trader ko yeh samajhna chahiye ke loss ko kaise prevent kiya ja sakta hai. Yahan kuch ahem strategies di gayi hain jo aapko trading mein loss se bachne mein madad kar sakti hain.

                          ### 1. Risk Management

                          Risk management trading ka sabse ahem pehlu hai. Har trade mein aapko apne total capital ka sirf 1-2% hi risk karna chahiye. Isse agar aapko loss hota hai, to aapki overall capital par iska zyada asar nahi hoga. Stop-loss orders ka istemal karke aap apne losses ko control kar sakte hain. Yeh orders aapko market ki unfavorable movement se bachate hain.

                          ### 2. Trading Plan Banayein

                          Aapko ek detailed trading plan banana chahiye jo aapke goals, strategies, aur risk tolerance ko darshata ho. Trading plan mein aapko entry aur exit points, stop-loss levels, aur profit targets tay karne chahiye. Yeh plan aapko discipline maintain karne mein madad karega aur emotional decision-making se bachayega.

                          ### 3. Technical Analysis Ka Istemal

                          Technical analysis trading decisions lene ke liye bohot faidemand hai. Charts, indicators, aur patterns ko samajh kar aap market ki direction aur potential reversals ka andaza laga sakte hain. Is knowledge se aap behtar trading decisions le sakte hain aur risk ko kam kar sakte hain.

                          ### 4. Market News Aur Events Ko Monitor Karein

                          Market news aur economic events par nazar rakhna bhi zaroori hai. Major news releases kabhi kabhi market ko achanak move kar sakti hain. Aapko chuniye ke kaun se events aapki trading strategy ko affect kar sakte hain, aur unke aas paas trading se bachein.

                          ### 5. Emotional Control

                          Emotions trading mein bohot bada role play karte hain. Fear aur greed ka asar aapki decision-making par ho sakta hai. Aapko apne emotions par control rakhna chahiye. Agar aapko lagta hai ke aap emotionally unstable hain, to kuch waqt ke liye trading se door rehna behtar hai.

                          ### 6. Continuous Learning

                          Trading ek evolving field hai. Isliye aapko continuously seekhna chahiye. Books, webinars, aur online courses ka istemal karke apni skills aur knowledge ko behtar karna zaroori hai. Aap dusre experienced traders se bhi seekh sakte hain.

                          ### Conclusion

                          Trading mein loss se bachne ke liye effective strategies aur discipline ki zaroorat hoti hai. Risk management, trading plan, technical analysis, aur emotional control aapko is maidan mein kamiyabi dilane mein madad kar sakte hain. In techniques ka sahi istemal kar ke aap apne trading journey ko behtar bana sakte hain aur sustainable profits kama sakte hain.
                           
                          • <a href="https://www.instaforex.org/ru/?x=ruforum">InstaForex</a>
                          • #14 Collapse

                            Tasuki gap down candlestick pattern ek aisa technical analysis tool hai jo financial markets, khaaskar stock aur forex trading mein istemal hota hai. Ye pattern trend reversal ya continuation ki nishani de sakta hai, lekin isay samajhne ke liye kuch important concepts ko jaanana zaroori hai.
                            Tasuki gap down pattern tab banta hai jab market ek downtrend mein hoti hai aur is pattern ki do candlesticks hoti hain. Pehli candlestick ek bearish candle hoti hai, jo market ki downward movement ko darshati hai. Is candlestick ke baad, agle trading session mein ek gap down hota hai, matlab market ki opening price pehli candlestick ki closing price se neeche hoti hai. Is gap down ke baad, doosri candlestick ek bullish candle hoti hai, jo market mein buying pressure ko darshati hai.

                            Ye pattern khas tor par tab dekha jaata hai jab market mein bearish sentiment ho, lekin agle session mein bullish activity dekhne ko milti hai. Tasuki gap down pattern ke aate hi traders ko ye signal milta hai ke ho sakta hai market ab reversal ki taraf ja rahi ho, ya phir ye downtrend mein temporary halt hai. Is pattern ki pehchan karne ke liye zaroori hai ke gap down ke baad aane wali bullish candle ki body ki length bhi achi ho, kyunki isse market mein strength ka ehsaas hota hai.

                            Ye pattern trading strategies mein bhi kaam aata hai. Jab traders is pattern ko dekhte hain, to wo usually entry point dhundte hain, jahan wo market mein buy kar sakte hain. Lekin, ye zaroori hai ke is pattern ko dusre indicators ke sath combine kiya jaye, jaise moving averages ya volume analysis, taake trading decision ki accuracy barh sake.

                            Tasuki gap down pattern ka ek khas pehlu ye hai ke ye confirmation ke liye doosre candlestick patterns ke sath milkar dekha jaa sakta hai. Jaise agar is pattern ke baad koi bullish engulfing ya morning star pattern bhi nazar aaye, to ye confirmation hota hai ke market mein reversal ho raha hai.

                            Traders ko ye bhi dhyan rakhna chahiye ke Tasuki gap down pattern hamesha successful nahi hota. Market ki volatility aur external factors, jaise economic news ya geopolitical events, is pattern ki effectiveness ko badal sakte hain. Isliye, risk management strategies bhi istemal karna chahiye, taake losses ko control kiya ja sake.

                            Ek aur baat jo traders ko samajhni chahiye wo ye hai ke Tasuki gap down pattern ko sirf technical analysis par nahi, balki fundamental analysis par bhi focus karna chahiye. Market ki news aur economic indicators jaise unemployment rate, inflation, aur interest rates ko samajhna zaroori hai, kyunki ye factors market ke overall trend ko influence karte hain.

                            In sab baaton ko mad e nazar rakhte hue, Tasuki gap down candlestick pattern ek valuable tool hai jo traders ko market ke movements ko samajhne mein madad karta hai. Lekin isay sirf ek pattern ki tarah nahi, balki ek comprehensive trading strategy ka hissa banana chahiye. Isse traders ko na sirf entry aur exit points dhundhne mein madad milegi, balki wo market ki volatility se bhi bachi sakte hain. Tasuki gap down pattern ko samajhna aur sahi tarike se istemal karna un traders ke liye ek faida mand strategy ban sakta hai jo technical analysis mein apna expertise barhane chahte hain


                            اب آن لائن

                            Working...
                            X