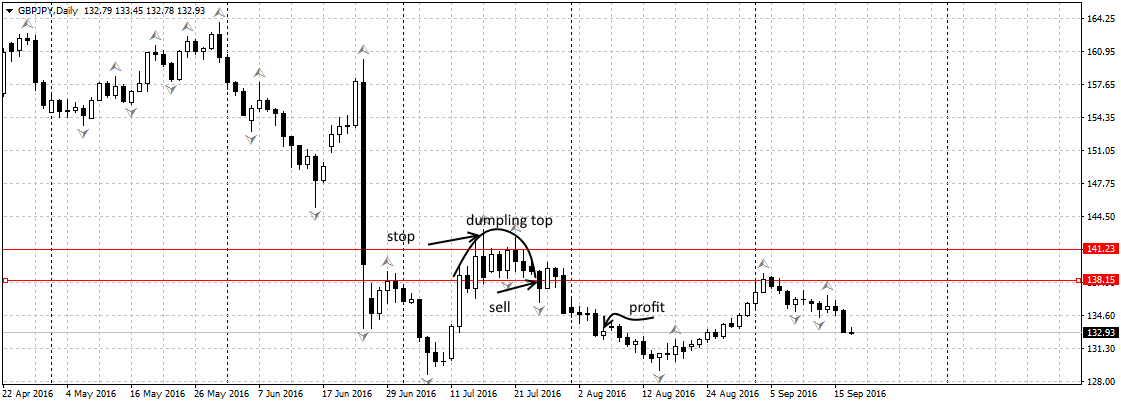
Dumpling Top Candlestick Chart Pattern

No announcement yet.
`
X
  • وقت
  • دکھائیں
Clear All
new posts
  • #1 Collapse

    Dumpling Top Candlestick Chart Pattern
    Dumpling Top Candlestick Pattern Ki Ta'aruf

    Dumpling Top Candlestick pattern ek aham technical analysis tool hai jo market trends ko identify karne mein madad karta hai. Is pattern ka appearance market mein potential trend reversal ko indicate karta hai, specifically bullish trend ke baad. Dumpling Top pattern mein ek lambi bullish candle hoti hai jo ek strong uptrend ko darust karti hai. Iske baad, doji ya small-sized bearish candle ata hai, jo market mein indecision ko represent karta hai. Teesra aur akhri candle phir se bearish hota hai aur pehle wale lambi bullish candle ko engulf karta hai, indicating ke bearish trend shuru ho sakta hai.
    Click image for larger version

Name:	images (1).png
Views:	48
Size:	7.1 کلوبائٹ
ID:	12782538
    Dumpling Top Pattern Ki Formation kaisy hoti hy

    Dumpling Top pattern ka key component hota hai pehla candle, jo ke market mein strong bullish momentum ko indicate karta hai. Iske baad ata hai doji ya small-sized bearish candle jo indecision ko show karta hai aur market mein buyers aur sellers ke darmiyan tug-of-war ko darust karta hai. Akhri candle jo bearish hota hai, engulfing the first large bullish candle, ye confirm karta hai ke bearish trend shuru ho sakta hai. Is pattern ki pehchan candlesticks ki shapes aur positioning par mabni hoti hai.
    Click image for larger version

Name:	images (2).png
Views:	40
Size:	2.3 کلوبائٹ
ID:	12782539
    Dumpling Top Pattern ki Pehchan

    Dumpling Top pattern ki pehchan karne ke liye, traders ko pehle market ki overall trend ko determine karna hota hai. Agar market uptrend mein hai, to ye pattern bearish reversal ko indicate karta hai. Is pattern mein pehla candle lamba aur bullish hota hai, doosra candle small-sized bearish hota hai, aur teesra candle phir se bearish hota hai aur pehle wale candle ko engulf karta hai. Ye pattern ko confirm karne ke liye, doosre candle ki closing price pehle wale candle ki body ke andar ya uske qareeb honi chahiye.
    Click image for larger version

Name:	images (5).jpeg
Views:	39
Size:	27.9 کلوبائٹ
ID:	12782540
    Dumpling Top Pattern Ka Istemal trading main

    Dumpling Top pattern ka istemal traders ko advance mein indicate karta hai ke market mein bearish trend shuru ho sakta hai. Jab ye pattern confirm hota hai, to traders short positions le sakte hain, expecting ke market mein bearish momentum barqarar rahega. Stop-loss orders ko set karna bhi important hai taake in case of a false signal, nuksan se bacha ja sake. Is pattern ko doosre technical indicators ke sath milake aur market analysis ke sath combine karke istemal karna behtar results dene mein madad karta hai.
  • <a href="https://www.instaforex.org/ru/?x=ruforum">InstaForex</a>
  • #2 Collapse


    Dumpling Top Candlestick Chart Pattern: Market Ki Raftar Ka Ek Nazara

    Candlestick charts, jinhein mumtazgi se samajhne wale traders istemal karte hain, market ke mazameen ko samajhne mein madad karte hain. In charts mein kuch khaas patterns hote hain jo market ke mizaj ko darust karne mein madad karte hain. Ek aham aur mukhtalif pattern jiska zikar karna zaroori hai, wo hai "Dumpling Top."

    "Dumpling Top" ek reversal pattern hai, jo ke market ke uptrend ya sideway movement ke bad hota hai. Is pattern ko samajhne ke liye, aapko candlestick charts par dhyan dena hoga.
    Click image for larger version

Name:	Dumpling-Top.jpg
Views:	44
Size:	17.7 کلوبائٹ
ID:	12782554
    Dumpling Top Kya Hai?

    Dumpling Top pattern ek group of candles hota hai jo ek dumpling (momo) ki tarah dikhta hai. Isme market mein ek strong uptrend ke baad achanak se ek barish candle hoti hai, jo ke market ke buyer's control ko darust karti hai.

    Uske baad, kuch doji ya small body wale candles ate hain, jo ke indecision ko darust karte hain. In candles mein buyers aur sellers mein equal confusion hota hai. Fir, ek lambi bullish candle aati hai, lekin iski closing pehli bullish candle ki opening se neeche hoti hai. Is se ye pata chalta hai ke buyers control mein nahin hain aur market trend badalne wala hai.

    Dumpling Top Ki Pehchan Kaise Karein?

    Dumpling Top pattern ko pehchanne ke liye, aapko market ke price action par ghaur karna hoga. Yahan kuch points hain jo Dumpling Top ki pehchan mein madadgar sabit ho sakte hain:
    1. Strong Uptrend: Dumpling Top ek strong uptrend ke baad aata hai. Pehle market mein tezi hoti hai.
    2. Barish Candle: Dumpling Top ki shuruaat ek lambi barish candle ke saath hoti hai, jo ke uptrend ko rokne ka pehla ishara hota hai.
    3. Doji ya Small Candles: Iske baad doji ya small body wale candles aate hain, jo ke buyers aur sellers ke darmiyan confusion ko darust karte hain.
    4. Bearish Candle with Lower Closing: Dumpling Top pattern ki pehchan ka aakhri hissa ek bearish candle hai, lekin iski closing pehli bullish candle ki opening se neeche hoti hai.
    Click image for larger version

Name:	en-dumpling-top..png
Views:	36
Size:	14.8 کلوبائٹ
ID:	12782555
    Trading Strategies with Dumpling Top:
    1. Sell Signal: Dumpling Top ek sell signal provide karta hai, indicating that the trend might be reversing. Traders is signal ko dekh kar short positions le sakte hain.
    2. Stop Loss: Agar aap Dumpling Top pattern par trade karte hain, toh aapko tight stop loss rakhein taki aapko zyada nuksan na ho.
    3. Confirmation: Dumpling Top ko confirm karne ke liye, aapko doosre technical indicators ka istemal bhi karna chahiye jaise ke RSI, MACD, ya trend lines.

    Conclusion:

    Dumpling Top ek powerful reversal pattern hai, lekin iska istemal karne se pehle, aapko market ko acche se samajhna hoga. Technical analysis ke saath-saath, risk management ka bhi dhyan rakhna hoga taki aap apne trades ko surakshit taur par handle kar sakein. Dumpling Top ke signals ko sahi tarah se interpret karna, market mein successful trading ke liye ek important kadam ho sakta hai.

    • #3 Collapse

      Forex Main Dumpling Top Candlestick Chart Pattern

      Forex trading mein, candlestick patterns ka use karte hue traders market ke trends aur price movements ko samajhne ki koshish karte hain. In patterns ki madad se future price movements ka andaza lagaya ja sakta hai. Aise hi ek significant pattern hai "Dumpling Top." Yeh pattern bearish reversal ka indication deta hai, yani ke market mein girawat aane wali hoti hai.
      Click image for larger version

Name:	images (2).png
Views:	25
Size:	23.0 کلوبائٹ
ID:	13004524
      Dumpling Top Pattern Kya Hai?
      Dumpling Top pattern ek multi-candlestick formation hai jo ke ek uptrend ke baad banta hai aur price reversal ki indication deta hai. Yeh pattern ek rounded top ki tarah dikhta hai, jaise ke dumpling ka shape hota hai, isi liye isey Dumpling Top kaha jata hai.

      Pattern Ki Pehchan
      Dumpling Top pattern ki pehchan karne ke liye kuch specific characteristics hain.

      1. Uptrend
      Pattern banne se pehle ek clear uptrend hona chahiye.

      2. Rounded Top Formation
      Multiple candlesticks mil kar ek rounded top shape banati hain.

      3. Decreasing Volumes
      Pattern ke doran volumes ka decrease hona bhi is pattern ka ek indicator hai.

      4. Bearish Candlestick
      Pattern ke end par ek strong bearish candlestick banti hai jo ke price reversal ko confirm karti hai.

      Pattern Ki Formation
      Dumpling Top pattern ki formation kuch stages mein hoti hai.

      1. Initial Uptrend
      Pehle ek strong uptrend hota hai jisme prices rapidly increase karti hain.

      2. Rounded Top Development
      Uptrend ke doran, price movements slow down hoti hain aur candlesticks ek rounded top shape mein banne lagti hain. Yeh indicate karta hai ke buyers ki strength kam ho rahi hai aur sellers control mein aa rahe hain.

      3. Bearish Confirmation
      Rounded top ke end par, ek bearish candlestick banti hai jo ke market mein girawat ko confirm karti hai. Yeh candlestick previous support level ko break karti hai, indicating a bearish reversal.

      Technical Indicators Ki Madad
      Dumpling Top pattern ko accurately identify karne ke liye, technical indicators ka use bhi kiya ja sakta hai.

      1. Moving Averages
      Moving averages, jaise ke 50-day or 200-day MA, trend direction aur strength ko confirm karne mein madadgar hote hain. Agar prices moving average se niche girti hain, toh yeh bearish signal hota hai.

      2. Relative Strength Index (RSI)
      RSI overbought condition ko indicate karta hai. Dumpling Top ke doran, RSI ka value 70 se upar hota hai aur phir neeche aata hai, indicating a potential reversal.

      3. Volume Analysis
      Volume analysis se market sentiment ko samjha ja sakta hai. Dumpling Top ke doran, decreasing volumes bearish reversal ko indicate karte hain.

      Practical Example
      Aayiye ek practical example dekhte hain. Suppose karte hain ke EUR/USD pair mein ek uptrend chal raha hai aur prices steadily increase ho rahi hain. Ek point par, prices rounded top pattern mein move karna shuru karti hain. Volumes bhi gradually decrease hoti hain. Phir ek strong bearish candlestick banti hai jo ke previous support level ko break kar deti hai. Yeh confirm karta hai ke Dumpling Top pattern ban chuka hai aur ab market mein girawat aane wali hai.

      Trading Strategy
      Dumpling Top pattern ko dekh kar ek effective trading strategy develop ki ja sakti hai.

      1. Entry Point
      Jab rounded top formation complete hoti hai aur bearish candlestick previous support level ko break karti hai, toh yeh ek ideal entry point hota hai short position ke liye.

      2. Stop Loss
      Stop loss ko rounded top ke highest point par set karna chahiye taake unexpected price movements se bach sakein.

      3. Profit Target
      Profit target ko previous support levels ya fibonacci retracement levels ke hisaab se set karna chahiye.

      Dumpling Top Candlestick Pattern
      Dumpling Top candlestick pattern ek valuable tool hai traders ke liye, especially jab market mein bearish reversal ka andaza lagana ho. Is pattern ko samajhne aur effectively use karne se traders apne trading decisions ko improve kar sakte hain. Lekin hamesha yaad rakhiye, technical analysis ke saath fundamental analysis bhi zaroori hai taake overall market dynamics ko achi tarah samjha ja sake.

      Additional Tips
      1. Backtesting

      Dumpling Top pattern ko historically backtest karna chahiye taake uski reliability aur effectiveness ka andaza ho sake.

      2. Combining Patterns
      Is pattern ko doosre candlestick patterns aur indicators ke sath combine karne se aur bhi strong trading signals mil sakte hain.

      3. Continuous Learning
      Forex market constantly evolve hota rehta hai, is liye continuous learning aur practice zaroori hai taake market trends aur patterns ko better samjha ja sake.
      • #4 Collapse

        Forex Main Dumpling Top Candlestick Chart Pattern ek bahut hi important aur useful chart pattern hai jo traders ko market trend ka pata lagane mein madad karta hai. Yeh pattern market mein trend reversal ya continuation ki indication deta hai aur traders ko investment decisions lene mein help karta hai. Is article mein ham Forex Main Dumpling Top Candlestick Chart Pattern ke bare mein detail se baat karenge aur isko samajhne ke liye kya factors hai.

        Headings:
        1. Introduction to Candlestick Chart Patterns
        2. What is Dumpling Top Candlestick Chart Pattern?
        3. How to Identify Dumpling Top Candlestick Pattern?
        4. Importance of Dumpling Top Candlestick Pattern in Forex Trading
        5. Trading Strategies using Dumpling Top Candlestick Pattern
        6. Conclusion

        1. Introduction to Candlestick Chart Patterns:

        Candlestick chart patterns are graphical representations of price movements in the financial market. These patterns are used by traders to analyze market trends and make informed decisions about trading. Candlestick patterns are formed by a series of price movements over a specific period of time, and each pattern has its own significance in predicting market direction.

        2. What is Dumpling Top Candlestick Chart Pattern?

        Dumpling Top Candlestick Chart Pattern is a bearish reversal pattern that occurs at the end of an uptrend. This pattern consists of a series of small-bodied candles followed by a large bearish candle that closes near the low of the previous candles. The pattern resembles a dumpling, hence the name "Dumpling Top". This pattern indicates a potential reversal in the market trend from bullish to bearish.


        3. How to Identify Dumpling Top Candlestick Pattern?

        To identify the Dumpling Top Candlestick Pattern, traders should look for the following characteristics:
        - The pattern occurs after a strong uptrend.
        - The pattern consists of a series of small-bodied candles with minimal or no wicks.
        - The final candle in the pattern is a large bearish candle that closes near the low of the previous candles.
        - The volume during the formation of the pattern should be higher than usual.

        4. Importance of Dumpling Top Candlestick Pattern in Forex Trading:

        Dumpling Top Candlestick Pattern is an important tool for forex traders as it provides valuable information about market sentiment and potential trend reversals. Traders can use this pattern to identify key levels of support and resistance, as well as entry and exit points for their trades. By analyzing the Dumpling Top pattern, traders can make informed decisions about their trading strategies and maximize their profits.

        5. Trading Strategies using Dumpling Top Candlestick Pattern:

        There are several trading strategies that traders can use with the Dumpling Top Candlestick Pattern:
        - Bearish Reversal: Traders can use the Dumpling Top pattern as a signal for a potential trend reversal from bullish to bearish. They can enter short positions when the pattern is confirmed and place stop-loss orders above the recent highs.
        - Confirmation with Indicators: Traders can use technical indicators such as RSI, MACD, and moving averages to confirm the Dumpling Top pattern. If these indicators also signal a bearish reversal, traders can have more confidence in their trading decisions.
        - Price Action Analysis: Traders can combine the Dumpling Top pattern with price action analysis to further validate their trade setups. They can look for additional candlestick patterns or chart patterns that support their trading bias.

        6. Conclusion:

        In conclusion, Dumpling Top Candlestick Pattern is a powerful tool for forex traders to analyze market trends and predict potential reversals. By understanding the characteristics of this pattern and using it in conjunction with other technical analysis tools, traders can enhance their trading strategies and improve their profitability. Traders should practice and familiarize themselves with the Dumpling Top pattern to make informed trading decisions and stay ahead of the market trends.
        Last edited by ; 24-07-2024, 10:58 AM.
        • #5 Collapse

          **Dumpling Top Candlestick Chart Pattern**
          Dumpling Top, ya dumpling pattern, ek technical analysis term hai jo stock market mein use hoti hai candlestick chart patterns ko describe karne ke liye. Ye pattern typically uptrend ke baad dikhta hai aur price reversals indicate karta hai. Is pattern ko dekhne mein, price peaks jaise dumpling ke jaise round shapes form karte hain, jo ki reversal ke indication hote hain.

          Dumpling Top pattern ki understanding ke liye, ek trader ko candlestick patterns ke basic concepts ko samajhna zaroori hai. Har candlestick ek time period ko represent karta hai, jisme price ka open, high, low, aur close data hota hai. Jab price dumpling top pattern form karta hai, to typically kuch consecutive candlesticks mein round or flat tops dikhte hain, jo ki bullish momentum ki weak signal dete hain.

          Is pattern ko spot karna traders ke liye important hai kyunki ye trend reversal ke potential signs deta hai. Agar ek dumpling top pattern form ho raha hai, to traders ko selling pressure ke increase hone ki expectation hoti hai, aur bullish trend ka weaken hone ka indication hota hai. Is pattern ko confirm karne ke liye, traders price action aur volume analysis ka use karte hain.

          Ek example ke roop mein, agar ek stock jo pehle uptrend mein tha, suddenly dumpling top pattern show karta hai, to traders cautious ho jaate hain aur future price movement ke liye monitor karte hain. Agar price support levels ko break karta hai, to ye confirmation provide karta hai ki trend reversal ho sakta hai.

          Is tarah se, dumpling top candlestick pattern ek powerful tool hai technical analysis mein jo traders ko price trends ke reversal ke early signs deta hai. Is pattern ki samajh se, traders apne trading strategies ko improve kar sakte hain aur market movements ko better predict kar sakte hain.
          • #6 Collapse

            Forex trading mein bohot se candlestick chart patterns hotay hain jo traders ko market ke potential reversals aur trends ke bare mein signal dete hain. In patterns mein se aik hai Dumpling Top candlestick pattern. Yeh pattern aik bearish reversal pattern hota hai jo ke market mein bullish trend ke baad aata hai aur yeh indicate karta hai ke market mein ab downtrend start ho sakta hai. Dumpling Top candlestick pattern aik bearish reversal pattern hai jo ke market ke bullish trend ke khatam hone aur bearish trend ke shuru hone ki nishandahi karta hai. Is pattern ka naam uske shape ki wajah se rakha gaya hai jo ke ek dumpling (aik qisam ka khana) ki tarah lagta hai. Yeh pattern forex market mein khas tor par important hota hai, kyun ke yeh traders ko signal deta hai ke market mein ab girawat shuru hone wali hai.


            Dumpling Top pattern tab form hota hai jab market mein pehle se ek strong uptrend ho aur phir gradually, price action slow ho jaye aur candles ka range narrow hone lage. Yeh pattern unhe logon ke liye bohot helpful hai jo market ke reversal ko pehchan kar apni positions close karna chahte hain ya naye bearish positions lena chahte hain.

            Dumpling Top Pattern Ka Structure
            Dumpling Top pattern ka structure kuch khas candlestick characteristics ke zariye pehchana jata hai. Yeh pattern typically kuch candles par مشتمل hota hai jo ke gradually market ke weakness ko show karti hain. Is pattern mein initial candles usually small-bodied hoti hain, jo ke indicate karti hain ke market mein momentum loss ho raha hai.

            Dumpling Top pattern ke kuch important components:

            1. Uptrend
            Is pattern ke pehle market mein ek strong uptrend hona zaroori hai. Yeh uptrend is baat ki nishandahi karta hai ke buyers market mein dominate kar rahe hain aur price ko upar le ja rahe hain. Yeh uptrend hi Dumpling Top ke formation ka initial stage hota hai.

            2. Small-Bodied Candles
            Dumpling Top pattern tab shuru hota hai jab large bullish candles ke baad small-bodied candles form hone lagti hain. Yeh small-bodied candles market ke hesitation aur momentum loss ko indicate karti hain. Iska matlab hota hai ke buyers ka control ab kamzor pad raha hai.

            3. Narrowing Range
            Jab candles ka range gradually narrow hota jata hai, toh yeh market ke compression ko show karta hai. Yeh compression is baat ka sign hota hai ke market ek potential reversal ki taraf move kar sakta hai.

            4. Bearish Confirmation Candle
            Dumpling Top pattern ka final aur most important component bearish confirmation candle hoti hai. Yeh candle typically ek large bearish candle hoti hai jo ke pattern ke baqi candles se zyada badi hoti hai. Yeh candle yeh confirm karti hai ke ab market downtrend ki taraf ja rahi hai.

            Dumpling Top Pattern Ka Istemaal
            Dumpling Top pattern ko forex trading mein bohot se tareeqon se use kiya jata hai. Yeh pattern traders ko ek early warning sign deta hai ke market mein uptrend ab khatam hone wala hai aur downtrend shuru ho sakta hai. Aayein dekhtay hain ke is pattern ka forex trading mein kaise istimaal hota hai.

            1. Reversal Identification
            Sab se pehle, Dumpling Top pattern ka main purpose market reversal ko pehchanana hota hai. Jab yeh pattern form hota hai, toh yeh traders ko signal deta hai ke market ab apne peak par pohanch chuki hai aur ab girawat shuru ho sakti hai. Yeh signal traders ko apni long positions close karne ya short positions lene mein madad karta hai.

            2. Entry Points
            Dumpling Top pattern traders ko bearish entry points identify karne mein madad deta hai. Jab yeh pattern confirm hota hai, toh yeh ek strong sell signal hota hai. Traders typically bearish confirmation candle ke close par ya uske neeche ke level par sell karte hain, expect karte hue ke market ab downtrend mein move karegi.

            3. Stop Loss Placement
            Forex trading mein risk management bohot important hoti hai, aur Dumpling Top pattern is mein bhi madadgar hota hai. Jab aap is pattern ko trade kar rahe hote hain, toh aap apna stop loss previous high ya bearish confirmation candle ke high ke upar rakh sakte hain. Is se aap apni position ko protect kar sakte hain agar market wapas bullish trend mein chale jaye.

            4. Take Profit Levels
            Dumpling Top pattern ka take profit level typically pehle ke support levels ya Fibonacci retracement levels par hota hai. Aap apni position ko manage karte hue in levels par apna profit book kar sakte hain.

            Advanced Strategies Dumpling Top Pattern Ke Saath
            Jitna Dumpling Top pattern simple lagta hai, utna hi isko advanced strategies ke saath combine karke zyada effective banaya ja sakta hai. Aayein kuch advanced strategies par bhi baat karte hain.

            1. Combining with RSI (Relative Strength Index)
            RSI ek popular momentum oscillator hai jo market ke overbought aur oversold conditions ko measure karta hai. Jab Dumpling Top pattern form hota hai aur RSI overbought zone mein hota hai (70 ke upar), toh yeh ek strong bearish signal hota hai. Yeh combination aapko zyada accurate signals de sakta hai.

            2. Volume Analysis
            Dumpling Top pattern ke saath volume analysis bhi bohot important hoti hai. Jab yeh pattern form ho raha ho aur saath mein volume decrease ho raha ho, toh yeh market ke weakness ko aur confirm karta hai. Aur jab bearish confirmation candle form hoti hai aur volume increase hota hai, toh yeh ek strong sign hota hai ke market ab downtrend ki taraf move karne wali hai.

            3. Using Multiple Time Frames
            Multiple time frames par Dumpling Top pattern ko analyze karna aik advanced technique hai. Agar aapne daily chart par yeh pattern dekha hai, toh aap lower time frames (like H4 ya H1) par bhi isko dekh sakte hain taake aapko entry points aur zyada accurately mil sakein. Yeh approach aapke trades ko zyada precise banane mein madadgar hoti hai.

            4. Support and Resistance Levels
            Support aur resistance levels ke saath Dumpling Top pattern ka istimaal karna bhi ek effective strategy hai. Agar yeh pattern ek major resistance level ke qareeb form ho raha ho, toh yeh aur zyada significant ho jata hai. Yeh resistance level aapke short trade ko zyada strong banane mein madadgar hota hai.

            5. Fibonacci Retracement
            Fibonacci retracement levels ko Dumpling Top pattern ke saath combine karna bhi aik smart move hai. Jab yeh pattern confirm ho jata hai, toh aap Fibonacci retracement levels ko use kar ke apne potential take profit levels ko define kar sakte hain. Yeh levels typically strong support zones hote hain jahan market ke reverse hone ke chances hotay hain.

            Dumpling Top Pattern Ki Limitations
            Jitna useful Dumpling Top pattern hai, utni hi iski kuch limitations bhi hain jinko samajhna traders ke liye zaroori hai. Yeh pattern har market condition mein effective nahi hota, isliye isko doosray tools aur analysis ke saath combine karna important hota hai.

            1. False Signals
            Forex market mein bohot si dafa yeh pattern false signals bhi de sakta hai, especially jab market mein bohot zyada volatility ho ya jab yeh pattern clear na ho. Isliye, sirf is pattern par rely karna theek nahi hota, balki doosray indicators aur analysis ko bhi include karna chahiye.

            2. Not Effective in Strong Trends
            Dumpling Top pattern range-bound ya weak trends mein zyada effective hota hai. Agar market mein ek strong trend ho, toh yeh pattern itna reliable nahi hota. Aise situations mein aapko trend-following strategies ko consider karna chahiye.

            3. Complexity in Real-Time Analysis
            Real-time analysis mein is pattern ko pehchanna mushkil ho sakta hai, especially agar aap ne pehle isko zyada practice nahi kiya. Market mein candles ke formations ko dekhte hue aapko yeh samajhna hoga ke kab yeh pattern form ho raha hai aur kab yeh sirf ek temporary pullback hai.

            4. Depends on Market Context
            Dumpling Top pattern ka context market conditions par depend karta hai. Har market mein yeh pattern itna effective nahi hota, aur isko doosray factors ke saath combine karna zaroori hota hai taake accurate decision-making ho sake.

            Dumpling Top Pattern Trading Strategy
            Ab jab ke aap Dumpling Top pattern ke baare mein kaafi kuch jaan gaye hain, toh yeh samajhna zaroori hai ke isko apni trading strategy mein kaise shamil kiya jaye. Aayein kuch practical steps discuss karte hain.

            1. Market Trend Analysis
            Sab se pehle market ka trend analyze karein. Dekhein ke market pehle se uptrend mein hai ya nahi. Dumpling Top pattern typically ek existing uptrend ke baad form hota hai. Agar market range-bound ya sideways ho, toh yeh pattern utna effective nahi hoga.

            2. Candlestick Patterns Ko Samjhein
            Dumpling Top pattern form hota hai bohot se candles ke zariye. In candles ke characteristics ko samajhna zaroori hai. Small-bodied candles, narrowing range, aur bearish confirmation candle in sab ko dekhna aur samajhna zaroori hai.

            3. Risk Management
            Risk management hamesha priority honi chahiye. Dumpling Top pattern ko trade karte waqt, aapko apna stop loss previous high ya bearish confirmation candle ke high ke upar set karna chahiye. Yeh aapko market ke unexpected moves se bacha sakta hai.

            4. Confluence with Other Indicators
            Dumpling Top pattern ko doosray indicators ke saath combine karna iski effectiveness ko barha sakta hai. For example, RSI, volume analysis, aur Fibonacci retracement levels ke saath isko combine kar ke aap apni trades ko zyada accurate aur profitable bana sakte hain.

            5. Backtesting
            Koi bhi nayi strategy implement karne se pehle uska backtest karna zaroori hota hai. Historical data par is pattern ka test kar ke aap dekh sakte hain ke yeh kis had tak reliable hai aur kis situation mein isko use karna chahiye.


            Dumpling Top candlestick pattern forex trading mein aik significant bearish reversal signal hai. Yeh pattern traders ko market ke top par possible reversal points identify karne mein madad deta hai, jisse ke unhe apni positions close karne ya naye bearish trades lene mein asani hoti hai. Yeh pattern apne structure aur components ke zariye market ke potential downtrend ki nishandahi karta hai, lekin isko effectively trade karne ke liye aapko market context, risk management, aur doosray indicators ka bhi istimaal karna hoga.

            Is guide mein humne Dumpling Top pattern ke structure, trading strategies, aur limitations ko detail mein discuss kiya hai. Agar aap is pattern ko apni trading strategy mein sahi tor par shamil karte hain, toh yeh aapke trading results ko improve karne mein madadgar sabit ho sakta hai. Trading mein hamesha multiple tools aur analysis ka istimaal karna chahiye taake aap apne decisions ko zyada informed aur calculated bana sakein.
            Believe in yourself and your abilities. When you fight for your dreams, you can achieve anything.
            • #7 Collapse

              Dumpling Top ek bearish reversal candlestick chart pattern hai jo indicate karta hai ke ek uptrend ya bullish market ab exhaust ho raha hai aur downside movement yani downtrend shuru ho sakta hai. Ye pattern typically tab form hota hai jab market ka momentum slow ho jata hai aur gradually lower closes dikhane lagta hai.


              Characteristics of Dumpling Top:

              Multiple Candles: Dumpling Top usually consist karta hai multiple candles ka jo rounded shape me banti hain. Yeh rounded top ke jaisa lagta hai.

              Small Candle Bodies: Is pattern mein candles ke bodies small hoti hain, aur wicks bhi short hoti hain.

              Gap Down: Is pattern ke baad ek gap down hota hai jo pattern ko confirm karta hai ke ab market bearish ho sakta hai.


              Market Sentiment:

              Before the Pattern: Market ek uptrend me hota hai.

              During the Pattern: Price gradually steady ho jata hai aur ek rounded top formation karta hai.

              After the Pattern: Price lower hona start ho jata hai aur ek gap down ke saath market reversal ka signal milta hai.

              Yeh pattern often closely related hota hai with exhaustion of buying pressure aur buyers ke weak hone ka indication deta hai.

              Click image for larger version

Name:	images - 2024-08-22T094229.104.png
Views:	18
Size:	29.1 کلوبائٹ
ID:	13097819

              Dumpling Top ke mazeed insights yeh hain ke yeh ek gradual transition ko represent karta hai from bullish to bearish market sentiment. Isme koi sharp reversal nahi hota, balki price action dheere dheere weakness dikhata hai. Here's a more detailed breakdown:


              Key Features of Dumpling Top:

              Rounded Shape:

              Price movement ek rounded top banata hai, jisme continuous upward momentum kam hota hai, aur sideways movement zyada dikhne lagta hai.

              Ye shape signify karta hai ke bullish momentum fade ho raha hai.

              Multiple Candles Forming the Top:

              Dumpling Top ka pattern commonly 3 ya zyada candles se milkar banta hai.

              Candles ki size small hoti hai, aur ismein koi aggressive movement nahi hota.

              Low Volatility During the Pattern Formation:

              Is pattern ke formation ke dauran market ki volatility kam ho jati hai.

              Buying interest kam hota hai, aur market consolidate karta hai.

              Bearish Confirmation:

              Pattern ke baad ek gap down ya bearish candle appear hoti hai jo confirm karti hai ke market ab reversal ke liye tayar hai.

              Yeh bearish candle trend ke direction ko change karne ka clear signal deti hai.


              Usage in Trading:

              Entry Point: Traders usually Dumpling Top pattern identify karne ke baad, gap down ya bearish candle ke baad short position open karte hain.

              Stop Loss: Pattern ke top ke upar stop loss place kiya jata hai taake risk manage kiya ja sake.

              Profit Target: Profit target often previous support levels ya fibonacci retracement levels par rakhte hain.


              Importance in Technical Analysis:

              Dumpling Top ek significant reversal pattern hai, lekin iske reliable hone ke liye confirmatory signals ka intezar karna zaroori hai, jaise ke gap down ya bearish breakout. Independent trading decisions is pattern pe bina confirmation ke lena risky ho sakta hai.

              Yeh pattern kaafi similar hota hai "Rounded Top" pattern se, magar Dumpling Top mein reversal usually short-term timeframe mein hota hai, jabke Rounded Top zyadatar long-term market reversals ko represent karta hai.
              • #8 Collapse

                Dumpling Top candlestick pattern aik reversal pattern hai jo usually uptrend ke baad appear hota hai aur market mein bearish reversal ka signal deta hai. Yeh pattern market mein selling pressure ke increase hone ko indicate karta hai. Neeche kuch points hain jo Dumpling Top pattern ko samajhne mein madad denge:
                ### 1. **Dumpling Top Ka Structure**
                - Dumpling Top pattern usually 3 ya us se zyada candlesticks par mushtamil hota hai.
                - Is pattern mein pehle ek bullish candle hoti hai jisme lambi body hoti hai.
                - Uske baad choti candles aati hain jinki bodies bhi choti hoti hain aur shadows bhi bohot short hote hain. Yeh candles market mein indecision ya weak buying pressure ko indicate karti hain.
                - Aakhir mein ek bearish candle hoti hai jo yeh signal deti hai ke selling pressure dominate karne laga hai.

                ### 2. **Market Sentiment Ka Indication**
                - Dumpling Top pattern market sentiment mein shift ko indicate karta hai. Pehle market mein bullish sentiment hota hai, lekin dheere dheere buying pressure kam hone lagta hai aur bearish sentiment strong hota jata hai.
                - Yeh pattern aksar us waqt banta hai jab market mein overbought conditions hoti hain, aur buyers apne positions ko liquidate karne lagte hain.

                ### 3. **Confirmation Candle Ki Ahmiyat**
                - Is pattern ko trade karne se pehle confirmation candle ka wait karna zaroori hota hai. Yeh confirmation candle usually ek strong bearish candle hoti hai jo pehle uptrend ko reverse kar deti hai.
                - Agar confirmation candle ek gap down ke sath open ho, to yeh signal aur bhi strong hota hai.

                ### 4. **Trend Reversal Ki Nishandahi**
                - Dumpling Top pattern aik strong trend reversal ka signal hota hai. Yeh pattern aapko timely exit points de sakta hai agar aap uptrend mein trade kar rahe hain.
                - Agar aap is pattern ko identify kar lete hain, to aap apne long positions ko close kar sakte hain ya phir short positions le sakte hain.

                ### 5. **Risk Management**
                - Har candlestick pattern ki tarah, Dumpling Top ko bhi risk management ke sath use karna chahiye. Aap apne capital ko protect karne ke liye stop-loss levels set kar sakte hain.
                - Risk-reward ratio ko samajhna zaroori hai, taake aap apni trades ko effectively manage kar sakein.

                ### 6. **Timeframe Ka Ahmiyat**
                - Dumpling Top pattern ko dekhne ka timeframe bohot zaroori hai. Agar yeh pattern higher timeframe par form hota hai, to iska signal zyada reliable hota hai.
                - Short-term timeframes par yeh pattern kam reliable ho sakta hai, isliye aapko apni strategy ke mutabiq isko use karna chahiye.

                ### 7. **Combination with Other Indicators**
                - Dumpling Top pattern ko doosre indicators ke sath combine karne se aapke trading signals ki accuracy barh sakti hai. Jaise ke RSI ya MACD indicators ke sath is pattern ka use karna helpful ho sakta hai.

                ### 8. **Psychological Impact**
                - Dumpling Top pattern market participants ke psychological shift ko bhi represent karta hai. Is pattern ke baad market mein panic selling ho sakti hai jo bearish trend ko aur strengthen kar deti hai.

                Yeh points Dumpling Top candlestick pattern ko samajhne aur isse trading mein istemal karne mein madad denge. Trading mein success ke liye pattern recognition aur disciplined approach bohot zaroori hai.
                • #9 Collapse

                  Dumpling top candlestick chart pattern aik technical analysis ka tool hai jo stock aur forex markets mein price reversals ko identify karne mein madad deta hai. Yeh pattern aksar ek upward trend ke baad develop hota hai aur iska naam uske shape ki wajah se hai, jo dumpling jaisa lagta hai. Is pattern ko samajhne ke liye, humein iske formation aur significance par ghore se nazar daalni hogi.
                  Dumpling top pattern mein, chaar key candlesticks hoti hain. Pehla candlestick ek strong bullish trend ko represent karta hai. Is candlestick ke baad, aik ya do chhoti si bullish candlesticks aati hain jo price ki upward movement ko continue karti hain, lekin momentum dheere dheere kam hota jata hai. Phir aik bearish candlestick aati hai jo is pattern ki shape ko define karti hai. Yeh bearish candlestick is baat ka indicator hoti hai ke market mein reversal aane wala hai. Finally, pattern ke last phase mein, aik aur bearish candlestick aati hai jo confirmation deti hai ke upward trend khatam ho gaya hai aur downward trend shuru hone wala hai.

                  Dumpling top pattern ka sabse important aspect yeh hai ke yeh pattern tabhi reliable hota hai jab iske tamam components sahi sequence mein hone. Is pattern ko identify karte waqt, trader ko yeh dekhna hota hai ke initial bullish trend kitna strong tha, aur subsequent candlesticks ka behavior kaisa raha. Agar price ke movement mein sharp changes aati hain aur volume bhi significantly badhta hai, to yeh indicate karta hai ke pattern ke confirm hone ka time aa gaya hai.

                  Dumpling top pattern ko trade karte waqt, trader ko entry aur exit points ka dhyan rakhna padta hai. Entry point pattern ke final bearish candlestick ke baad decide kiya jata hai jab price previous support level ko break karti hai. Exit point ko identify karte waqt, trader ko stop-loss orders set karni chahiye taake market ke fluctuations se bacha ja sake.

                  Is pattern ka use karte waqt, yeh bhi zaroori hai ke trader market ki overall trend aur economic factors ko bhi consider kare. Kabhi kabhi, individual patterns market ke broader context ke bina misleading bhi ho sakte hain. Isliye, dumpling top pattern ko ek part of comprehensive trading strategy ke tor par use kiya jana chahiye.

                  Dumpling top pattern ek valuable tool hai jo price reversals ko identify karne mein madad karta hai. Lekin, yeh pattern alone kisi bhi trading decision ka basis nahi banna chahiye. Iske sath sath technical indicators, market news, aur other factors ko bhi consider karna zaroori hai taake ek informed aur balanced trading decision liya ja sake.
                   
                  • #10 Collapse

                    Spinning top candlestick pattern ek aisa technical analysis tool hai jo stock aur forex markets mein price movements ko samajhne ke liye use hota hai. Ye pattern market ki uncertainty aur indecision ko represent karta hai. Is pattern ka naam "spinning top" isliye rakha gaya hai kyunki iska shape ek spinning top ki tarah hota hai, jo trading chart pe chhoti body aur lambi wicks ke saath nazar aata hai.
                    Spinning top candlestick ka body chhoti hoti hai, aur iske upar aur neeche lambi wicks hoti hain. Yeh body do colors mein ho sakti hai, chahe wo red ho ya green, lekin yeh body ke size aur wicks ke length pe depend karta hai. Red body dikhata hai ki market ne trading period ke dauran zyada girawat dekhi, jabki green body dikhata hai ki market ne trading period ke dauran zyada udaan dekhi. Lekin dono cases mein, chhoti body aur lambi wicks market ki uncertainty ko reflect karti hain.

                    Spinning top pattern ka use karte waqt investors ko yeh samajhna zaroori hai ke yeh pattern akele kuch nahi batata. Yeh pattern jab high volume aur other indicators ke sath dekha jaye to iska signal zyada reliable hota hai. Is pattern ka main point yeh hai ke market participants confused hain aur na to strong buying pressure hai na hi strong selling pressure. Iska matlab hai ke market kisi direction mein clear trend nahi dikha raha.

                    Jab spinning top pattern bullish trend ke baad aata hai, toh yeh signal de sakta hai ke trend reverse ho sakta hai. Wahi agar spinning top bearish trend ke baad aata hai, toh yeh bhi ek reversal signal ho sakta hai. Investors aur traders is pattern ko samajh kar trading decisions lete hain aur yeh pattern unko market ke possible movements ka idea dene mein madad karta hai.

                    Is pattern ko trading decisions mein include karte waqt zaroori hai ke aap other technical indicators jaise moving averages, relative strength index (RSI), aur volume analysis bhi consider karein. Yeh indicators aapko confirmation dete hain aur spinning top pattern ke signal ko zyada reliable banate hain.

                    Spinning top candlestick pattern ek powerful tool hai lekin iska effective use tabhi hota hai jab isse related other tools aur indicators ke sath analysis kiya jaye. Is pattern ka use karke traders aur investors market ki uncertainty ko samajh sakte hain aur informed decisions le sakte hain. Isliye spinning top candlestick pattern ko trading strategy mein shamil karna aur iske signals ko carefully analyze karna trading success ke liye zaroori hai


                    • <a href="https://www.instaforex.org/ru/?x=ruforum">InstaForex</a>
                    • #11 Collapse

                      Dumpling top candlestick chart pattern aik important technical analysis tool hai jo traders aur investors ko market ki reversal points identify karne mein madad deta hai. Ye pattern usually bullish trend ke baad develop hota hai aur iska naam isliye rakha gaya hai kyun ke ye dumpling ya pie ke shape ka nazar aata hai.
                      Is pattern ki pehchaan karna zaroori hai kyun ke ye market ke direction ko indicate karta hai. Dumpling top pattern aik large white candlestick ke saath start hota hai jo ke ek strong bullish trend ko represent karta hai. Iske baad, aik ya zyada small-bodied candlesticks develop hoti hain jo ke market mein uncertainty aur consolidation ko reflect karti hain. Ye choti candlesticks ek dumpling shape ka pattern banati hain jo ke pehle ke large white candlestick ke upar hoti hain.

                      Pattern ke final stage mein aik large black candlestick aati hai jo ke market ki bearish reversal ko indicate karti hai. Ye candlestick is baat ka indication hoti hai ke market mein sellers ki entry ho gayi hai aur buying pressure kam ho gaya hai. Aik successful dumpling top pattern tab consider kiya jata hai jab ye pattern aik strong uptrend ke baad complete hota hai aur uske baad large black candlestick form hoti hai.

                      Dumpling top pattern ko confirm karne ke liye traders ko pattern ke completion ke baad confirmation signals dekhne chahiye. Ye confirmation signals price action, volume changes, aur other technical indicators ke through milte hain. Volume mein increase aur price ke neeche jaane se traders ko ye confirm hota hai ke pattern complete ho gaya hai aur market mein bearish trend start ho chuka hai.

                      Is pattern ki reliability ko improve karne ke liye, traders ko additional indicators jaise moving averages, RSI (Relative Strength Index), aur MACD (Moving Average Convergence Divergence) ka use karna chahiye. Ye indicators help karte hain ke pattern ki authenticity ko validate kiya ja sake aur market trends ko accurately predict kiya ja sake.

                      Dumpling top pattern ek useful tool hai lekin isko market analysis ke saath combine karke use karna chahiye. Sirf is pattern ko dekh kar trade decisions lena risky ho sakta hai. Isliye, market conditions aur other technical signals ka bhi analysis karna chahiye taake informed decisions liye ja sakein aur risk ko minimize kiya ja sake.

                      Overall, dumpling top candlestick chart pattern market ki trend reversal ko identify karne ka aik powerful tool hai. Traders ko is pattern ko samajhne aur use effectively implement karne ke liye patience aur practice ki zaroorat hoti hai. Agar correctly identify kiya jaye to ye pattern significant profit opportunities provide kar sakta hai.


                      اب آن لائن

                      Working...
                      X