RSI Indicator ka use
No announcement yet.
X
  • وقت
  • دکھائیں
Clear All
new posts
  • #1 Collapse

    RSI Indicator ka use


    RSI Indicator ka Istemaal: Tijarat mein Asaan Raahnumai

    Tijarat mein kamyabi haasil karne ke liye, zaroori hai ke tajaweezat aur faislay ka tehqiqi taur par kiya jaye. Bohat se tajaweezati tools traders ke liye faida-mand sabit ho sakte hain, aur ek aise important tool mein se ek hai RSI Indicator.
    Click image for larger version

Name:	maxresdefault.jpg
Views:	28
Size:	132.8 کلوبائٹ
ID:	12781526
    RSI Kya Hai?

    RSI, ya Relative Strength Index, ek technical indicator hai jo market ki tawajju, aur kisi bhi tajaweezati harkat ki quwat ko samajhne mein madad karta hai. RSI market mein mojood bulls (kharidne walay) aur bears (bechne walay) ke darmiyan quwat ko nafiz karta hai. Ye indicator 0 se 100 tak ka ek scale istemal karta hai.

    RSI Ka Istemaal Kaise Karein:
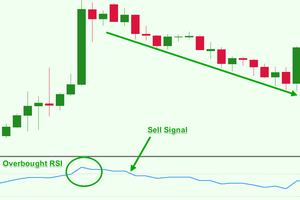
    1. Overbought aur Oversold Zones: RSI ka ek aham istemaal market mein overbought aur oversold zones ko pehchanna hai. Jab RSI 70 ke ooper chala jata hai, toh ye overbought zone ko darust karta hai, jo ke indicate karta hai ke mojooda qeemat zyada hai aur market mein istehkam ho sakta hai. Jab RSI 30 ke neeche chala jata hai, toh ye oversold zone ko darust karta hai, jisse samajhaya ja sakta hai ke mojooda qeemat kam hai aur aane wale waqt mein izafa ho sakta hai.
    2. Divergence Ka Tafseelati Mutalia: RSI ka doosra faida divergence ko tafseelati tor par mutala karna hai. Agar market mein naya high banta hai lekin RSI mein girawat hoti hai, toh ye bearish divergence hai, jo ke future mein market mein kamiyat ka ishara ho sakta hai. Umeed hai ke traders is doran behtar faislay kar sakein.
    3. RSI ke Saath Price Action Ki Tafseelat: RSI ko price action ke saath mila kar dekha jata hai takay traders ko mawafiq tajaweezat mil sakein. Agar market mein price action bullish hai lekin RSI overbought zone mein hai, toh ye hosla afzai karne wala nahi hai. Isi tarah, bearish price action ke doraan oversold RSI bhi cautious banata hai.
    4. RSI ke Saath Dusre Indicators Ka Istemaal: RSI ko dusre technical indicators ke saath istemal kar ke bhi traders apni tajaweezat ko mazeed mazbooti aur itminan ke saath le sakte hain. Moving averages aur MACD jese indicators RSI ke saath mila kar behtareen trading strategies ko paida kar sakte hain.
    Click image for larger version

Name:	RSI2_Diverg602x345.png
Views:	29
Size:	37.3 کلوبائٹ
ID:	12781527
    Ikhtetamaat:

    RSI indicator ek powerful tool hai jo traders ko market ke hawale se malumat farahem karta hai. Lekin, hamesha yaad rahe ke koi bhi indicator 100% sahi nahi hota, aur market ki tabdiliyon ke asar mein rehta hai. Traders ko chahiye ke isey samajh kar, dusre tools ke saath istemal karain aur apne trading plan ko mazbooti se execute karein. Is tarah se, RSI ka sahi istemaal kar ke traders apni tajaweezat ko behtar bana sakte hain aur nuqsaan se bach sakte hain.

  • <a href="https://www.instaforex.org/ru/?x=ruforum">InstaForex</a>
  • #2 Collapse


    RSI Indicator: Trading Mein Istemaal Ka Tariqa

    RSI yaani Relative Strength Index ek aham technical indicator hai jo ke market analysis mein istemaal hota hai. Yeh indicator market mein mojood trading opportunities ko samajhne mein madadgar hota hai aur traders ko price ki strength ya weakness ka andaza lagane mein madad deta hai. Is article mein hum RSI indicator ka istemaal samajhne aur trading mein iska behtareen istemaal karne ke tariqay par baat karenge.
    Click image for larger version

Name:	what-is-the-rsi-indicator.jpg
Views:	29
Size:	73.6 کلوبائٹ
ID:	12781534
    RSI Kya Hai?

    RSI ek momentum oscillator hai jo market ke price movements ko measure karta hai. Yeh indicator 0 se 100 tak ka scale istemaal karta hai jahan 70 se zyada ki values ko overbought aur 30 se kam ki values ko oversold conditions ka indication samjha jata hai.

    RSI Ka Istemaal Kaise Karein:
    1. Overbought Aur Oversold Zones: RSI ki madad se traders overbought aur oversold zones ko pehchan sakte hain. Jab RSI 70 ke upar chala jata hai, toh market ko overbought samjha jata hai aur yeh ishara karta hai ke price mein tezi ka khatra ho sakta hai. Jab RSI 30 ke neeche chala jata hai, toh market ko oversold samjha jata hai aur yeh ishara karta hai ke price mein girawat hone ki sambhavna hai.
    2. Divergence Ka Tariqa: RSI ko price movements ke saath mila kar dekha jata hai, jise divergence kehte hain. Agar price naye highs banata hai aur RSI naye highs nahi banata, ya agar price naye lows banata hai aur RSI naye lows nahi banata, toh yeh divergence ko darust karti hai. Divergence market ke reversals ko indicate kar sakti hai.
    3. RSI Ka Istemaal Trend Confirm Karne Mein: RSI ka istemaal trend confirmation ke liye bhi kiya ja sakta hai. Agar price aur RSI dono ek direction mein ja rahe hain, toh yeh trend ko confirm karta hai. Isse traders ko market mein hone wale changes ka behtareen andaza milta hai.
    4. RSI Aur Support/Resistance: RSI ka istemaal support aur resistance levels ko identify karne mein bhi kiya ja sakta hai. RSI ke levels ka saath dekhte hue traders support aur resistance levels ko confirm kar sakte hain.
    Click image for larger version

Name:	RSI-INDICATOR-KYA-HAI-min-1280x720.jpg
Views:	25
Size:	106.6 کلوبائٹ
ID:	12781535
    Kuch Ahem Points:
    • RSI ek lagging indicator hai, iska matlab hai ke yeh past price data par based hota hai.
    • Iska istemaal dusre technical indicators aur price action ke saath kiya jana chahiye for accurate predictions.
    • Always apne trades ko risk management ke saath karein aur RSI ko sirf ek indicator ki tarah istemaal karein, not the sole decision-maker.

    Aakhir Mein:

    RSI ek powerful tool hai jo traders ko market trends aur reversals ko samajhne mein madad karta hai. Iska sahi istemaal karne ke liye, traders ko market ke overall context ko bhi dhyan mein rakhna chahiye. Har ek indicator ki tarah, RSI ka bhi istemaal samajhdari aur research ke saath kiya jana chahiye.

    • #3 Collapse


      Understanding and Utilizing the RSI Indicator in Trading

      Introduction:


      In the dynamic world of financial markets, traders and investors constantly seek tools and indicators to help them make informed decisions. The Relative Strength Index (RSI) is one such widely used technical indicator that aids in assessing the strength and momentum of a financial instrument's price movements. Developed by J. Welles Wilder, the RSI is a versatile tool that can be applied to various trading strategies. In this article, we will explore the RSI indicator, its calculation, interpretation, and how traders can effectively use it in their trading activities.
      Click image for larger version

Name:	rsi-graph.png
Views:	20
Size:	68.3 کلوبائٹ
ID:	12781538
      Understanding R
      SI:

      The Relative Strength Index is a momentum oscillator that measures the speed and change of price movements. It is typically used in conjunction with other technical analysis tools to identify potential trend reversals or confirm existing trends. RSI values range from 0 to 100, with readings above 70 indicating overbought conditions and readings below 30 signaling oversold conditions.

      Calculation of RSI:

      The RSI is calculated using the average gains and losses over a specified period, usually 14 periods. The formula for calculating RSI is as follows:

      RSI=100−(1001+RS)RSI=100−(1+RS100​)

      Where RSRS (Relative Strength) is the average of nn days' up closes divided by the average of nn days' down closes.

      Interpreting RSI Readings:
      1. Overbought Conditions (RSI > 70): When the RSI surpasses the 70 level, it suggests that the asset may be overbought, and there is a likelihood of a price reversal or correction. Traders often view this as a signal to sell or take profits.
      2. Oversold Conditions (RSI < 30): Conversely, when the RSI falls below 30, it indicates that the asset may be oversold, and there could be a potential buying opportunity. Traders may consider this as a signal to buy or enter long positions.

      Using RSI in Trading Strategies:
      1. Trend Confirmation: RSI can be used to confirm the strength of an existing trend. If a security is in an uptrend and the RSI remains consistently above 50, it supports the bullish trend. Conversely, in a downtrend, the RSI staying below 50 reinforces the bearish momentum.
      2. Divergence: Divergence occurs when the price of an asset and the RSI are moving in opposite directions. Bullish divergence happens when the price makes lower lows, but the RSI forms higher lows, indicating a potential upward reversal. Conversely, bearish divergence occurs when the price makes higher highs, but the RSI forms lower highs, signaling a potential downward reversal.
      3. Overbought and Oversold Signals: Traders often use RSI to identify overbought and oversold conditions. However, it's crucial to note that an overbought or oversold reading alone is not a signal to trade; it should be considered in conjunction with other technical indicators or chart patterns.
      Click image for larger version

Name:	HowtoUseRSI.jpg
Views:	25
Size:	34.2 کلوبائٹ
ID:	12781537
      Conclusion:

      The Relative Strength Index is a valuable tool for traders and investors seeking to gauge the momentum of price movements and identify potential reversal points in the market. Like any technical indicator, RSI is most effective when used in conjunction with other analysis methods, risk management strategies, and a thorough understanding of the broader market context. Traders should use RSI as a part of their toolkit and not rely solely on it for decision-making, always considering the holistic picture of market dynamics.

      • #4 Collapse

        RSI Indicator ka use
        Click image for larger version

Name:	download (64).png
Views:	34
Size:	7.5 کلوبائٹ
ID:	12781699


        Relative Strength Index (RSI) ek popular technical indicator hai jo market mein overbought aur oversold conditions ko identify karne mein madad karta hai. RSI 0 se 100 tak ka hota hai aur traders iska istemal karte hain to determine karte hain ke ek particular asset ka price kitna overextended ya undervalued hai. Yahan RSI ka istemal karne ke kuch key points hain:

        RSI (ریلیٹو سٹرینگتھ انڈیکیٹر) Ka Istemal:
        1. Overbought Aur Oversold Conditions:
          • RSI 70 ke upar jane par market ko overbought kaha jata hai, jise indicate karta hai ke price ne zyada tezi se barhna shuru kar diya hai aur thoda sa pullback ho sakta hai.
          • RSI 30 ke neeche jane par market ko oversold kaha jata hai, jise indicate karta hai ke price ne zyada tezi se ghatna shuru kar diya hai aur thoda sa recovery ho sakta hai.
        2. Divergence Aur Convergence:
          • RSI ki divergence aur convergence patterns ko observe karna traders ke liye useful hota hai. Positive divergence bullish reversal ko indicate kar sakti hai, jabki negative divergence bearish reversal ko darust karti hai.
        3. Signal Generation:
          • RSI ko trading signals generate karne ke liye use kiya jata hai. Jab RSI 70 se neeche aata hai, to ye selling signal ho sakta hai, aur jab RSI 30 se upar jata hai, to ye buying signal ho sakta hai.
          • RSI ki crossover aur overbought/oversold zones ka istemal karke bhi signals generate kiye ja sakte hain.
        4. Trend Confirmation:
          • RSI ka istemal trend confirmation ke liye bhi hota hai. Agar price aur RSI dono uptrend mein hain, to ye uptrend ko confirm karta hai. Similarly, agar dono downtrend mein hain, to ye downtrend ko confirm karta hai.
        5. Hidden Divergence:
          • RSI hidden divergence ko identify karne mein bhi madad karta hai. Agar price naye highs banata hai lekin RSI naye highs nahi banata, to ye hidden bearish divergence ko darust karta hai, jo ki potential reversal signal ho sakta hai.

        RSI Ka Istemal Trading Strategies Mein:
        1. Overbought Aur Oversold Levels Ka Istemal:
          • Trading karne se pehle, RSI ke overbought aur oversold levels ka istemal karein aur unke beech mein price behavior ko observe karein.
        2. Signal Confirmation:
          • RSI ke signals ko doosre technical indicators aur tools ke saath confirm karein, jaise ke price patterns, trendlines, aur moving averages.
        3. Trend Reversals Ka Pata Lagana:
          • RSI ka istemal trend reversals ko identify karne ke liye bhi hota hai. Divergence aur convergence patterns ko dekhein.
        4. Risk Management:
          • Har trading decision mein risk management ka dhyan rakhein. Stop-loss aur take-profit levels set karein taki aap apne trades ko control mein rakh sakein.

        RSI ek versatile indicator hai, lekin hamesha yaad rahe ke kisi bhi ek indicator par poora bharosa na karein. Dusre technical indicators aur market analysis tools ka bhi istemal karein aur prudent trading practices ko follow karein.
        • #5 Collapse

          What is RSI

          The Relative Strength Index (RSI) is a momentum oscillator that measures the speed and change of price movements. It's used in technical analysis to assess whether an asset is overbought or oversold. Developed by J. Welles Wilder, the RSI is displayed as a line graph that fluctuates between 0 and 100.
          The RSI typically uses a 14-period calculation based on the average gain and average loss over that period. The formula involves finding the average gain and average loss over the specified period and then using that information to calculate the relative strength (RS) which is the ratio of average gain to average loss. The RSI is then derived from this RS value, creating an oscillator that moves between 0 and 100.

          An RSI above 70 is often interpreted as indicating that the asset is overbought, potentially due for a price correction or reversal downward. Conversely, an RSI below 30 suggests that the asset may be oversold, possibly signaling a pending upward price correction or reversal.

          Traders use the RSI to identify potential entry or exit points in the market. However, it's important to note that the RSI, like any indicator, is not foolproof and should be used in conjunction with other technical analysis tools and fundamental analysis for making trading decisions. Additionally, in strongly trending markets, the RSI can stay in overbought or oversold territory for extended periods, so it's essential to consider market conditions and other factors when interpreting RSI signals.

          How to Use RSI (Relative Strength Index)

          Partner CenterFind a Broker

          Relative Strength Index, or RSI, is a popular indicator developed by a technical analyst named , that helps traders evaluate the strength of the current market.

          RSI is similar to that it identifies overbought and oversold conditions in the market.


          It is also scaled from 0 to 100.


          Typically, readings of 30 or lower indicate oversold market conditions and an increase in the possibility of price strengthening (going up).

          Some traders interpret that an oversold currency pair is an indication that the falling trend is likely to reverse, which means it’s an opportunity to buy.

          Readings of 70 or higher indicate overbought conditions and an increase in the possibility of price weakening (going down).

          Some traders interpret that an overbought currency pair is an indication that the rising trend is likely to reverse, which means it’s an opportunity to sell.


          In addition to the overbought and oversold indicators mentioned above, traders who use the RSI indicator also look for centerline crossovers.

          A movement from below the centerline (50) to above indicates a rising trend.

          A rising centerline crossover occurs when the RSI value crosses ABOVE the 50 line on the scale, moving towards the 70 line. This indicates the market trend is increasing in strength, and is seen as a bullish signal until the RSI approaches the 70 line.

          A movement from above the centerline (50) to below indicates a falling trend.

          A falling centerline crossover occurs when the RSI value crosses BELOW the 50 line on the scale, moving towards the 30 line. This indicates the market trend is weakening in strength, and is seen as a bearish signal until the RSI approaches the 30 line.
          How to Trade Using RSI


          RSI can be used just like the Stochastic indicator.

          We can use it to pick potential tops and bottoms depending on whether the market is overbought or oversold.

          Below is a 4-hour chart of EUR/USD.


          EUR/USD had been dropping the week, falling about 400 pips over the course of two weeks.

          • #6 Collapse

            INTRODUCE OF RSI INDICATOR:

            Dear Friend's Jab bh Relatively Strengths Index (RSI) ek popularity technical indicator hai jo market mein OVERBOUGHTS aur oversold conditions ko identifying karne mein madad karta hai. RSI 0 se 100 tak ka hota hai aur traders iska istemal karte hain to determine karte hain ke ek particular asset ka price kitna overextended ya undervalued hai. Yahan RSI ka istemal karne ke kaabip Hein
            Jab bh RSI 70 ke upar jane par marketing ko overbought kaha jata hai, jise indicated karta hai ke price ne zyada tezi se barhna shuru kar diya hai aur thoda sa pullbacks Say Hi Ho Jay

            THE EXPLANATION OF RSI INDICATOR:

            Dear Friend's Ess RSI 30 ke Neeche jane par marketing ko oversold kaha jata hai, jise indicate karta hai ke price ne zyada tezi se ghatna shuru kar diya hai aur thoda sa recovery ho sakta hai.
            RSI ki divergence aur convergence patterns ko observed karna traders ke liye usefulness hota hai. Positive divergence bullish reversal ko indicate kar sakti hai, jabki negative divergence bearish reversal ko darustvkar ka Hi Trade ho jay gy

            SIGNAL GENERATION KA USE:

            Dear Ess RSI ko tradings signals generate karne ke liye use kiya jata hai. Jab RSI 70 se Neeche aata hai, to ye selling signal ho sakta hai, aur jab RSI 30 se upar jata hai, to ye Buying signal ho sakta hai.
            RSI ki crossover aur overbought/oversold zones ka istemal karke bhi signals generated asaani Say ho gy...

            TREND CONFIRMATION:

            Friends Ess RSI ka Used Trending confirmation ke liye bhi hota hai. Agar price aur RSI dono uptrending mein hain, to ye uptrend ko confirm karta hai. Similarly, agar dono downtrend mein hain, to ye downtrend ko confirmations ho Jay gy

            HIDDEN DIVORCE KA USED:

            Dear Ess RSI hiddens divergence ko identify karne mein bhi madad karta hai. Agar Price naye high-speed banata hai lekin RSI naye highs nahi banata, to ye hiddens bearish divergence ko darust karta hai, jo ki potential reversal signal say Hi Trade Len gy

            TRADING STRATEGY'S AND RSI INDICATOR;

            Dear Trader's: Ess Tradings karne se pehle, RSI ke overbought aur oversold levels ka Used karein aur unke beech mein price behavior ko observe karein.RSI ke signals ko doosre technical indicators aur tools ke saath confirmations karein, jaise ke price patterns, trendlines, say Hi RSI indicator ho Jay gay

            MOVING AVERAGE:

            Dear Friend's RSI ka Used trend reversals ko identify karne ke liye bhi hota hai. Divergence aur convergence patterns ko dekhein.
            Har trading decision mein risk management ka dhyan rakhein. Stop-loss aur take-profit levels set karein taki aap apne trades ko control mein rakh sakein.
            RSI ek versatile INDICATORS hai, lekin hamesha yaad rahe ke kisi bhi ek indicator par poora bharosa na karein. Dusre technical indicators aur market analysis tools ka bhi Used karein aur prudent trading practices ko identifying asaani Say karein gy
            • <a href="https://www.instaforex.org/ru/?x=ruforum">InstaForex</a>
            • #7 Collapse

              Relative Strength Index ek widely used momentum oscillator hai jo traders aur investors ke liye asset ki overbought aur oversold conditions ko identify karne mein madadgar hota hai. Is indicator ko J. Welles Wilder ne 1978 mein apni kitab New Concepts in Technical Trading Systems mein introduce kiya tha. RSI ki values 0 se 100 ke darmiyan hoti hain aur ye typically 14-period settings par calculate kiya jata hai. RSI ka use trading decisions lene mein kaise hota hai, isse samajhne ke liye humein iske basics, calculation, interpretation, aur trading strategies par baat karni hogi.


              RSI Indicator ke Basics


              RSI ek momentum oscillator hai jo price movements ki speed aur changes ko measure karta hai. Is indicator ka purpose asset ki current strength ya weakness ko determine karna hai. RSI ki standard calculation 14 periods par based hoti hai lekin traders apni trading style ke mutabiq is setting ko customize bhi kar sakte hain.

              Interpretation of RSI


              RSI ki values 0 se 100 ke darmiyan hoti hain aur typically ye three main regions ko indicate karta hai:
              1. Overbought : Jab RSI ki value 70 se upar hoti hai, toh asset overbought condition mein hota hai aur yahan se price reversal ya pullback ka chance hota hai.
              2. Oversold: Jab RSI ki value 30 se niche hoti hai, toh asset oversold condition mein hota hai aur yahan se price rebound ya upward movement ka chance hota hai.
              3. Neutral: RSI ki values 30 aur 70 ke darmiyan hoti hain, toh asset neutral condition mein hota hai aur significant price movements ka indication nahi hota.
              RSI Trading Strategies


              RSI indicator ko use karne ke liye kai strategies hain jo traders apni trading style aur market conditions ke mutabiq adopt kar sakte hain.

              1. Overbought and Oversold Strategy


              Ye RSI ki simplest aur most common strategy hai. Is strategy ke under, jab RSI 70 ke upar ho aur overbought condition indicate kare, toh trader sell signal consider karta hai. Similarly, jab RSI 30 ke niche ho aur oversold condition indicate kare, toh trader buy signal consider karta hai.


              2. RSI Divergence Strategy


              RSI divergence strategy ek advanced technique hai jo price action aur RSI ki movements ke darmiyan differences ko identify karne par mabni hai. Jab price new highs banaye lekin RSI new highs na banaye, toh bearish divergence hoti hai jo potential price reversal ka signal hota hai. Similarly, jab price new lows banaye lekin RSI new lows na banaye, toh bullish divergence hoti hai jo potential price reversal ka signal hota hai.


              3. RSI Trendline Break Strategy


              Is strategy ke under, RSI indicator par trendlines draw ki jati hain jo potential breakouts ko identify karne mein madadgar hoti hain. Jab RSI trendline ko break karta hai, toh ye price action mein significant change ka indication hota hai aur trade entry ka signal hota hai.


              4. RSI Swing Rejection Strategy


              RSI swing rejection strategy ek unique technique hai jo RSI ke specific movements par focus karti hai. Ismein trader RSI ke rejection points ko identify karta hai jo potential reversals ka indication hota hai. Ye typically four steps par mabni hoti hai:
              1. RSI Overbought: RSI 70 ke upar hota hai.
              2. RSI Drop Below 70: RSI 70 ke niche aata hai.
              3. RSI Bounce Back: RSI wapas 70 ke upar jane ki koshish karta hai lekin fail hota hai.
              4. RSI Break Below Previous Low: RSI previous low ko break karta hai, jo sell signal hota hai.


              Advantages of RSI Indicator

              1. Simple to Use


              RSI indicator simple aur easy to use hai. Ye quickly overbought aur oversold conditions ko identify karne mein madadgar hota hai.

              2. Effective in Ranging Markets


              RSI ranging markets mein bohot effective hota hai. Ye clear signals provide karta hai jab market sideways movement mein hota hai.

              3. Combines Well with Other Indicators


              RSI doosre technical indicators ke saath combine ho kar trading decisions ko enhance karta hai. Ye moving averages, Bollinger Bands, aur MACD ke saath mil kar strong signals generate karta hai.

              Disadvantages


              1. False Signals in Trending Markets


              RSI trending markets mein false signals generate kar sakta hai. Overbought aur oversold conditions trending markets mein accurate signals provide nahi karti.

              2. Lagging Indicator


              RSI ek lagging indicator hai kyun ke ye past price data par based hota hai. Ye current market conditions ka accurate reflection nahi de sakta.


              RSI indicator ek powerful aur versatile tool hai jo traders ko market ki overbought aur oversold conditions ko identify karne mein madad karta hai. Iska use trading strategies jese ke overbought/oversold conditions, divergences, trendline breaks, aur swing rejections mein kiya jata hai. RSI ka main advantage iska simplicity aur effectiveness hai, lekin ye trending markets mein false signals aur lagging nature ki wajah se challenges bhi pose kar sakta hai. Overall, RSI ko samajhna aur effectively use karna successful trading ke liye zaroori hai aur ye traders ko better trading decisions lene mein madadgar hota hai.

              اب آن لائن

              Working...
              X