Relative Vigor Index (RVI) Indicator
X
  • وقت
  • دکھائیں
Clear All
new posts
  • #1 Collapse

    Relative Vigor Index (RVI) Indicator
    Relative Vigor Index (RVI) Indicator kia hota hy Introduction


    Relative Vigor Index (RVI) ek technical analysis indicator hai jo stock market, forex aur commodities jaise financial markets mein istemal hota hai. Is indicator ka maqsad market trend aur price movements ki samjhne mein madad karna hai. RVI un traders aur investors ke liye khaas hai jo short-term aur medium-term price trends ko samajhna chahte hain.RVI (Relative Vigor Index) indicator short-term aur medium-term trends ko samajhne mein traders aur investors ki madad karta hai. Iska sahi istemal karke, aap market ke momentum aur price movements ko behtar tareekay se analyze kar sakte hain. Lekin, yaad rahe ke technical analysis indicators ke istemal mein training aur practice ahem hote hain, taa ke aap is ka sahi istemal kar saken.
    Click image for larger version

Name:	images.jpeg
Views:	37
Size:	51.5 کلوبائٹ
ID:	12780318

    RVI Kaise Kaam Karta Hai


    Relative Vigor Index (RVI) ka calculation price ki velocity aur relative strength par mabni hota hai. Is indicator ka formula price movements aur unke closing prices par mabni hota hai. Ye calculation bullish aur bearish trends ko samajhne mein madad deta hai. RVI indicator ka istemal kisi bhi financial market mein trends ko samajhne aur price movements ko analyze karne ke liye hota hai. Is indicator ki madad se traders aur investors market ke momentum ko samajh sakte hain. Yeh unko yeh maloom karne mein madad karta hai ke kya market bullish ya bearish direction mein ja raha hai.
    Click image for larger version

Name:	images (1).jpeg
Views:	43
Size:	74.0 کلوبائٹ
ID:	12780320
    RVI Ka Istemal Kaise Karein


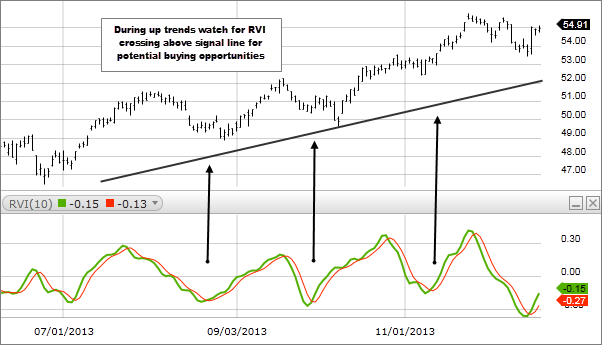
    RVI indicator ko samajhne ke liye, yeh ahem hai ke iska istemal sahi tarikay se kiya jaye. Yahan kuch mukhtasar steps diye gaye hain jo traders aur investors RVI ka sahi istemal karne mein madadgar sabit ho sakte hain. Sab se pehle, aapko price data collect karna hoga jispar RVI calculation kiya jayega. Is data mein price ki velocity aur closing prices shamil honge. RVI ka calculation price movements aur closing prices ke basis par hota hai. Is calculation se aapko RVI values milenge jo market momentum ko represent karte hain. RVI values ko samajhne ke liye, aapko iska trend aur direction dekhna hoga. Agar RVI values positive hain to yeh bullish trend ki nishandahi kar sakte hain jabkay negative values bearish trend ko indicate kar sakte hain.
    Click image for larger version

Name:	images (3).png
Views:	42
Size:	14.7 کلوبائٹ
ID:	12780321

    RVI Ka Muaqqafiyat Ke Sath Istemal

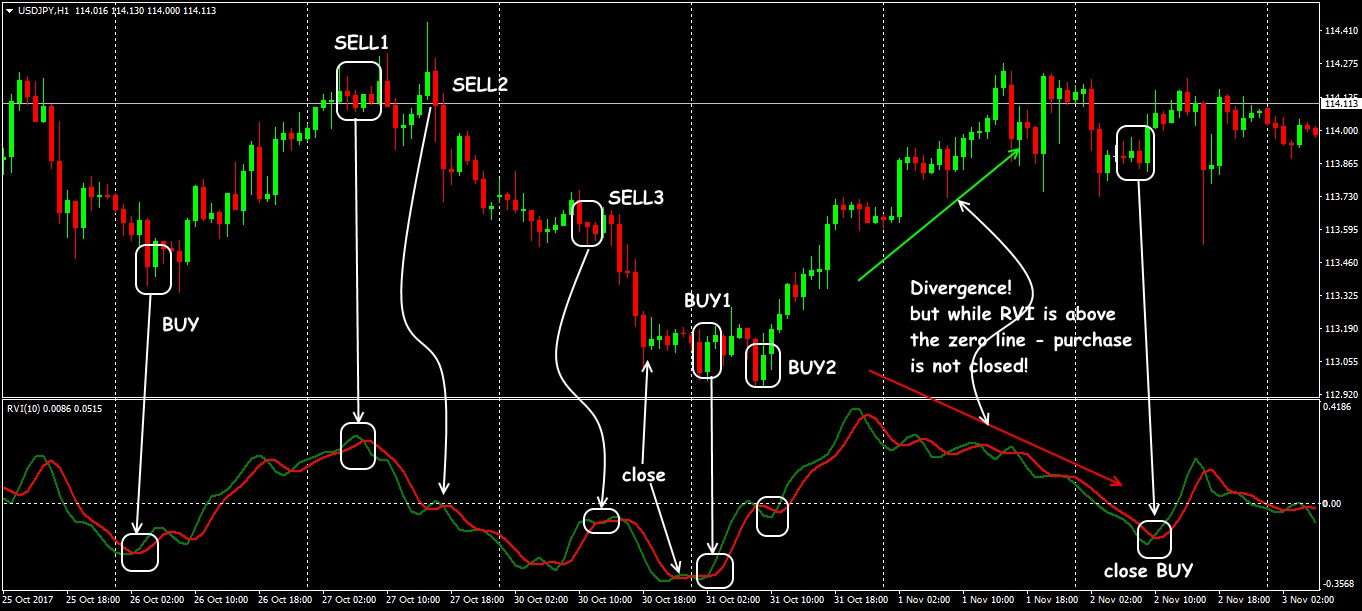
    RVI indicator ka istemal sirf data collection aur calculation se zyada hai. Aapko iska sahi interpretation aur muaqqafiyat se istemal karna hoga. Yeh kisi single indicator ki tarah istemal nahin hota, balkay dusre technical indicators aur price patterns ke saath mil kar istemal hota hai.RVI indicator ki ek ahem tareeqa divergence hai. Agar price aur RVI ke beech mein divergence nazar aaye, to yeh trend reversal ki nishandahi ho sakti hai
  • <a href="https://www.instaforex.org/ru/?x=ruforum">InstaForex</a>
  • #2 Collapse


    Relative Vigor Index (RVI) aik momentum indicator hai jo trading charts mein istemal hota hai taake traders ko market ke momentum ko samajhne mein madad kare. Yeh indicator market ke current price ki closing aur opening prices ke darmiyan ke farq ko measure karta hai.

    RVI calculate karne ke liye, kuch steps istemal hoti hain:
    1. Closing aur Opening Price Ka Farq: Pehle step mein, aap ko kisi bhi specific time period ke closing price aur usi time period ke opening price ka farq calculate karna hota hai.
    2. Positive aur Negative Price Changes: Is farq ko positive aur negative price changes mein divide kiya jata hai. Yeh farq market ki strength ko darust karne ke liye istemal hota hai.
    3. RVI Calculation: Positive aur negative price changes ko aik specific time period ke average closing price se divide kiya jata hai. Yeh calculation RVI ka value deta hai.

    RVI indicator 0 se 100 tak ke range mein hota hai. Usually, iska use overbought aur oversold levels ke determine karne mein hota hai. Agar RVI 70 se zyada ho, toh yeh indicate karta hai ke market overbought ho sakta hai aur agar 30 se kam ho, toh yeh oversold market ko show karta hai.

    Yeh indicator market ke momentum ke changes ko detect karne mein madadgar hota hai, jisse traders ko potential buy ya sell signals milte hain. Lekin, yeh ek indicator hai aur isko kisi aur indicator ya analysis ke saath istemal karna zaroori hota hai trading decisions ke liye.


    https://www.google.com/imgres?imgurl=https%3A%2F%2Fwww.forextraders.com%2 Fwp-content%2Fuploads%2F2016%2F11%2Fresizedimage600450-meta4ff.png&tbnid=J35HWUtqiTejeM&vet=12ahUKEwjHwJ3 ftcuCAxX2vicCHWXwArcQMygFegQIARBT..i&imgrefurl=htt ps%3A%2F%2Fwww.forextraders.com%2Fforex-education%2Fforex-indicators%2Frelative-vigor-index-indicator-explained%2F&docid=uVPYTwe9HGR7xM&w=600&h=450&q=Re lative%20Vigor%20Index%20(RVI)%20Indicator&ved=2ah UKEwjHwJ3ftcuCAxX2vicCHWXwArcQMygFegQIARBT
    • #3 Collapse

      What is the Relative Vigor Index Indicator?


      general energy list markr ( ya are v aayi pwayntr ) aik oscilater hai jo laagat ke iqdaam ke peechay taaqat ko check karta hai. is ki koshish hoti hai ke market ke rujhan ke liye aik dastor-ul-amal diya jaye, is iqdaam ke assar ko barqarar rakhnay ke liye - ya laagat mein kami par allag honay ke liye .


      How does the indicator do this?


      yeh is usool par munhasir hai ke barhatay hue karobari shobay mein, hum tawaqqa karte hain ke aakhri laagat tawazun par aur aam usool ke tor par, ibtidayi laagat se ziyada honi chahiye. isi terhan, aik girtay hue karobari shobay mein, hum tawaqqa karte hain ke aakhri laagat, aik usool ke tor par, ibtidayi laagat se kam honi chahiye. majmoi tor par, is ke markaz mein, yeh markr yeh jhanchne ki koshish karta hai ke aaya market mein taizi hai ya kirdaar mein manfi .


      yeh kisi alay ki aakhri qader aur is ke khilnay ke darmiyan bahami talluq bana kar karta hai. is baat ko mad e nazar rakhtay hue ke yeh aala ki nai laagat ki had ko kis terhan daikhta hai, rvi is iqdaam ke peechay' oomph' ka mayaari tanasub deta hai. is se hamaray nuqta nazar ko taleem dainay mein madad mil sakti hai ke hum kis terhan tawaqqa karte hain ke market ko agay barhna chahiye. is qabil qader salahiyat ka matlab yeh hai ke rvi ko aik fa-aal Ansar ke tor par nishaan zad kya gaya hai .


      Relative Vigor Index Calculation Method


      hum mukhtalif pishrfton ke zariye rvi markr ki ginti karte hain. markaz ka marhala sath wali shart ko istemaal karte hue zaroori rvi izzat ki ginti kar raha hai :


      rvi = ( qareebi - khula ) / ( aala - kam )

      hum is ko allag karne ke baray mein kaisay? masawaat ikhtitami laagat aur ibtidayi qader ke darmiyan tazaad ko le rahi hai - aur is ke baad usay muddat ke douran tabadlay ki had tak mamool par laa rahi hai. is ke baad hum, is waqt,' an' adwaar ke douran' seedhay harkat Pazeer normal' ( sma ) ke zariye –apne rvi ke upside ko hamwar karte hain. yeh hamari bunyadi rvi oscilater line hai. yeh metatrader mein green line ke tor par zahir hota hai, jaisa ke hum mandarja zail segments mein dekhen ge .


      rvi pwayntr ki mutadid kasmain, sach kaha jaye, dugna hamwar karte hain. yeh sab se pehlay yaksaa wazan walay mehdood muharrak radd amal ( fir ) channel ka itlaq karta hai, aur is ke baad' n' adwaar se ziyada ki darmiyani qader payi jati hai. is ka sahih nizaam khaas tor par malomati nahi hai, lehaza hum is mein geherai se jana chore den ge. bunyadi tor par, channel ka nuqta oscilater ke stage patteren ko laagat dayagram ke stage patteren ke liye aik aala hum mansab banana hai .


      samajhney ke nuqta nazar ka ahem miyaar yeh hai ke rvi ( qareebi khulay ) se ( oonchai se kam ) ke tanasub ko barqarar rakhta hai. mandarja zail marhala aik sign line banana hai. hum is ke masawi f aayi are channel ko rvi eqdaar par laago kar ke aisa karte hain - 4 adwaar se ziyada rvi qadron ka aik yaksaa wazni harkat Pazeer normal. metatrader 4 primaray rvi line ki terhan ki khaka par surkh rang mein sign line plot karta hai .


      general life pwayntr ke liye takhmeenah laganay ki hikmat e amli mukammal tor par is terhan ki hai jis ka istemaal stochastic oscillator ke liye kya jata hai, jo aik aur ghair mamooli Maroof markr hai. stochastic oscillator mein din ki kam qeemat ke bar aks laagat shaamil hoti hai. is ke bar aks, rvi mein din ki bulandi ke bar aks laagat shaamil hoti hai, jaisa ke hum ne dekha hai .


      fi al haal, yeh farz karte hue ke aap pareshan hain ke oopar diye gaye andazay zaroorat se ziyada mulawis nazar atay hain, zara aaraam se bathain. aik pwayntr kaisay kaam karta hai is ke peechay zaroori mayarat ko samjhna qeemti hai, phir bhi meeta tridr 4 ke zariye haqeeqi compotetional wazan ko mukammal tor par nimta jata hai .


      Using the RVI Indicator in MetaTrader 4


      mt4 mein rvi ko shaamil karna wazeh hai. rvi is ke mayaari markr mein se aik ke tor par stage ke sath pack kya jata hai, lehaza aap ko pwayntr ke liye mukhtalif down load ke sath pareshan honay ki zaroorat nahi hai. farz karen ke aap ne –apne gadget par mt4 muta-arif karaya hai, aap bilkul tayyar hain. aap ko sirf mt4 ke' pilot' mein' oscillators' organisers mein talaash karna hoga, jaisa ke neechay tasweer mein dekhaya gaya hai :
      • #4 Collapse

        Relative Vigor Index (RVI) Indicator

        Click image for larger version

Name:	download (6).jpeg
Views:	53
Size:	15.2 کلوبائٹ
ID:	12780401

        "Relative Vigor Index (RVI)" ek technical indicator hai jo financial markets mein istemal hota hai taake stock price trends ko samajhne mein madad kare. Yeh indicator primarily momentum-based hai, aur traders ko market strength aur potential trend reversals ke bare mein malumat farahem karta hai.

        RVI ki calculation price ke variations aur trading volume par mabni hoti hai. Yeh indicator typically 14-period ka hota hai, lekin iski length customize ki ja sakti hai tajaweez ke mutabiq.

        RVI ka formula yeh hota hai:

        ���=�����−�������ℎ−���RVI=High−LowClose−Open​

        Is formula mein:
        • �����Close hai current period ka closing price.
        • ����Open hai current period ka opening price.
        • ���ℎHigh hai highest price during the period.
        • ���Low hai lowest price during the period.

        RVI ki values usually -1 se +1 ke darmiyan hoti hain. Positive values bullish momentum ko indicate karte hain jabke negative values bearish momentum ko show karte hain.

        Yeh indicator primarily do tarah se istemal hota hai:
        1. Divergence or Confirmation: RVI ko price chart ke saath dekha jata hai taake kisi trend ko confirm kare ya phir divergent indications dekhe. Agar RVI uptrend mein hai jab ke price downtrend mein hai, toh yeh divergence ho sakti hai aur trend reversal ki possibility ko point out kar sakti hai.
        2. Overbought ya Oversold Conditions: RVI ko overbought (jab market mein zyada khareedari ho rahi hai) ya oversold (jab market mein zyada farokht ho rahi hai) conditions ko identify karne ke liye bhi istemal kiya ja sakta hai. Is tarah se traders ko potential reversal points mil sakte hain.

        Yeh important hai ke RVI ko dusre technical indicators aur market conditions ke saath mila kar istemal karna chahiye, aur iske signals ko confirm karne ke liye dusre tools ka bhi istemal karna zaroori hai. Trading mein hamesha risk management ko mad-e-nazar rakhna bhi bohot zaroori hai.
        • #5 Collapse


          RELATIVE VIGOR INDEX INDICATOR DEFINITION

          Relative vigor index Ek technical indicator hai Jo current market Mein energy level ya Josh ko establish karne ke liye use Hota Hai Jab market Upar hoti hai bull closing Hone Wali price generally market ki opening price Se zyada Hoti Hai Jiske opposite down bear market ke liye true Hota Hai yah is concept per based Ek oscillator hai ke prices up trend mein open se higher aur down trend mein open se lower close hoti hai market ke open aur close hone Ke Darmiyan price ki level mein Hone Wali movement ka analyze karne ke liye relative vigor index ka estemal karte hue aur uska comparing bad ke aur preceding days Ke dauran Hasil hone wale result se Kar Ke Hum market ki overall vigor Ka Pata Lagane ke able Hote Hain take better ho sake Kuchh trend ke out com ki predict Karte Hain


          HOW TO TRADE WITH THE RELATIVE VOGOR INDEX INDICATOR

          jis time green and red lines aapas Mein hoti hai consider karne ke liye sabse clearest points tab Hote Hain Jab green line Maximum yeah minimum tak reaches hai to yah Hamen market Mein Bullishness se Bearishness Tak ya Iske versa Hone Wali change ke bare mein inform karti hai Agar Ham sirf green line ko look rahe hote hain To Hamen know Nahin Hota ke yah kab occurred hue jab Tak ke UN per react Zahir hone Mein Too late Na Ho Jaaye signal line Hamen cross over provide karti hai Jo Umeed ke sath, timely manner main Un key turning points ko sign post Kare


          RELATIVE VIGOR INDEX CALCULATION METHOD

          Ham Kai step kah rahi hai RVI indicator ka calculate Lagate Hain core step following equation ka using karte hue basic RVI value ka calculating laga raha hai

          RVI = ( close - open) / (high- low) formula closing price and opening price ke Darmiyan difference ko looking hai - aur phir usei period Ke dauran trading range Tak normalising per La raha hai Iske bad Ham simple moving average SMA ke jarie N period RVI value ko smooth Karte Hain
          • #6 Collapse

            Relative Vigor Index (RVI) Indicator

            Click image for larger version

Name:	images (1).jpeg
Views:	34
Size:	10.1 کلوبائٹ
ID:	12780611

            Relative Vigor Index (RVI) ek technical analysis indicator hai jo market momentum ko measure karne mein madad karta hai. Iska maqsad hai ke ye maloom kare ke current price movement market ke overall momentum ke mutabiq hai ya nahi. Chaliye is indicator ko roman Urdu mein samajhte hain:

            Relative Vigor Index (RVI) Indicator:
            1. Kya Hai:
              • Relative Vigor Index (RVI) market momentum ko evaluate karne ke liye istemal hota hai.
              • Ye indicator market ke strength aur direction ko samajhne mein madad karta hai.
            2. Kaise Kaam Karta Hai:
              • RVI ka calculation price ki closing aur opening prices ke farq par mabni hota hai.
              • Ismein positive aur negative values hote hain, jo ke market momentum ko represent karte hain.
            3. Interpretation:
              • Agar RVI ki value positive hai, to ye indicate karta hai ke current price movement nisbatan strong hai aur bullish trend ka support mil sakta hai.
              • Agar RVI ki value negative hai, to ye indicate karta hai ke current price movement nisbatan weak hai aur bearish trend ka support mil sakta hai.
            4. Overbought aur Oversold Conditions:
              • Jaise ke doosre oscillators, RVI bhi overbought aur oversold conditions ko darust karta hai.
              • Overbought conditions mein, RVI ki value zyada hoti hai aur ye indicate karta hai ke market mein buying pressure ki ziada ho sakti hai.
              • Oversold conditions mein, RVI ki value kam hoti hai aur ye indicate karta hai ke market mein selling pressure ki ziada ho sakti hai.
            5. Divergence aur Confirmation:
              • RVI ko doosre technical indicators ke saath dekha jata hai, jaise ke price action, trend lines, aur doosre oscillators.
              • Divergence, jisme RVI ki direction price movement se mukhtalif ho, ek potential reversal indicator ho sakta hai.
            6. Trading Strategies:
              • Traders RVI ko dekhte hain taki woh market momentum ko understand kar sakein.
              • Overbought ya oversold conditions ke saath-saath, RVI ki direction aur divergence ko dekhte hue trading decisions liye ja sakte hain.

            Yaad rahe ke har ek indicator ki tarah, RVI bhi kisi single indicator par pura bharosa na karein. Hamesha doosre technical tools aur market context ko bhi madde nazar rakhein aur apne trading decisions ko achhi tarah se plan karein.
            • #7 Collapse


              Relative Vigor Index (RVI) ek technical indicator hai jo market strength aur trend direction ko evaluate karne mein madad karta hai. Ye indicator primarily momentum ko measure karta hai aur traders ko market ke potential reversals aur trend changes ke hawale se insights deta hai. Is post mein, hum Relative Vigor Index (RVI) Indicator ke baray mein 500 lafzon mein baat karenge.

              RVI Kya Hai:

              Relative Vigor Index (RVI) ek oscillator hai jo market ki strength aur momentum ko quantify karta hai. Iska maqsad hai market trends ke hawale se traders ko information pradan karna. RVI William Blau ne develop kiya tha.


              Interpretation:

              RVI values zero ke around fluctuate karte hain. Positive values indicate buying pressure aur negative values selling pressure ko darust karte hain. High RVI values strong buying pressure aur potential overbought conditions ko darust karte hain, jabke low values indicate weak buying pressure ya potential oversold conditions ko represent karte hain.

              Overbought Aur Oversold Conditions:

              RVI ko overbought aur oversold conditions ko identify karne ke liye istemal kiya ja sakta hai. Jab RVI ki value high hoti hai, to ye indicate karta hai ke market overbought ho sakta hai aur trend reversal hone ka chance hai. Jab RVI ki value low hoti hai, to ye oversold conditions aur potential trend reversal ko suggest karta hai.

              Signal Line:

              RVI ke sath ek signal line bhi hoti hai jo RVI ke values ka smooth average hota hai. Isse traders ko trading signals milte hain. Agar RVI line signal line ko upar se cross kare, to ye ek buy signal hai, jabki agar niche se cross kare, to ye ek sell signal hai.

              Divergence Aur Confirmation:

              RVI ka istemal divergence aur confirmation ko identify karne mein bhi hota hai. Agar price aur RVI mein divergence hoti hai, to ye indicate kar sakta hai ke current trend weak ho sakta hai aur reversal hone ka chance hai. Isme confirmation ke liye doosre technical indicators ka bhi istemal kiya ja sakta hai.


              RVI ko trading strategies mein incorporate kiya ja sakta hai. Buy aur sell signals ke alawa, traders RVI ki madad se trend strength ko bhi evaluate kar sakte hain. Iske alawa, RVI ke sath doosre technical indicators jese ki moving averages aur trendlines ka bhi istemal kiya ja sakta hai.

              Limitations:

              Jaise har technical indicator ki tarah, RVI ka bhi istemal prudent decision-making ke sath hona chahiye. Market conditions aur price action ke mukhtalif pehluon ko samajhne ke liye doosre indicators aur tools ke sath RVI ka istemal kiya ja sakta hai.

              Conclusion:

              Relative Vigor Index (RVI) Indicator, market trends, momentum, aur potential reversals ko samajhne mein madadgar ho sakta hai. Lekin, iska istemal karne se pehle traders ko market ke overall context aur doosre indicators ka bhi tajaweezat ke sath istemal karna chahiye. RVI ke sath prudent risk management aur thorough analysis se traders apne trading decisions ko mazbooti se support kar sakte hain.


              There is a time to go long, a time to go short and a time to go fishing.
              ​​​​​​​

              ​​​​​​​
              • #8 Collapse

                Relative vigor index indicator :

                Relative Vigor Index (RVI) indicator kya hai, ye ek technical analysis tool hai jo price movement aur volume ke beech ke correlation ko measure karta hai. Is indicator ki madad se traders price trends aur market strength ko samajh sakte hai. RVI indicator ko use karke traders market ke momentum aur reversals ko identify kar sakte hai. Ye indicator bullish aur bearish signals provide karta hai jo traders ko buy aur sell decisions lene me madad karta hai.

                Click image for larger version

Name:	RVI indicator.jpeg
Views:	12
Size:	33.0 کلوبائٹ
ID:	12789808

                ​​​​​​Trading with RVI indicator :

                Relative Vigor Index (RVI) indicator ke saath trade karne ke liye aap kuch steps follow kar sakte hai:

                1. RVI ki interpretation:

                RVI indicator ko samajhne ke liye, aapko iske signals aur patterns ko interpret karna hoga. RVI indicator positive aur negative values deta hai, jiske through aap price movement aur market strength ko samajh sakte hai.

                2. Entry aur exit points ka tay karna:

                RVI indicator aapko entry aur exit points ke liye signals provide karta hai. Jab RVI indicator positive values deta hai, tab ye bullish signal hai aur aap long positions le sakte hai. Jab RVI indicator negative values deta hai, tab ye bearish signal hai aur aap short positions le sakte hai.

                3. Confirmation ke liye dusre indicators ka use kare:

                RVI indicator ke saath, aap dusre technical indicators ka bhi use kar sakte hai jaise ki moving averages, trend lines, aur support/resistance levels. Ye aapko RVI ke signals ko confirm karte hai.

                4. Risk management:

                Hamesha apne trades me risk management ka dhyan rakhe. Stop-loss orders ka use kare aur apne trades ki position size ko control kare.

                5. Practice kare:

                RVI indicator ko samajhne aur uske saath trade karne ke liye practice karna bahut important hai. Demo account par practice kare ya fir small position sizes ke saath live trading start kare.

                Characteristics of RVI indicator :

                Relative Vigor Index (RVI) indicator ke characteristics:


                1. Price aur volume correlation:

                RVI indicator price movement aur volume ke beech ke correlation ko measure karta hai. Isse aapko market strength aur price trends ke beech ka relationship samajhne me madad milti hai.

                2. Bullish aur bearish signals:

                RVI indicator bullish aur bearish signals provide karta hai. Jab RVI indicator positive values deta hai, tab ye bullish signal hai aur price ke upar ka movement indicate karta hai. Jab RVI indicator negative values deta hai, tab ye bearish signal hai aur price ke neeche ka movement indicate karta hai.

                Click image for larger version

Name:	Relative vigor index indicator.jpeg
Views:	23
Size:	52.7 کلوبائٹ
ID:	12789807

                3. Momentum aur reversals ko identify karna:

                RVI indicator ki madad se aap market ke momentum aur reversals ko identify kar sakte hai. Positive RVI values strong buying pressure aur uptrend ko indicate karte hai. Negative RVI values selling pressure aur downtrend ko indicate karte hai.

                4. Entry aur exit points:

                RVI indicator aapko entry aur exit points ke liye signals provide karta hai. Jab RVI line signal line ko cross karke upar jaata hai, tab ye buy signal hai. Jab RVI line signal line ko cross karke neeche jaata hai, tab ye sell signal hai.

                5. Divergence:

                RVI indicator divergence ko bhi detect kar sakta hai. Agar price higher highs banata hai aur RVI lower highs banata hai, ya fir price lower lows banata hai aur RVI higher lows banata hai, tab ye divergence signal ho sakta hai.
                Last edited by ; 11-12-2023, 10:05 AM.
                • <a href="https://www.instaforex.org/ru/?x=ruforum">InstaForex</a>
                • #9 Collapse

                  The Relative Vigor Index (RVI) is a momentum oscillator used in technical analysis to measure the strength of a trend and identify potential trend reversals. It was developed by John Ehlers and introduced in the January 2002 issue of "Technical Analysis of Stocks and Commodities" magazine.

                  Here are the key components and concepts associated with the Relative Vigor Index:

                  Calculation:

                  The RVI is calculated based on the following formula:
                  RVI=Close-Open/High-Low
                  where:
                  • Close is the closing price
                  • Open is the opening price
                  • High is the highest price during the period
                  • Low is the lowest price during the period
                  Signal Line:

                  The RVI is often accompanied by a signal line, which is a simple moving average (SMA) of the RVI values. The signal line helps smooth out the RVI values and generate trading signals.

                  Interpretation:

                  When the RVI crosses above its signal line, it may be interpreted as a bullish signal, suggesting that buying pressure is increasing.
                  Conversely, when the RVI crosses below its signal line, it may be considered a bearish signal, indicating that selling pressure is strengthening.

                  Overbought and Oversold Conditions:

                  Similar to other momentum oscillators, the RVI can be used to identify overbought and oversold conditions. Values above a certain threshold may suggest overbought conditions, while values below a threshold may indicate oversold conditions.

                  Divergence:

                  Traders also look for divergence between the RVI and price movements. For example, if the price is making new highs but the RVI is not confirming these highs, it could be a sign of potential weakness in the trend.

                  Trend Confirmation:

                  The RVI is often used to confirm trends observed in price movements. If the RVI is moving in the same direction as the price trend, it suggests that the trend is strong and likely to continue.
                  As with any technical indicator, it's important for traders to use the Relative Vigor Index in conjunction with other tools and analysis methods. It's also advisable to consider market conditions, news events, and other factors that may impact price movements.

                  اب آن لائن

                  Working...
                  X