What is harmonic price chart pattern

No announcement yet.
`
X
  • وقت
  • دکھائیں
Clear All
new posts
  • #1 Collapse

    What is harmonic price chart pattern
    Hormonic Price Chart pattern kia hy

    traders aur investors ko price charts par patterns ke liye search karna hota hai. Ye patterns, price movements aur Fibonacci ratios ke correlation ke basis par create kie jate hain aur price movements ko predict karne ke liye use kie jate hain.Hormonic Price Chat Pattern, trading mein bohat ahem rol ada karta hai. Iss pattern ko samajhna traders kay liye zaroori hai, kyunki iss say unko market trend ka pata chalta hai aur woh trading decisions bhi sahi tareeqay se le saktay hain.Hormonic Price Chat Pattern mein, prices aik specific sequence mein move kartay hain, jis kay baad woh phir se wohi sequence repeat kartay hain. Iss pattern ko samajhna traders ke liye bohat zaroori hai, kyunki iss say unko market trend ka pata chalta hai aur woh trading decisions bhi sahi tareeqay se le saktay hain.Hormonic Price Chat Pattern ki alamaat mein kuch specific shapes aur ratios shaamil hotay hain, jaisay ke Gartley, Butterfly, Crab aur Bat. In shapes aur ratios ko samajhna traders ke liye zaroori hai,

    Understanding of chart pattern

    Price chart patterns are visual representations of historical price movements in the forex market. (Keemat chart patterns forex market mein tareekhi keemat ki harkaton ka tasawwur darust karte hain.)

    Working of harmonic price chart patterns

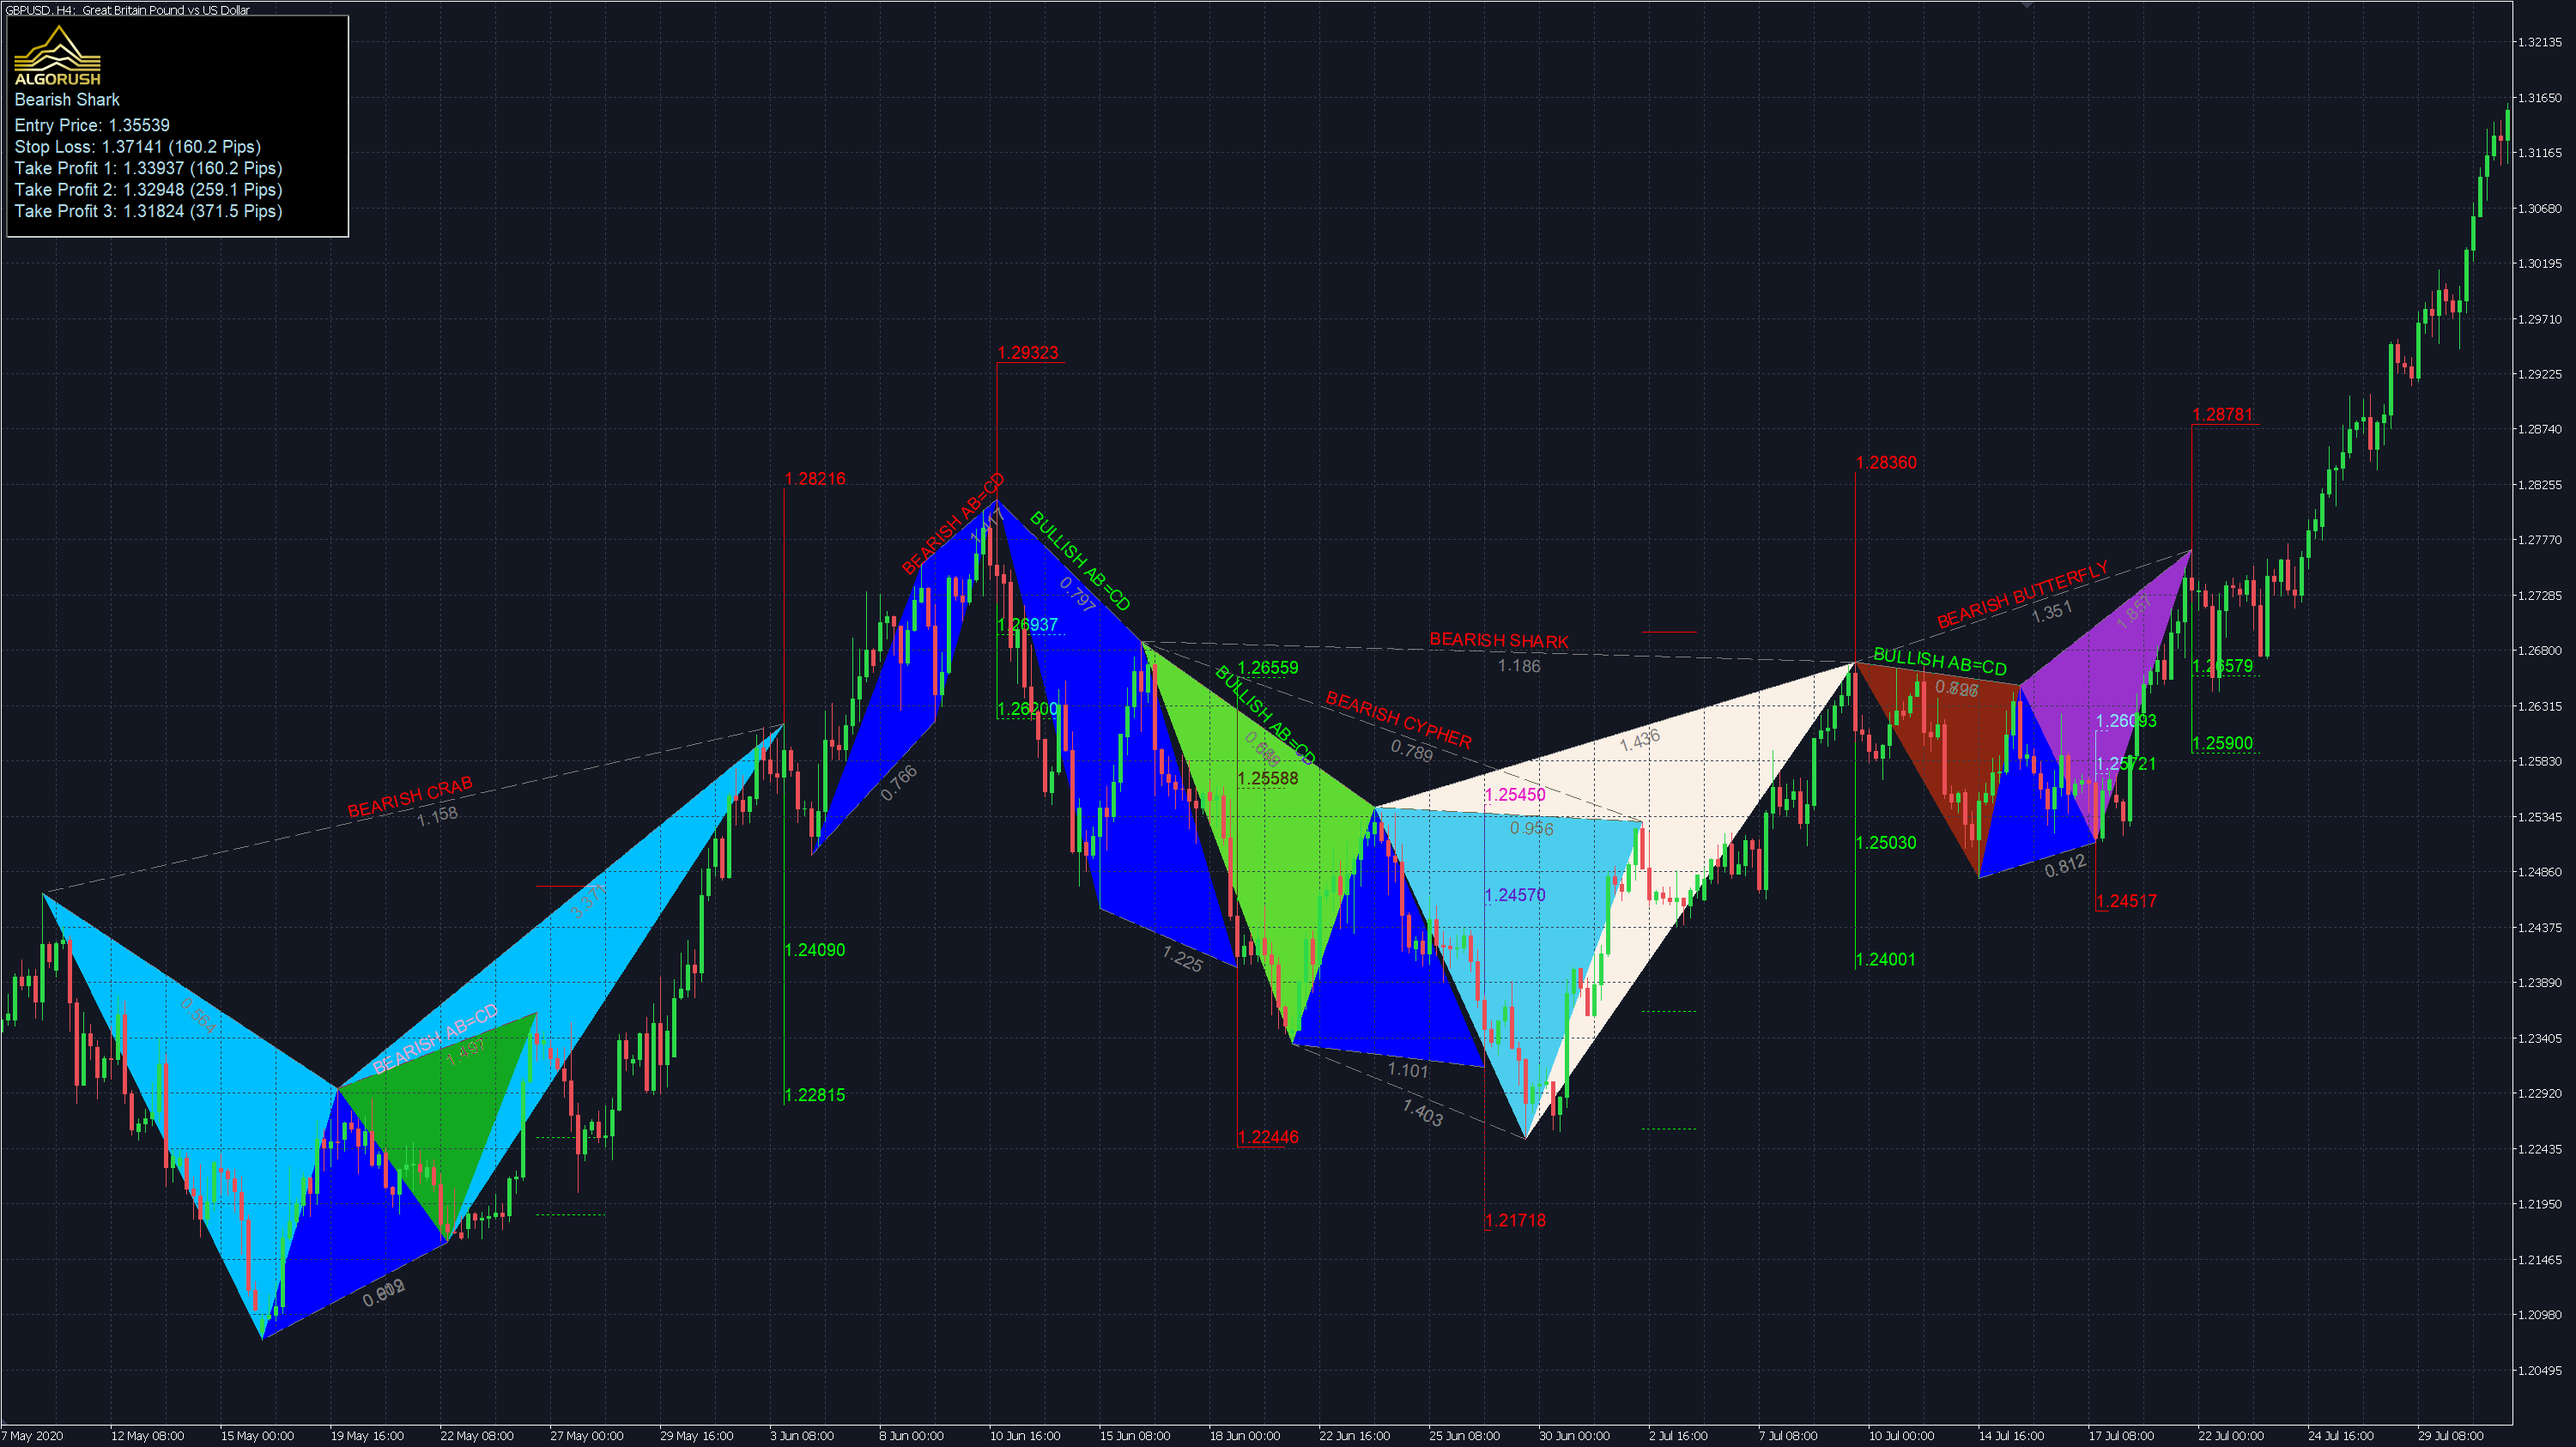
    Harmonic Price Chart Patterns, technical analysis mein use kie jane wale price patterns hai, jo price action analysis ko incorporate karte hain. Ye patterns, price charts ke shapes aur price movements ko observe karke banaye jate hain aur ye shapes Fibonacci ratios ke saath bhi correlate karte hain. In patterns ko identify karne se traders aur investors price movements ko predict kar sakte hain aur trading decisions lena sikh sakte hain.Harmonic Price Chart Patterns ka main kaam, market trends aur price movements ko predict karna hota hai. Ye patterns, price movements aur Fibonacci ratios ke correlation ke basis par banaye jate hain aur ye patterns, price movements ko predict karne ke liye use kie jate hain. Ye patterns, bullish aur bearish dono forms mein aate hain aur ye patterns ka use, market mein trend ko samajhne aur trading decisions lena ke liye kia jata hai.Harmonic Price Chart Patterns ka use, traders aur investors ke liye bahut important hai, kyunki ye patterns market movements aur trend ko samajhne mein madad karte hain. In patterns ko identify karne se, traders aur investors price movements ko predict kar sakte hain aur trading decisions lena sikh sakte hain. Iske alava, traders aur investors ko Harmonic Price Chart Patterns ke saath risk management ke concept ko bhi acche se samajhna hota hai, jisse unhe trading losses ko minimize karne mein help milti
    Example of harmonic price chart patterns

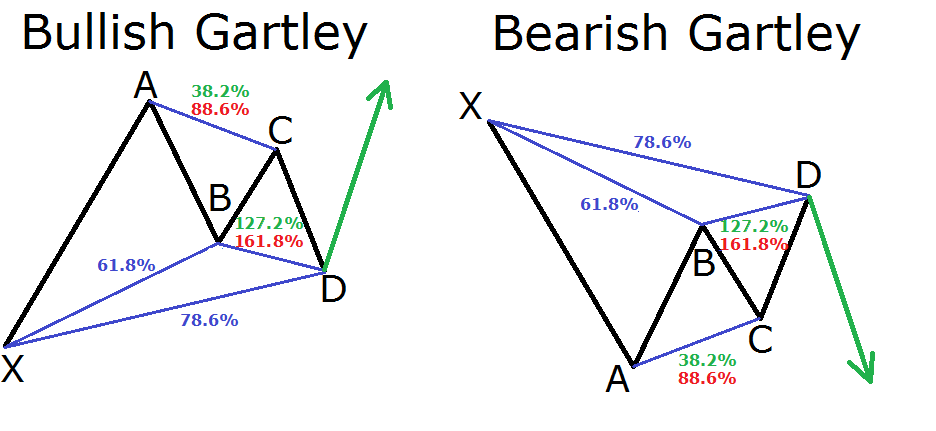
    harmonic patteren set up mein, trade ki shanakht is waqt hoti hai jab pehli 3 tangen mukammal ho jati hain ( 5 point patteren mein ). misaal ke tor par, gartili blush patteren mein, xa, ab aur bc tangen mukammal ho jati hain aur yeh cd taang ban-na shuru kar deti hain, aap is baat ki nishandahi karen ge ke mumkina tijarat ho sakti hai .

    Trend line of harmonic price chart pattern

    Dear Sisters and Brothers Market mein analysis karne ke liye hamein harmonic price chart pattern ko analyse karne ke liye trendline ko use karna parta hai aur agar hum harmonic pattern ke liye trendline ko theek tarike se use kar lete hain to hum market mein easily harmonic pattern ko analyse kar sakte hain aur market se good benefits le sakte hain isliye hamein zaruri hai ke hum trendline ka using hamein aana chahiye tab hi hum easily harmonic pattern ko analyse kar sakenge otherwise market mein kisi bhi channel yah pattern pe analyzed karna possible nahin hoga so hamein struggle karna chahiye aur daily bhejte practice karni chahiye ta ke hum harmonic pattern se fayda utha
  • <a href="https://www.instaforex.org/ru/?x=ruforum">InstaForex</a>
  • #2 Collapse

    HARMONIC PRICE CHART PATTERN:-

    Harmonic price chart patterns ek technical analysis ki category hain jo traders aur investors use karte hain market trends aur price movements ko predict karne ke liye. Ye patterns price charts par specific price levels aur geometric shapes ko identify karne mein madadgar hote hain. In patterns ko traders use karte hain market entry aur exit points determine karne ke liye.


    Harmonic price chart patterns ka concept Fibonacci numbers aur ratios par adharit hota hai. Ye patterns market mein recurring reversal points ko indicate karte hain. Kuch eihem harmonic patterns hain.

    HARMONIC PRICE CHART PATTERN K PARTS:-

    1. **Gartley Pattern**:

    Gartley pattern ek specific price pattern hai jo trend reversal ko predict karne mein madadgar hota hai. Ye pattern ABCD structure par adharit hota hai, jisme price chart par Fibonacci ratios ka use hota hai.

    2. **Butterfly Pattern**:

    Butterfly pattern ek dusra harmonic pattern hai jisme bhi ABCD structure ka use hota hai. Ye pattern price reversals ko indicate karta hai.

    3. **Bat Pattern**:

    Bat pattern bhi ABCD structure par adharit hota hai aur trend reversal points ko identify karta hai.

    4. **Cypher Pattern**:

    Cypher pattern ek advanced harmonic pattern hai jo Fibonacci ratios ko use karta hai. Ye pattern trend reversal points ko indicate karta hai.

    5. **Shark Pattern**:

    Shark pattern bhi ek complex harmonic pattern hai, jisme Fibonacci levels ka use hota hai price reversals ko predict karne ke liye.

    Ye patterns traders ko market mein price reversals aur trend changes ko spot karne mein madadgar hote hain. Lekin, in patterns ka sahi tarike se samajhna aur istemal karna aavashyak hai, aur isme kisi bhi technical analysis tool ki tarah risk hota hai. Isliye, traders ko in patterns ko samajhne ke liye pratice aur experience ki jarurat hoti hai.
    • #3 Collapse


      WHAT IS HARMONIC PRICE CHART PATTERN

      Harmonic price ke pattern vah Hote Hain Jo common trading methods ke braksh harmonic trading of futures ki movement ki predict karne ki koshish karti hai ya fibonacci numbers ko istemal karke define prices of ke pattern ko next level tak le Jaate Hain isliye yah ratio financial market mein bhi dekha jata hai jo un environments aur society se effected Hote Hain Jan mein Woh trade Karte Hain harmonic ke issues harmonic price ke ain mutabik Hote Hain Ek traders Ek Aksar Aisa pattern dekh sakta hai Jo harmonic pattern Jaisa lagta hai Is Tarah harmonic approach ke lihaz se pattern ko unreliable karar de ga Kyunki iske liye traders ko Sabar karne aur misali setup ka wait karne ki zarurat hai


      HARMONIC PRICE OF TYPE

      Harmonic pattern is baat ka andaza Laga sakte hain ki current movements kitni der tak chalegi lekin Inka istemal reversal points ko alag karne ke liye Bhi Kiya Ja sakta hai rISK us Waqt Hota Hai Jab Koi traders reversal area Mein position leta hai aur pattern nakam ho jata hai Jab aisa hota hai traders Ek Aisi trade Mein phas sakta hai Jahan trends unke khilaf phailta hai lihaza Tamam trading strategies Ki Tarah risk ko control karna zaruri hai aur yah note karna bhi zaruri hai ki pattern dusre pattern ke andar maujud Hain


      HARMONIC PATTERN ENTRIES AND STOP LOSSES

      Inka istemal harmonic price ki tasir Mein help karne aur entries aur bahar nikalne ki Karkrdgi ko barhane ke liye Kiya Ja sakta hai methods istemal karne ke liye Ek traders Ek platform se fayda uthaega Jiski help se vo har wave ki measure karne ke liye fibonacci ki retracenment Ka Plan banaa sakte hain trade ki ja rahi hai time frame ki bigar pictures per focus karna chahie agar aap long position Mein inter Hona Chahte Hain To pahle uski confirmation Karni chahie Uske bad aap Achcha profit Hasil kar sakte hain
      • #4 Collapse

        Harmonic price chart patterns trading ki duniya mein aik important tool hain jo investors aur traders ko market ki future movements ko predict karne mein madad dete hain. Ye patterns technical analysis ka part hain aur inhein price movements aur patterns ki pehchaan karne ke liye use kiya jata hai. Harmonic patterns ki samajh aur unki pehchaan aapko market trends ko samajhne aur unke hisaab se trading decisions lene mein madad deti hai. Harmonic patterns ko samajhne ke liye sab se pehle yeh samajhna zaroori hai ke ye patterns mathematical aur geometric ratios par base hote hain. Ye patterns price charts par naturally develop hote hain aur inki pehchaan karke traders future price movements ko predict karte hain. Harmonic patterns ki pehchaan karne ke liye Fibonacci ratios ka use hota hai, jo ke market ke rhythm aur price movements ko measure karte hain.

        Major Harmonic Patterns
        Harmonic patterns kai different types ke hote hain, lekin sab se common aur important patterns ye hain:
        1. Gartley Pattern
        2. Bat Pattern
        3. Butterfly Pattern
        4. Crab Pattern
        Har pattern ki apni specific characteristics aur trading rules hote hain. Ab hum in patterns ko detail mein discuss karenge.


        1. Gartley Pattern
        Gartley pattern ka naam trader Harold Gartley ke naam par rakha gaya hai, jo pehli baar is pattern ko define kiya. Ye pattern generally reversal points ko identify karta hai aur yeh 5 points (X, A, B, C, D) par based hota hai.

        Gartley Pattern Ki Characteristics
        • XA: Yeh initial move hota hai jo price ke direction ko define karta hai.
        • AB: Yeh correction move hota hai jo XA ke initial move ka retracement hota hai.
        • BC: Yeh second correction hota hai jo AB ka retracement hota hai.
        • CD: Yeh final move hota hai jo BC ke pattern ke opposite direction mein hota hai.
        Fibonacci Ratios
        • XA aur AB ke beech ka ratio 61.8% hota hai.
        • AB aur BC ke beech ka ratio 78.6% hota hai.
        • BC aur CD ke beech ka ratio 127% ya 161.8% hota hai.
        Trading Rules
        • Gartley pattern ka confirmation tab hota hai jab price D point par pohanchti hai aur reverse hone ki potential hoti hai.
        2. Bat Pattern
        Bat pattern bhi reversal points ko identify karta hai aur yeh bhi 5 points (X, A, B, C, D) par based hota hai. Yeh pattern Gartley pattern ke comparison mein thoda different hota hai, particularly in the Fibonacci ratios.

        Bat Pattern Ki Characteristics
        • XA: Yeh initial move hota hai jo price direction ko define karta hai.
        • AB: Yeh XA ka 38.2% retracement hota hai.
        • BC: Yeh AB ka 50% retracement hota hai.
        • CD: Yeh final move hota hai jo 161.8% ya 261.8% extension hota hai.
        Fibonacci Ratios
        • XA aur AB ke beech ka ratio 38.2% hota hai.
        • AB aur BC ke beech ka ratio 50% hota hai.
        • BC aur CD ke beech ka ratio 161.8% ya 261.8% hota hai.
        Trading Rules
        • Bat pattern ka confirmation tab hota hai jab price D point par develop hoti hai aur reversal ki potential hoti hai.
        3. Butterfly Pattern
        Butterfly pattern bhi 5 points (X, A, B, C, D) par base hota hai aur yeh price ke strong reversal points ko identify karta hai.

        Butterfly Pattern Ki Characteristics
        • XA: Yeh initial move hota hai.
        • AB: Yeh XA ka 78.6% retracement hota hai.
        • BC: Yeh AB ka 38.2% retracement hota hai.
        • CD: Yeh final move hota hai jo 161.8% ya 261.8% extension hota hai.
        Fibonacci Ratios
        • XA aur AB ke beech ka ratio 78.6% hota hai.
        • AB aur BC ke beech ka ratio 38.2% hota hai.
        • BC aur CD ke beech ka ratio 161.8% ya 261.8% hota hai.
        Trading Rules
        • Butterfly pattern ka confirmation tab hota hai jab price D point par develop hoti hai aur expected reversal hota hai.
        4. Crab Pattern
        Crab pattern bhi 5 points (X, A, B, C, D) par base hota hai aur yeh market ke extreme reversal points ko identify karta hai. Yeh pattern extreme volatility ko bhi indicate kar sakta hai.

        Crab Pattern Ki Characteristics
        • XA: Yeh initial move hota hai.
        • AB: Yeh XA ka 61.8% retracement hota hai.
        • BC: Yeh AB ka 38.2% retracement hota hai.
        • CD: Yeh final move hota hai jo 224% ya 361.8% extension hota hai.
        Fibonacci Ratios
        • XA aur AB ke beech ka ratio 61.8% hota hai.
        • AB aur BC ke beech ka ratio 38.2% hota hai.
        • BC aur CD ke beech ka ratio 224% ya 361.8% hota hai.
        Trading Rules
        • Crab pattern ka confirmation tab hota hai jab price D point par develop hoti hai aur expected reversal hota hai.
        Harmonic Patterns Ki Trading Strategy
        Harmonic patterns ko effectively use karne ke liye ek clear trading strategy develop karna zaroori hota hai. Yeh strategy market ki condition aur pattern ke type ke hisaab se adjust ki ja sakti hai. Yahan kuch key points hain jo aapki trading strategy ko enhance kar sakte hain:
        1. Pattern Recognition:
          • Harmonic patterns ki pehchaan karna sab se pehla step hai. Yeh patterns charts par naturally develop hote hain, lekin unhein accurately identify karna practice aur experience ki zaroorat hoti hai.
        2. Fibonacci Ratios:
          • Harmonic patterns ka core Fibonacci ratios hain. In ratios ko accurately measure karna aur pattern ke key levels ko identify karna important hai.
        3. Confirmation Indicators:
          • Harmonic patterns ka confirmation other technical indicators jaise moving averages, RSI (Relative Strength Index), aur MACD (Moving Average Convergence Divergence) se kiya ja sakta hai. Ye indicators aapko pattern ke accuracy aur reliability ko validate karne mein madad dete hain.
        4. Risk Management:
          • Harmonic patterns ko use karte waqt risk management ko bhi nazar mein rakhna zaroori hai. Stop-loss aur take-profit levels ko accurately set karna chahiye taake potential losses ko minimize kiya ja sake aur profits ko maximize kiya ja sake.
        5. Backtesting:
          • Harmonic patterns ko use karne se pehle backtesting zaroori hai. Historical data par pattern ki performance ko analyze karna aapko future trading decisions mein madad dega.
        Harmonic price chart patterns trading ke world mein ek powerful tool hain jo market ki future movements ko predict karne mein madad karte hain. Gartley, Bat, Butterfly, aur Crab patterns market ke different scenarios ko cover karte hain aur inki accurate identification aur analysis se aap effective trading decisions le sakte hain. Har pattern ki apni specific characteristics aur Fibonacci ratios hote hain jo inke reliability ko define karte hain.

        Trading mein success paane ke liye harmonic patterns ki understanding ke sath-sath risk management aur other technical indicators ka use bhi zaroori hai. Practice aur experience se aap in patterns ko effectively use kar sakte hain aur apni trading strategies ko enhance kar sakte hain.
        Believe in yourself and your abilities. When you fight for your dreams, you can achieve anything.
        • #5 Collapse

          Harmonic Price Chart Pattern


          Harmonic price chart patterns trading ka aik advanced tareeqa hai jo technical analysis ke zariye price movements ko predict karta hai. Yeh patterns market ke behavior ko samajhne aur future trends ko identify karne ke liye use kiye jate hain. Harmonic patterns trading ka aik maqsad yeh hota hai ke investor ya trader price movements ko accurate tareeqe se predict kar sake.

          Harmonic patterns ki pehchaan aur inka istemal market analysis mein kafi madadgar sabit ho sakta hai. Yeh patterns mathematical aur geometrical principles par based hain aur inka focus price movements ke regular aur irregular patterns ko samajhne par hota hai. Harmonic patterns ko trade karne se aapko market ke high probability setups mil sakte hain jo aapke trading decisions ko enhance kar sakte hain.
          Harmonic Patterns Ki Pehchaan


          Harmonic patterns ko identify karna thoda challenging ho sakta hai, lekin jab aap in patterns ko samajh lete hain to aapki trading strategy mein behtari aa sakti hai. Yeh patterns multiple points ke combination se bante hain jo price chart par specific shapes banate hain. In patterns mein sabse common points H, X, A, B, C, aur D hain. Har point ek specific price level ko represent karta hai aur inke beech ke connections ek unique pattern create karte hain.
          Popular Harmonic Patterns
          1. Gartley Pattern Gartley pattern aik popular harmonic pattern hai jo bullish aur bearish movements ko predict karta hai. Is pattern mein 78.6% retracement level ko important maana jata hai. Gartley pattern ka primary objective yeh hai ke market ke potential reversals ko identify kiya ja sake.
          2. Bat Pattern Bat pattern bhi aik common harmonic pattern hai jo market reversal ko predict karta hai. Is pattern ki khas baat yeh hai ke yeh 50% retracement level ke aas paas develop hota hai. Bat pattern ka shape aur retracement levels Gartley pattern se mukhtalif hote hain lekin dono patterns ka maqsad market reversals ko identify karna hota hai.
          3. Butterfly Pattern Butterfly pattern aik advanced harmonic pattern hai jo market ke extreme movements ko identify karta hai. Is pattern mein price movement ka range relatively zyada hota hai aur yeh pattern 78.6% aur 127.2% retracement levels ko consider karta hai. Butterfly pattern ka focus long-term market trends ko samajhne par hota hai.
          4. Crab Pattern Crab pattern aik aur important harmonic pattern hai jo market ke significant reversals ko predict karta hai. Is pattern ka shape aur retracement levels relatively complex hote hain. Crab pattern ko identify karna thoda mushkil ho sakta hai lekin jab yeh pattern sahi tarah se identify kar liya jaye to yeh accurate trading signals provide kar sakta hai.
          Harmonic Patterns Ki Importance


          Harmonic patterns ki importance yeh hai ke yeh market ke potential reversals aur price movements ko predict karne mein madadgar sabit hote hain. Yeh patterns price data ko analyze karke future trends ko predict karte hain. Harmonic patterns ka istemal karke aap market ki potential movements ko samajh sakte hain aur apni trading strategies ko optimize kar sakte hain.

          Harmonic patterns ke sahi istemal ke liye technical analysis aur pattern recognition skills ka hona zaroori hai. Yeh patterns aapko market ke high probability setups provide karte hain jo aapki trading strategy ko enhance kar sakte hain. Har pattern ke unique characteristics aur retracement levels ko samajhna aapko accurate trading signals provide kar sakta hai.
          • <a href="https://www.instaforex.org/ru/?x=ruforum">InstaForex</a>
          • #6 Collapse

            ### Harmonic Price Chart Pattern Kya Hai?
            Harmonic price chart patterns ek advanced trading technique hain jo price movements ko predict karne ke liye geometric patterns ka istemal karti hain. Yeh patterns market ke rhythm aur cycles ko samajhne mein madadgar hote hain. Harmonic patterns ko identify karne se traders ko potential reversals aur continuations ke baare mein insights milte hain, jo unke trading decisions ko behter bana sakte hain.

            Harmonic patterns ka buniyadi concept Fibonacci retracement aur extension levels par adharit hai. Yeh patterns price action ke andar specific ratios aur proportions ko identify karte hain. Is tarah, traders yeh dekh sakte hain ke market kis tarah se react kar raha hai aur kab reversal ya continuation hone ki sambhavna hai.

            Harmonic patterns mein sabse mashhoor patterns "Gartley," "Bat," "Butterfly," aur "Crab" hain. Har pattern ka apna ek unique structure aur price ratio hota hai. Misal ke taur par, Gartley pattern mein price do distinct swings ke beech mein hota hai, jahan first swing (XA) ka retracement dusre swing (AB) ke liye hota hai. Is pattern ka success rate is baat par depend karta hai ke traders in ratios ko sahi tarah identify karte hain.

            In patterns ki khubsurti yeh hai ke yeh traders ko risk management strategies develop karne mein madad karte hain. Jab koi harmonic pattern identify hota hai, toh traders stop-loss levels aur profit targets set kar sakte hain. Yeh unhe potential losses ko minimize karne aur profits ko maximize karne ka mauqa dete hain.

            Lekin, harmonic patterns ke sath caution bhi zaroori hai. Yeh patterns kabhi kabhi false signals de sakte hain, khas taur par volatile markets mein. Isliye, traders ko in patterns ko doosre technical indicators ke sath combine karna chahiye, jaise moving averages ya RSI, taake confirmation mil sake.

            Harmonic patterns ka istemal karne ka ek aur faida yeh hai ke yeh traders ko market ki psychology samajhne mein madad karte hain. Jab traders in patterns ko dekhte hain, toh wo yeh samajhte hain ke market kis direction mein ja raha hai aur kis tarah se participants react kar rahe hain.

            Aakhir mein, harmonic price chart patterns ek powerful tool hain jo traders ko market ki dynamics ko samajhne mein madad dete hain. Agar traders in patterns ko sahi tarah se samjhein aur apply karein, toh yeh unki trading strategies ko behter bana sakte hain aur unhe market ke moves ka andaza lagane mein madad karte hain. Isliye, in patterns ka istemal seekhna har trader ke liye faydemand hai.

            اب آن لائن

            Working...
            X