What is the relative strength index (rsi) :

No announcement yet.
`
X
  • وقت
  • دکھائیں
Clear All
new posts
  • #1 Collapse

    What is the relative strength index (rsi) :
    INTRODUCTION AND CALCULATION OF THE RELATIVE STRENGTH INDEX (RSI) :


    Relative Strength Index (RSI) forex trading ma istemal hone wala ak popular technical indicator ha jo price movement ka taqator momentum ka andaaza lagane ka liye istemal hota ha. J. WellesWilders ne 1970s ka akhir ma ise develop kaya tha. RSI ak aisa aala ha jo mukhtalif timeframes or markat ma istemal kaya ja sakta ha.

    RSI ka hisaab-katab ak formula istemal karka kaya jata ha jisme average gain or average loss ko specify kaye gaye muddat ka hisab se samjha jata ha. Formula is tarah hota ha:

    RSI = 100 - (100 / (1 + RS))

    Yahan RS (Relative Strength) ko average gain ko average loss se taqseem kar ka calculate kaya jata ha. Average gain muddat ka tamam gain ka total ha jo us muddat ka periods se taqseem kaya jata ha, or average loss ko bhi waise hi calculate kaya jata ha. RSI 0 se 100 tak range hota ha, jahan 70 se ooper ka values overbought conditions darshaate ha or 30 se neechay ka values oversold conditions darshaate ha.


    UNDERSTANDING OVERBOUGHT AND OVERSOLD CONDITIONS :


    RSI ka ak mukhya istemaal forex trading ma markat ma overbought or oversold conditions ko pehchanne ka liye kaya jata ha. Traders aksar 70/30 threshold ko guide ka tor par istemal karte ha, yani agar RSI reading 70 se ooper ho, to markat overbought samjhi jati ha, or agar RSI reading 30 se neechay ho, to markat oversold samjhi jati ha.

    Overbought conditions yeh sugaate ha ka markat badalne ya corrective pullback hone ka koshish kar raha ha, jabka oversold conditions potential buying opportunity indicate kar sakte ha. Lakan yeh zaruri ha ka RSI ak momentum indicator ha or iska matlab yeh nahi ka ye future price direction ka signal provide karta ha. Isliye, RSI ko dusre technical analysis tools or price action patterns ka saath istemal karna zaruri ha taaka behtar trading decisions liye ja sakan.


    DIVERGENCE AND TREND REVERSAL :


    RSI ka ak or mahtavpur istemaal divergences ka zariye potential trend reversals ko pehchanna ha. Divergence tab hota ha jab price higher high ya lower low banata ha, lakan RSI us move ko confirm nahi karta or lower high ya higher low banata ha. Isse pata chalta ha ka prevailing trend momentum kho rahi ha or trend reversal hone ka sambhavna ho sakti ha.

    Tafseel ka liye, agar currency pair ka price ak naya high banata ha, lakan RSI apne pehle high se guzarne ma qamyab nahi ho pata, to yeh bearish divergence ho sakti ha or trend reversal ka sambhavna darsha sakti ha. Waise hi, agar price ak naya low banata ha, lakan RSI lower low nahi banata, to yeh bullish divergence ho sakti ha or upward reversal ka sambhavna darsha sakti ha. Traders am tor par divergences ko dusre technical analysis tools ka saath istemal karte ha apni trading decisions ko confirm karne ka liye.


    RSI AS A CONFIRMATION TOOL :


    RSI ko dusre technical indicators ya trading strategies ka confirmation tool ka tor par bhi istemal kaya ja sakta ha. Misal ka tor par, agar ak trader trend-following indicator jaise moving average ka istemal kar raha ha trend ka direction ko pehchanne ka liye, to wo RSI ka istemal karka ye confirm kar sakta ha ka trend strong ha or chance ha ka wo jari rahe ga.

    Agar RSI ka reading 50 se upar ha, toh yeh ishara karta ha ka buyers control ma ha or trend jari reh sakta ha. Wahi agar RSI ka reading 50 se neeche ha, toh yeh ishara karta ha ka sellers control ma ha or trend kamzor ho raha ha ya palat sakta ha. RSI ko tasdeeqi tool ka tor par istemal karka, traders jhooti signals ko filter karka or successful trades ka saath hone ka sambhavna ko badha sakte ha.


    RSI OVERBOUGHT/OVERSOLD STRATEGY :


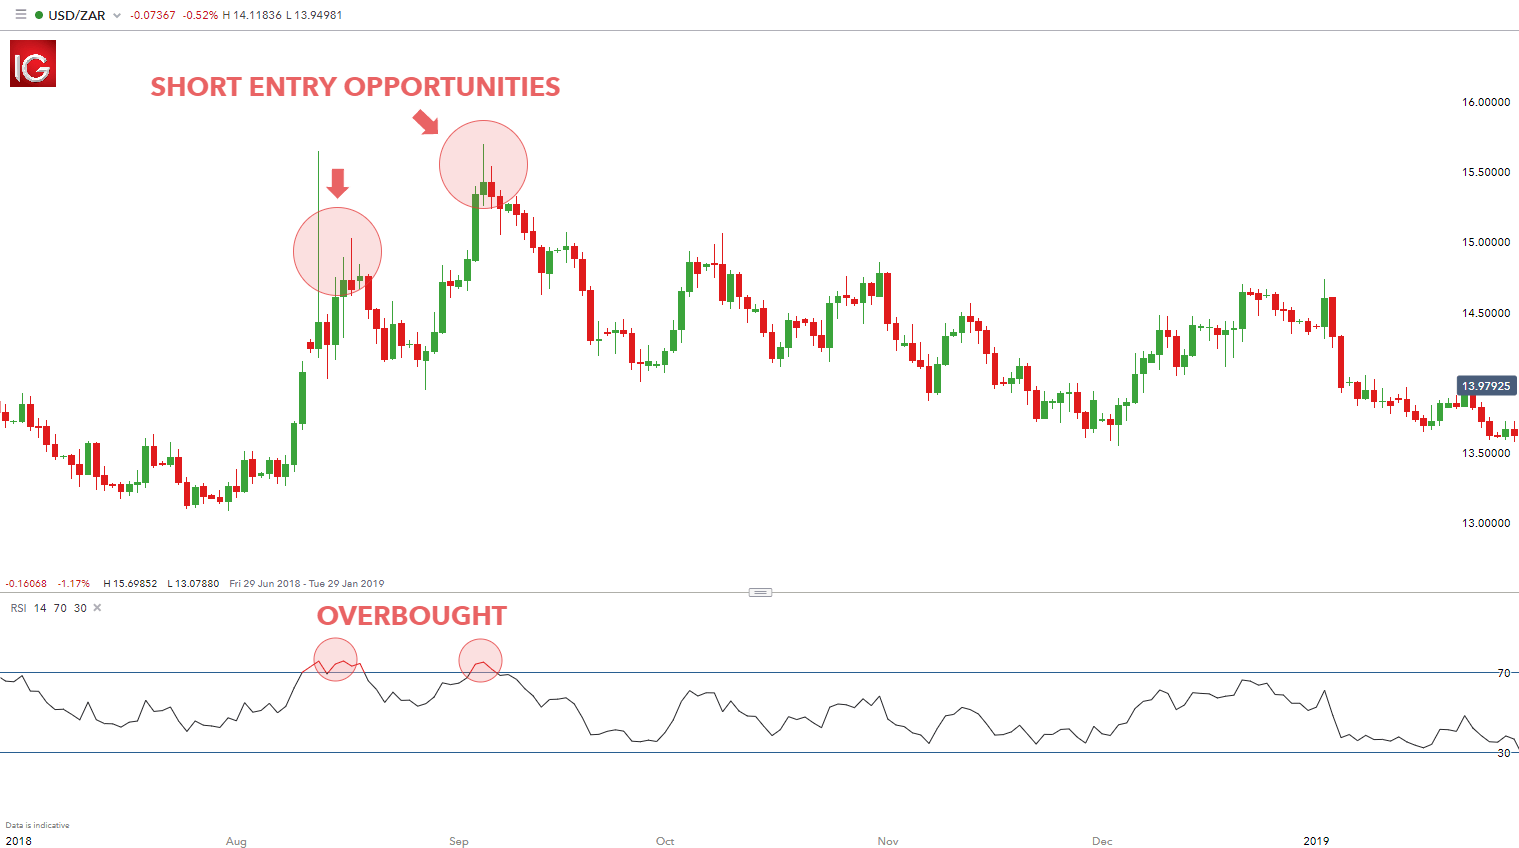
    Ek mashhoor trading strategy jisme RSI ka istemal hota ha, woh overbought or oversold conditions ko entry or exit signals ka tor par istemal karna ha. Traders RSI ka reading 70 se upar hote ha, ishara karte hue ka markat overbought ha, toh woh short trade ma enter ho sakte ha or jab RSI 70 se neeche aa jaye, tab exit kar sakte ha. Usi tarah, traders RSI ka reading 30 se neeche hote ha, ishara karte hue ka markat oversold ha, toh woh long trade ma enter ho sakte ha or jab RSI 30 se upar jaaye, tab exit kar sakte ha.

    Halaanka, yeh zaroori ha ka overbought or oversold conditions mazboot trending markats ma lamba samay tak jari reh sakte ha. Isliye, yeh salah di jaati ha ka is strategy ko dusre technical analysis tools or price action patterns ka saath istemal kaya jaaye, taaka successful trades ka sambhavna badhe. Is strategy ko istemal karte waqt markat conditions or overall trend ka bhi dhyaan dena zaroori ha, jisse jhooti signals se bacha ja saka.
  • <a href="https://www.instaforex.org/ru/?x=ruforum">InstaForex</a>
  • #2 Collapse

    Introduction to RSI:

    Relative Strength Index (RSI), Forex trading mein ek aham technical indicator hai. RSI ka maqsad market ke price movements ko analyze karna hai aur yeh traders ko overbought aur oversold conditions ka andaza lagane mein madad deta hai.

    How RSI Works:

    RSI market ke trend aur momentum ko samajhne mein madadgar hai. Is indicator ki range aam taur par 0 se 100 tak hoti hai. Jab RSI 70 ke upar hota hai, to iska matlab hota hai ke market overbought hai, aur jab 30 ke neeche hota hai, to yeh oversold conditions ko indicate karta hai.

    Click image for larger version

Name:	Bitcoin_RSI14_Divergence.png
Views:	42
Size:	61.2 کلوبائٹ
ID:	12777704

    The Formula for RSI:

    RSI ka formula price ke recent gains aur losses ko dekhta hai. Is formula se RSI ka value nikala jata hai. RSI = 100 - [100 / (1 + RS)] jahan 'RS' recent positive price changes ka average recent negative price changes ka average se divide karta hai.

    Significance of RSI:

    RSI traders ko market ke momentum ko samajhne mein madadgar hota hai. Agar RSI overbought region mein hai, to iska matlab ho sakta hai ke market mein trend reversal hone ke chances hain. Agar RSI oversold region mein hai, to yeh trend reversal ke liye ek potential signal ho sakta hai.

    Click image for larger version

Name:	relative-strength-index_body_POSITIVEDIVERGANCE.png.full.png
Views:	31
Size:	32.8 کلوبائٹ
ID:	12777705

    Using RSI in Trading:

    Traders RSI ko trading signals ke liye istemal karte hain. Masalan, agar RSI 70 ke upar hai aur phir neeche aata hai, to yeh selling signal ho sakta hai. Jab RSI 30 ke neeche hota hai aur phir upar jata hai, to yeh buying signal ho sakta hai.

    Limitations of RSI:

    RSI ke bhi limitations hain. Kabhi-kabhi RSI false signals bhi de sakta hai, isliye isko doosre indicators ke saath istemal karna behtar hota hai. Market conditions aur time frame bhi RSI ke interpretation par asar dalte hain.

    Risk Management with RSI:

    RSI ke saath trading karte waqt risk management ko yaad rakhna zaroori hai. Stop-loss aur take-profit orders sahi tarike se tayyar karna trading ke liye ahem hai.

    Click image for larger version

Name:	dotdash_final_Relative_Strength_Index_RSI_Jul_2020-04-e283196d37574bda82850e565ae78ce2.jpg
Views:	30
Size:	281.9 کلوبائٹ
ID:	12777706

    IN Conclusion, Relative Strength Index (RSI) Forex traders ke liye ahem tool hai jo market ke trend aur momentum ko analyze karne mein madad deta hai. Iska theek tarike se istemal karke traders apni trading strategies ko behtar bana sakte hain. Magar, yaad rahe ke RSI ke signals hamesha sahi nahi hote, isliye doosre factors aur indicators ke saath bhi istemal karna zaroori hai.
    • #3 Collapse

      What is the relative strength index (rsi) kai hota ha


      Relative Strength Index (RSI) ek technical analysis indicator hai jo financial markets mein price movements ki speed aur change ko measure karne ke liye istemal hota hai. Iska mukhya uddeshya hota hai ke samjha jaye ke kisi asset, jaise ki stocks, commodities, ya currencies, ke price mein tezi ya ghiri hui sthiti hai ya nahi. RSI traders aur investors ko ye jaankari deta hai ke kisi asset overbought ya oversold hai, jisse woh trading decisions behtar tareeke se le sakte hain.

      RSI ka calculation is formula ke zariye kiya jata hai:

      RSI = 100 - (100 / (1 + RS))

      Yahan par:
      • RS (Relative Strength) hota hai jo "n" dinon ke up closes ki average "n" dinon ke down closes ki average se divide kiya jata hai. Aam taur par, "n" ki moolya hoti hai 14, lekin traders ki pasandidgi ke hisab se isse adjust kiya ja sakta hai.
      • Up closes woh din hote hain jab asset ke price badhta hai.
      • Down closes woh din hote hain jab asset ke price ghatata hai.

      RSI aam taur par 0 se 100 ke beech hota hai. Iska vyakhya karne ka tareeka aam taur par yeh hota hai:
      1. RSI ke values 70 ke upar: Asset ko overbought mana jata hai, yani ke asset ki keemat mein sudhar ya correction hone ka samay ho sakta hai, isliye isse bechna ya profit lena achha ho sakta hai.
      2. RSI ke values 30 ke niche: Asset ko oversold mana jata hai, iska matlab hai ke asset ki keemat mein uthhar ya badhne ka samay ho sakta hai, isliye isse khareedna achha ho sakta hai.

      Traders aksar RSI ko doosre technical indicators aur analysis methods ke saath istemal karte hain tak taki unko behtar trading decisions lene mein madad mile. Yeh yaad rakhna important hai ke kisi bhi akela indicator ko istemal nahi karna chahiye aur traders ko trading decisions lene se pehle market conditions, news events, aur fundamental analysis jaise aur factors ko bhi madde me lena chahiye.

      RSI traders ke liye ek mahatvapurna tool hai, lekin jaise ki har technical analysis tool, iska bhi apne had aur limitations hote hain aur isse ek bade trading strategy ka hissa ke roop mein istemal karna chahiye.


      • #4 Collapse

        FOREX TRADING ME RSI

        Relative Strength Index (RSI) ek technical indicator hai jo market analysis me istemal hota hai. Ye indicator price changes ko evaluate karke ek asset (jaise ki stocks, commodities, ya currencies) ke overbought or oversold conditions ko identify karne me madad karta hai. RSI ki calculation price movements par based hoti hai, aur ye typically 14 periods (dino) ke liye istemal hoti hai.


        RSI ka formula aam taur par is tarah hota hai:

        RSI = 100 - (100 / (1 + RS))

        Yahan "RS" Relative Strength ko darust karta hai, jo ki aap price ki upar wale dinon ki average gain (price increase) aur nichale dinon ki average loss (price decrease) ke ratio ke madhyam se nikal sakte hain.

        RSI values 0 se 100 ke beech hoti hain. RSI ke values 70 se upar aane par asset ko overbought mana jata hai, aur iska matlab hota hai ki asset ki kimat ke itne tezi se badhne ke baad thoda sa correction aane ke chances hai. Jab RSI values 30 se niche aati hain, to asset ko oversold mana jata hai, iska matlab hota hai ki asset ki kimat ke itne tezi se girne ke baad thoda sa recovery aane ke chances hai.

        RSI ko traders aur investors market entry points aur exit points ke taur par istemal karte hain. Agar RSI overbought territory me hai, to yah ek sell signal ho sakta hai, jabki RSI oversold territory me hai to yah ek buy signal ho sakta hai. RSI ke sath dusre technical indicators aur market analysis tools bhi istemal kiye jate hain asset ke future movement ko predict karne ke liye.
        • #5 Collapse

          Relative Strength Index (RSI) kya hai?

          Relative Strength Index (RSI) aik popular technical indicator hai jo trading mein use hota hai. Yeh tool traders ko help karta hai market ka momentum samajhne mein, aur yeh batata hai ke koi asset overbought ya oversold condition mein hai. Ab hum iske bare mein tafseel se samjhtay hain.
          1. RSI ka Bunyadi Taaruf


          RSI aik oscillator hai jo kisi bhi asset ke price movements ka 0 se 100 ke darmiyan ek score deta hai. Yeh score asset ki recent price changes ko measure karta hai, aur iske zariye trader ko is baat ka andaza hota hai ke price kitni taqat se move kar rahi hai. Jab RSI 70 ke upar ho, to asset overbought hota hai, aur jab RSI 30 ke neeche ho, to asset oversold hota hai.
          2. RSI Calculation ka Tareeqa


          RSI calculate karna kaafi asan hai. Iska formula hota hai:
          RSI = 100 – [100 / (1 + RS)], jahan RS ka matlab hai “Relative Strength”. RS calculate hota hai average gains aur average losses ke ratio ke tor par. Yeh formula recent gains aur losses ko compare karta hai aur unke darmiyan ka balance dekhta hai.
          3. RSI aur Momentum


          RSI aik momentum oscillator hai. Momentum ka matlab hota hai ke price kis taqat ke sath move kar rahi hai. Jab RSI 50 ke aas paas hota hai, to yeh indicate karta hai ke price neutral hai, yaani ismein zyada strong momentum nahi hai. Lekin jab yeh 70 ke upar ya 30 ke neeche jata hai, to yeh strong momentum ko represent karta hai.
          4. Overbought aur Oversold Conditions


          RSI ki sabse important khasiyat yeh hai ke yeh overbought aur oversold conditions ko identify karta hai. Agar RSI 70 se zyada ho jaye, to asset overbought hota hai, jo ke market mein selling opportunity ho sakti hai. Isi tarah, agar RSI 30 ke neeche ho, to yeh oversold condition hoti hai, jo ke buying opportunity ho sakti hai.
          5. RSI ki Default Settings


          RSI ki default setting 14-period hoti hai, jo 14 candlesticks ka data use karti hai RSI ko calculate karne ke liye. Lekin traders apne hisaab se is setting ko adjust kar sakte hain, jaise ke agar kisi ko short-term trading karni hai to wo 9-period ya 7-period RSI ko bhi use kar sakte hain.
          6. RSI Divergence


          RSI divergence aik important signal hota hai jo market reversal ko predict karne mein help karta hai. Yeh tab hota hai jab price aur RSI opposite directions mein move karte hain. Agar price higher highs bana raha ho lekin RSI lower highs bana raha ho, to yeh bearish divergence hoti hai, jo ke price drop hone ki indication hoti hai. Isi tarah, agar price lower lows bana raha ho lekin RSI higher lows bana raha ho, to yeh bullish divergence hoti hai, jo price increase ka signal hoti hai.
          7. RSI ka Use Trend Reversal ke Liye


          RSI ka aik aur fayda yeh hai ke yeh trend reversal ko pehchanne mein madad karta hai. Jab RSI 70 ke upar hota hai aur neeche ki taraf move karta hai, to yeh indicate karta hai ke price trend change ho sakta hai. Isi tarah, agar RSI 30 ke neeche ho aur upar ki taraf move kar raha ho, to yeh bullish reversal ka signal hota hai.
          8. RSI aur Support-Resistance Levels


          Traders RSI ko support aur resistance levels ke sath bhi use karte hain. Jab RSI support level ke paas ho aur 30 ke neeche ho, to yeh buying opportunity ho sakti hai. Aur jab RSI resistance level ke paas ho aur 70 ke upar ho, to yeh selling opportunity ho sakti hai. Is tarah RSI aur support-resistance ka sath istimaal aapko profitable trades karne mein madad de sakta hai.
          9. RSI aur Trend Following Strategy


          RSI ko trend-following strategies ke sath bhi use kiya ja sakta hai. Jab RSI 50 ke upar ho aur price upar ja rahi ho, to yeh bullish trend ko confirm karta hai. Aur jab RSI 50 ke neeche ho aur price neeche ja rahi ho, to yeh bearish trend ka indication hota hai.
          10. RSI ka Use Breakouts ke Liye


          RSI ko breakouts identify karne ke liye bhi use kiya ja sakta hai. Agar RSI suddenly 70 ke upar jaye, to yeh indicate kar sakta hai ke market mein breakout hone wala hai. Isi tarah, agar RSI 30 ke neeche jaye to yeh signal ho sakta hai ke market mein breakdown hone wala hai.
          11. RSI aur Multiple Timeframes


          Traders aksar RSI ko different timeframes pe check karte hain. Yeh isliye hota hai ke long-term aur short-term trends ko ek sath dekhna zaroori hota hai. Agar aap day trading kar rahe hain to aapko short-term RSI dekhni chahiye, lekin agar aap swing trading ya long-term trading kar rahe hain to long-term RSI ka analysis zaroori hota hai.
          12. RSI Strategy aur Stop-Loss


          RSI use karte waqt stop-loss lagana zaroori hota hai. Kyun ke RSI signals aksar early hote hain, isliye market kabhi kabhi aapki expectation ke khilaf bhi move kar sakti hai. Is liye jab RSI ke base pe aap entry karte hain, to stop-loss lagana aapko heavy losses se bachata hai.
          13. RSI aur Risk Management


          RSI ko use karte waqt risk management ka bhi khayal rakhna chahiye. Jab aapko RSI ka signal milta hai, to aapko apna position size aur risk tolerance decide karna chahiye. Yeh zaroori hai ke aap har trade mein zyada risk na lein, aur apne capital ka ek chhota hissa hi invest karein.
          14. RSI ka Combination Doosray Indicators ke Sath


          RSI ko aksar doosray technical indicators ke sath bhi use kiya jata hai jaise ke Moving Averages, Bollinger Bands, ya MACD. Is combination ka maksad hota hai zyada accurate signals lena aur market ke false signals se bachna. RSI akela bhi kaafi useful hai, lekin jab isko doosray indicators ke sath combine kiya jaye to yeh aur bhi powerful ho jata hai.

          Natija RSI aik powerful aur versatile tool hai jo traders ko market ke momentum aur trend ko samajhne mein madad karta hai. Overbought aur oversold conditions ko identify karna ho ya divergence signals ko samajhna ho, RSI aik must-have indicator hai jo aapki trading strategy ko improve kar sakta hai.

          • #6 Collapse

            Relative Strength Index (RSI) Kya Hai?

            Introduction:
            Relative Strength Index (RSI) ek popular technical indicator hai jo traders ko market ki strength aur weakness ko measure karne mein madad deta hai. RSI ka istimal price momentum ko samajhne ke liye kiya jata hai, aur yeh batata hai ke ek asset overbought ya oversold zone mein hai ya nahi. Is article mein hum RSI ke basics, iska calculation, aur trading ke liye iska istemal samjhenge.

            1. RSI Ka Concept: Overbought Aur Oversold Levels

            RSI ka main function yeh hota hai ke yeh market ke momentum ko judge karta hai aur batata hai ke market ya koi asset overbought (bohot zyada buy kiya gaya) ya oversold (bohot zyada sell kiya gaya) hai. RSI ki value 0 se 100 tak hoti hai, aur isko usually 14-period timeframe ke liye calculate kiya jata hai.
            • Jab RSI ki value 70 se upar hoti hai, toh asset ko overbought consider kiya jata hai. Yeh indicate karta hai ke price bohot tez upar gaya hai, aur correction ya reversal ho sakta hai.
            • Jab RSI ki value 30 se neeche hoti hai, toh asset ko oversold consider kiya jata hai. Yeh indicate karta hai ke price bohot neeche gira hai, aur recovery ya reversal ka chance hai.
            2. RSI Ka Formula Aur Calculation

            RSI ko calculate karne ka ek specific formula hota hai jo price movements ko analyze karta hai:

            RSI=100−(1001+RS)RSI=100−(1+RS100​)

            Yahan RS ka matlab hai Relative Strength, jo ke positive price movements aur negative price movements ka ratio hota hai:

            RS=Average Gain (Positive Closes)Average Loss (Negative Closes)RS=Average Loss (Negative Closes)Average Gain (Positive Closes)​

            Is formula ke zariye aapko ek value milti hai jo market ke current price strength ko reflect karti hai.

            3. RSI Ka Forex Trading Mein Istemaal
            Forex trading mein RSI ka bohot zyada istemal hota hai taake traders market ka momentum samajh sakein aur potential entry ya exit points ka tayun kar sakein. RSI ko alag-alag trading strategies mein shamil kiya jata hai, lekin yeh aksar oversold aur overbought signals ke liye use hota hai.

            Overbought Signal:
            Jab RSI 70 se upar chala jata hai, toh yeh overbought signal hota hai, jo batata hai ke asset ya currency pair ka price bohot tez upar gaya hai aur ab yeh reversal ya correction ke liye tayar hai. Is waqt short sell ya exit ka socha ja sakta hai.

            Oversold Signal:
            Jab RSI 30 se neeche hota hai, toh yeh oversold signal hota hai, jo indicate karta hai ke price bohot neeche aa gaya hai aur ab bounce back ya recovery ka mauqa hai. Is waqt buy entry ka plan banaya ja sakta hai.

            4. RSI Divergence: Trend Reversals Ko Pakarna
            RSI ka ek aur fayda yeh hai ke yeh divergence ko detect karne mein madad deta hai. Divergence us waqt hoti hai jab price ek direction mein move kar raha hota hai, lekin RSI opposite direction mein move karta hai. Yeh aksar ek trend reversal ka signal hota hai.

            Bullish Divergence:
            Agar price lower lows bana raha hai lekin RSI higher lows bana raha hai, toh yeh bullish divergence kehlata hai. Yeh signal hota hai ke price downtrend mein hai, lekin RSI recovery indicate kar raha hai, aur uptrend ka chance hai.

            Bearish Divergence:
            Agar price higher highs bana raha hai lekin RSI lower highs bana raha hai, toh yeh bearish divergence hoti hai. Yeh signal deta hai ke price uptrend mein hai, lekin RSI momentum weak ho raha hai, aur price neeche aa sakta hai.

            5. RSI Ka Sahi Istemaal: Jaldbaazi Se Bachen
            RSI ek ahem tool hai, lekin iska sahi istemal aur analysis zaroori hai. Aksar beginner traders RSI signals par jaldbaazi mein trade kar lete hain, lekin aisa karna risky ho sakta hai. RSI ko doosre technical indicators ke sath combine karna aur market ki overall condition ko samajhna zaroori hai.

            Example:
            Agar RSI overbought signal de raha hai, toh aapko price action, support/resistance levels, aur doosre indicators ko bhi dekhna chahiye. Sirf RSI par rely karke trade karna hamesha profitable nahi hota.

            6. RSI Ka Short-Term Aur Long-Term Istemaal
            RSI ko short-term aur long-term trading dono mein use kiya ja sakta hai. Short-term traders aksar 5 ya 7 period RSI ka istimal karte hain taake jaldi signals mil sakein, jab ke long-term traders 14-period ya usse zyada ka RSI use karte hain taake major trend ko samajh sakein.

            Short-Term Example:
            Scalping ya day trading mein RSI ka lower period setting (5-period RSI) use hota hai taake jaldi reversal ya overbought/oversold conditions ko detect kiya ja sake.

            Long-Term Example:
            Swing traders ya position traders 14-period ya 21-period RSI ka istemal karte hain taake long-term trends ko identify kiya ja sake.

            Conclusion:
            Relative Strength Index (RSI) forex trading mein ek powerful aur versatile tool hai jo market ke momentum, overbought/oversold conditions, aur potential trend reversals ko samajhne mein madad deta hai. Halanki, RSI ka sahi istemal aur doosre indicators ke sath combination zaroori hai taake accurate signals mil sakein. RSI ko apni trading strategy mein shamil karna aapko market ke better analysis aur profitable decisions lene mein madad dega.
            • <a href="https://www.instaforex.org/ru/?x=ruforum">InstaForex</a>
            • #7 Collapse

              Relative Strength Index (RSI) Kya Hai? Ek Tafseeli Jaiza

              1. Ta'aruf: Relative Strength Index (RSI) Kya Hai?
              RSI, yaani Relative Strength Index, ek mashhoor technical indicator hai jo trading aur financial markets mein istemal hota hai. Iska basic maqsad yeh hai ke yeh kisi bhi stock ya asset ke price movement ko analyze karta hai, aur batata hai ke kya woh overbought (bohat zyada khareed liya gaya) hai ya oversold (bohat zyada bech diya gaya) hai. Is tool ko J. Welles Wilder ne 1978 mein introduce kiya tha apni kitaab "New Concepts in Technical Trading Systems" mein.

              RSI aik momentum oscillator hai jo price ke upar aur neechey jaane wali rawani ko measure karta hai. Iski value 0 se 100 tak hoti hai. 70 se upar ki value ko overbought aur 30 se neeche ki value ko oversold kaha jata hai. Iska faida yeh hai ke aap aasani se samajh sakte hain ke market mein trading sentiment kaisa hai, aur kis waqt entry ya exit leni chahiye.

              2. RSI Ka Formula Aur Calculation
              RSI calculate karne ka tareeqa kuch mushkil nahi hai. Yeh 14 periods ki average gains aur losses ko measure karta hai. Formula kuch yoon hai:

              RSI = 100 - [100 ÷ (1 + RS)]

              Jahan RS ka matlab hota hai "Relative Strength", jo ke average gain ko average loss se divide kar ke nikala jata hai. Is formula ke zariye 0 se 100 ke darmiyan RSI ki value nikal aati hai.

              Agar kisi stock ya asset ka RSI 70 se upar hai, to iska matlab hai ke yeh overbought hai aur ho sakta hai ke price kuch waqt ke liye neeche aaye. Agar RSI 30 se neeche ho, to iska matlab yeh hota hai ke asset oversold hai aur price mein izafa hone ka imkaan hai.

              3. RSI Ko Samajhne Ke Liye Practical Example
              Agar aap ek stock ko dekhen jiska price lagataar barh raha hai, aur uska RSI 70 se upar chala gaya hai, to yeh market mein signal hai ke stock overbought ho gaya hai. Aise waqton mein, bohat se traders stock ko sell kar dete hain kyunki unhein lagta hai ke price ab neeche aaye ga.

              Doosri taraf, agar kisi stock ka RSI 30 ke neeche hai aur uska price gir raha hai, to yeh batata hai ke yeh oversold hai. Iska matlab yeh hai ke stock apni real value se neeche trade ho raha hai, aur is mein rebound ka imkaan hai. Yahan par bohot se traders stock ko khareed lete hain.

              4. RSI Ke Liye 70 Aur 30 Ki Boundaries Kyun Important Hain?
              RSI ka 70 aur 30 ka level technical analysis mein bohot importance rakhta hai. Jab RSI 70 se upar hota hai, to traders isay overbought kehte hain. Iska matlab hota hai ke kisi asset ki demand bohot zyada barh gayi hai, aur price bhi is liye aggressively upar ja raha hai. Lekin, price ka zyada barhna hamesha sustainable nahi hota, is liye RSI ka 70 se upar jaana waqti sell-off ka ek indicator ho sakta hai.

              Doosri taraf, 30 se neeche RSI oversold condition ko represent karta hai. Iska matlab yeh hota hai ke asset ka price bohot zyada gir gaya hai, aur logon ne zyada sell off kiya hai. Aise waqton mein, stock price mein wapas recovery hone ke imkaanaat barh jaate hain, aur RSI ka rebound hota hai.

              5. Divergence Ka Faidah: RSI Mein Kaise Identified Kiya Jata Hai?
              RSI ka ek aur faida yeh hai ke yeh divergence ko identify karne mein madad karta hai. Divergence tab hoti hai jab price aur RSI ke beech mein tafreeq hoti hai.
              • Bullish Divergence tab hoti hai jab stock ka price neeche ja raha ho, lekin RSI upar ja raha ho. Iska matlab yeh hota hai ke stock ka price bohot neeche aa gaya hai aur ab wapas barhne wala hai.
              • Bearish Divergence tab hoti hai jab price upar ja raha ho, lekin RSI neeche ja raha ho. Iska matlab yeh hai ke price ki upward momentum khatam ho rahi hai, aur market sell-off ke liye tayar ho raha hai.

              Divergence ke signals bohot important hote hain kyunki yeh market mein direction change ka pehla sign ho sakte hain. Aksar professional traders divergence ko samajhne ke liye RSI ka istemal karte hain, aur apni positions accordingly adjust karte hain.

              6. RSI Ko Different Time Frames Mein Istemaal Karna
              RSI ka aik aur bohot bara faida yeh hai ke yeh mukhtalif time frames mein kaam karta hai. Aap short-term, medium-term, aur long-term trades ke liye RSI ka istemal kar sakte hain. For example, agar aap day trader hain, to aap 5-minute ya 15-minute chart pe RSI ko dekh kar trading decisions le sakte hain. Agar aap ek swing trader hain, to daily ya weekly RSI chart ka istemal aapko better entry aur exit points de sakta hai.

              Mukhtalif time frames ke saath, RSI ke interpretation mein thodi bohot tafreeq hoti hai. Chhoti time frame pe RSI zyada frequently overbought ya oversold hota hai, jab ke bari time frame pe yeh signals kam aate hain, lekin zyada reliable hote hain.

              Khitma: RSI Ka Role Aur Uski Ahmiyat
              RSI ek ahem tool hai jo traders ko market ke sentiment ko samajhne mein madad deta hai. Yeh overbought aur oversold conditions ko identify karta hai, jis se traders ko pata chal sakta hai ke kab buying ya selling karni chahiye. RSI ka asar sirf stock markets tak mehdood nahi, balki yeh forex, commodities, aur cryptocurrencies mein bhi kaam karta hai.

              Lekin hamesha yaad rakhein, ke RSI ko dosray technical indicators ke saath istemal karna chahiye. RSI akela kabhi bhi guaranteed signal nahi deta. Trend lines, moving averages, aur support-resistance levels ke saath mil kar, RSI aapki trading strategy ko mazid accurate bana sakta hai.

              Final baat yeh hai ke RSI trading mein ek valuable tool hai, lekin isko samajhna aur practice karna zaroori hai. Jab tak aap iske nuances samajh lete hain, aapko RSI ki madad se profitable trades milne ke chances barh jaate hain.

              اب آن لائن

              Working...
              X