Explanation Of Bilateral Chart Patterns

No announcement yet.
`
X
  • وقت
  • دکھائیں
Clear All
new posts
  • #1 Collapse

    Explanation Of Bilateral Chart Patterns
    Forex trading mein bilateral chart patterns aham tools hain jo technical analysis mein istemal hoti hain aur traders ko historical price data ke basis par anay walay price movements ka andaza lagane mein madad karti hain. Ye patterns tab banti hain jab kisi currency pair ki keemat aik khas range mein chalti hai, jiski wajah se chart par aik pehchani ja sakti shakal ban jati hai. Continuation ya reversal patterns ki tarah, bilateral patterns future price movements ke liye kisi khaas direction ka nishan nahi deti is liye inhen bilateral kaha jata hai.


    Symmetrical Triangle
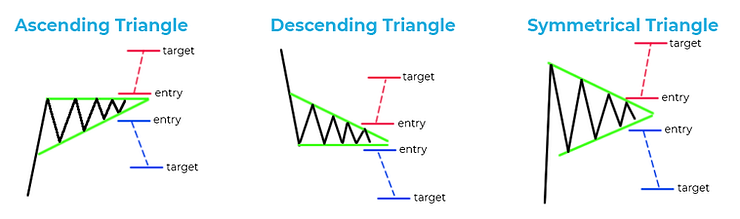
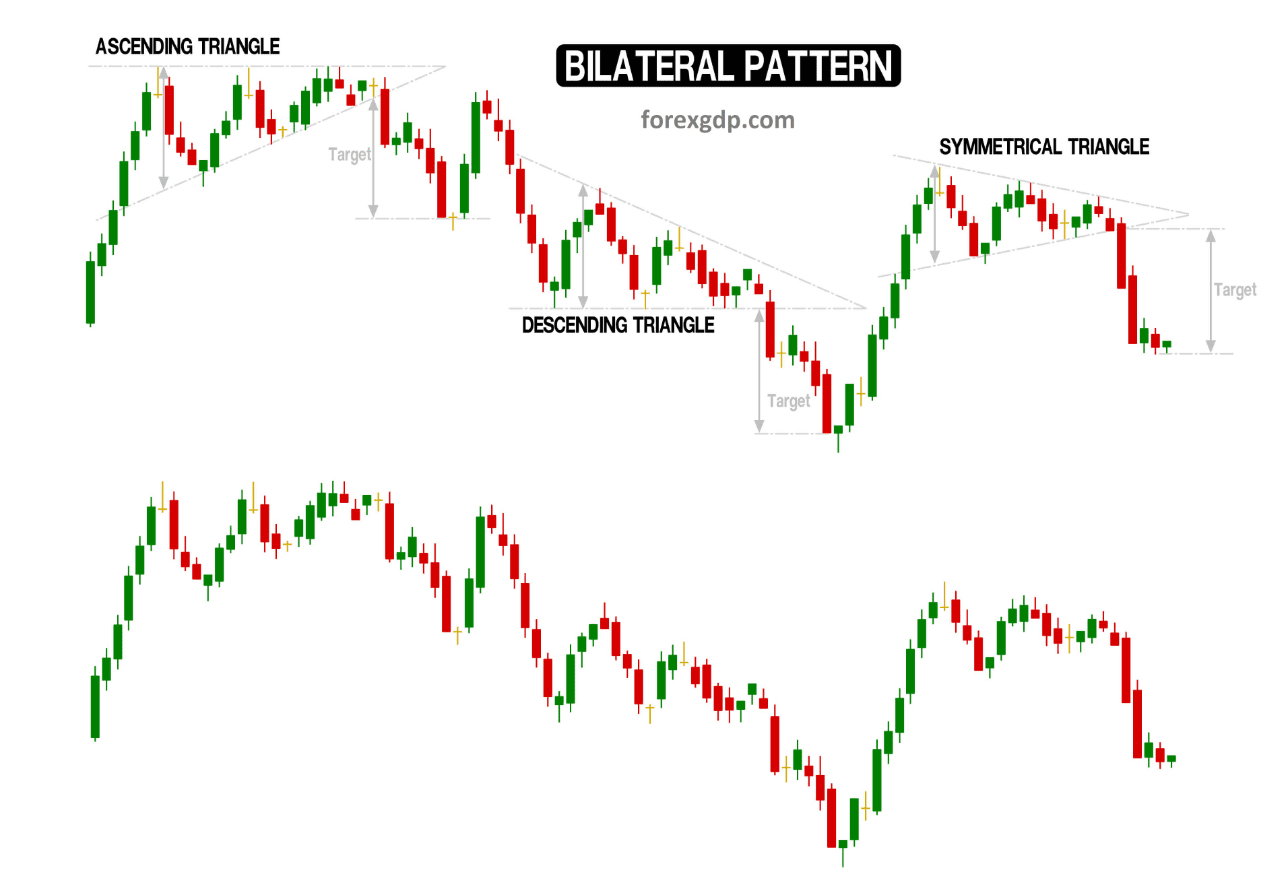
    Symmetrical triangle aik aam bilateral chart pattern hai. Ye pattern tab banta hai jab price converging trendlines ke darmiyan oscillate hoti hai, jo aik triangle ki shakal banati hai. Upper trendline woh series of lower highs ko jorta hai, jabke lower trendline higher lows ko connect karti hai. Jab price triangle ke apex tak pohanchti hai, to yeh darshata hai ke ek aise moqaat ka dor hai jahan buyers aur sellers barabari mein hain. Traders aksar upper trendline ke upar ya lower trendline ke neeche breakout ki taraf dekhte hain taake potential trend reversal ya continuation ko confirm kiya ja sake.


    Ascending Triangle
    Ascending triangle dusra bilateral pattern hai, jahan upper trendline flat hoti hai, indicating a strong resistance level, jabke lower trendline upar ki taraf slope karti hai, jo higher lows ko dikhata hai. Ye pattern yeh suggest karta hai ke buyers zyada aggressive ho rahe hain, price ko resistance level ke qareeb le ja rahe hain. Traders ka intezar hota hai ke price flat trendline ke upar breakout kare, indicating a potential bullish move.


    Descending Triangle
    Descending triangle ek bearish pattern hai jahan lower trendline flat hoti hai, indicating strong support, jabke upper trendline neeche ki taraf slope karti hai, indicating lower highs. Ye pattern yeh suggest karta hai ke sellers zyada dominant ho rahe hain, price ko support level ke qareeb le ja rahe hain. Traders flat trendline ke neeche breakout ki taraf dekhte hain, indicating a potential bearish move. Rectangle pattern bhi aik dosra bilateral formation hai jo parallel horizontal trendlines se characterize hota hai, indicating a period of consolidation. Ye pattern supply aur demand ke darmiyan balance ko darust karta hai, jahan traders upper trendline ya lower trendline ke breakout ka intezar karte hain taake potential price movement ko confirm kiya ja sake.

    Bilateral patterns ki aik bari fehrist mein yeh hai ke inka istemal mukhtalif timeframes par kiya ja sakta hai. Chahe aap chhotay arsay ke din trader hain ya lambay arsay ke investor, ye patterns minutes se le kar months tak ki charts par identify kiye ja sakte hain. Chotay arsay ke traders jaldi price movements ko capture karne ke liye chhotay timeframes par tawajju dete hain jabke lambay arsay ke investors bara timeframes ka istemal zyada significant trading decisions ke liye karte hain.


    Bilateral chart patterns trading karte waqt, future price movements ki taraf ishara karne ke liye aur bhi technical indicators aur fundamental analysis ka khayal rakhna bohot zaroori hai. Traders aksar apne trading decisions ko tasdeeq dene ke liye moving averages, relative strength index (RSI), aur Fibonacci retracement levels jese tools ka istemal karte hain. Is ke ilawa, economic indicators, geopolitical events, aur central bank policies par nazr rakhna bhi market sentiment ke liye valuable insights provide kar sakta hai, jiski wajah se traders informe decisions le sakte hain. Risk management bhi trading ke liye aik ahem aspect hai jab aap bilateral chart patterns ka istemal kar rahe hain. Ye patterns achi entry aur exit points provide kar sakte hain, lekin koi bhi trading strategy 100% foolproof nahi hoti. Isliye, zaroori hai ke aap stop-loss orders set karein takay aap apni nuksan ko limit mein rakh sakein aur aik hi trade par apne capital ka zyada se zyada aik muqarrar percentage ko risk na karein. Risk ko effectively manage kar ke, traders apne investments ko protect kar sakte hain aur market mein lambe arsay tak reh sakte hain.
    Last edited by ; 31-10-2023, 03:59 PM.
    Believe in yourself and your abilities. When you fight for your dreams, you can achieve anything.
  • <a href="https://www.instaforex.org/ru/?x=ruforum">InstaForex</a>
  • #2 Collapse


    Tijarati tijarat mein, ek asool hai ke jo chezein pehle hoti hain, woh aksar dobara hoti hain. Isi asool par mabni hai bilateral chart patterns ka tajzia. Ye patterns market ke trend ko samajhne aur tijarat karne mein madad karte hain. Is article mein, hum bilateral chart patterns ke tajziyaat ke bare mein guftagu karenge, jise aam taur par technical analysis ke doran istemal kia jata hai.

    Introduction:


    Bilateral chart patterns, tijarati charts par paye jane wale patterns hain jo ke market ke price movements ko darust karti hain. In patterns mein, aksar ek muddat (time period) ke bad doosre trend ka aghaz hota hai. Ye patterns traders ko future price movements ke bare mein sochne mein madadgar sabit ho sakte hain.

    Symmetrical Triangle Pattern:


    Symmetrical triangle pattern, ek aise pattern ka nam hai jise market mein balance bana rehta hai. Is pattern mein, prices ek triangular shape mein move karte hain, jise ek taraf se draw kiya jata hai. Is triangle ke dono sides ko connect karne se, traders ko ek samajhdari milti hai ke market mein ek potential breakout hone wala hai.

    Flag Patterns:

    Flag patterns, ek aur popular bilateral chart pattern hain. Inme, ek price movement ke baad market mein thori si rukawat hoti hai, jo ke ek flag ki tarah dikhti hai. Is rukawat ke baad, market mein dobara tezi shuru ho sakti hai. Flag patterns ko samajh kar traders apni tijarat ko behtar tareeqay se manage kar sakte hain.


    Pennant Patterns:


    Pennant pattern bhi ek triangle shape ka hota hai, lekin ye chhota hota hai. Isme, ek tezi se gire hue price movement ke bad, prices mein thori si rukawat hoti hai aur phir dobara tezi ka izhar ho sakta hai. Ye pattern bhi traders ko market ke potential movements ke bare mein behtareen malumat farahem karta hai.

    Head and Shoulders Pattern:

    Head and shoulders pattern ek reversal pattern hai jo ke market ke trend ko indicate karta hai. Is pattern mein, market mein pehle se tezi hoti hai, phir ek prominent peak (head) banta hai, aur phir do chhote peaks (shoulders) bante hain. Is pattern ke baad, market mein girawat ho sakti hai.

    Double Top and Double Bottom Patterns:

    Double top aur double bottom patterns bhi aham hote hain. Double top mein market ek specific level tak pohanch kar gir sakti hai, phir dobara wahan se upar uth kar gir sakti hai. Double bottom mein, market ek level tak gir kar dobara wahan se upar uth kar sakti hai. Ye patterns trend reversal ko indicate karte hain.

    Conclusion:

    Bilateral chart patterns tijarati tajziyaat mein ek ahem hissa hote hain. In patterns ki samajh se traders ko market ke potential movements ka andaza ho jata hai, jisse woh behtar faislay kar sakein. Hamesha yaad rahe ke tijarat mein kisi bhi pattern ko istemal karne se pehle, doosre technical aur fundamental factors ko bhi madde nazar rakha jaye. Is tarah se, traders apni tijarat mein safalta hasil kar sakte hain.


    There is a time to go long, a time to go short and a time to go fishing.
    ​​​​​​​

    ​​​​​​​
    • #3 Collapse

      Explanation Of Bilateral Chart Patterns


      Bilateral chart patterns technical analysis mein ahem aur maqbool asoolat hain jo tajaweez aur investors ko maali asaratiyon ki future harkaton ke baare mein malumat farahem karte hain. Ye patterns behtareen samajhne mein madad karte hain aur traders ko market ke mustaqbil ki taraf mutabaadil karne aur kargar trading strategies banane mein madad karte hain.

      Bilateral chart patterns is kisam ke hote hain jo apni symmetrical banawat ke liye mashhoor hain, jahan price action ek pehchane jane wale formation bana leta hai jo future mein breakout ya breakdown ki taraf ishara karta hai. Ye patterns aam taur par market ke consolidation ya uncertainty ke doran dekhe jate hain, jise kharidar aur bechne wale ke darmiyan waqtan-fa-waqtan hamahangi ka halqah keh sakte hain. Symmetrical triangle aur rectangle do aham examples hain bilateral chart patterns ki.

      Symmetrical triangle ek triangular formation hai jo is waqt banta hai jab price converging trendlines ke darmiyan oscillate karta hai, jo lower highs aur higher lows ka silsila banata hai. Ye pattern bullish aur bearish forces ke darmiyan tawun ko darust karta hai, jo market ki uncertainty ki haalat ko darust karta hai. Traders aksar triangle se breakout hone ke baad koobsoorat price movement ka intezar karte hain, chahe wo upar ki taraf ho ya neeche, pattern ke banne se pehle prevailing trend par munhasir hota hai.

      Rectangle doosra aham bilateral chart pattern hai jisme parallel aur horizontal trendlines hote hain jo trading range ko darust karte hain. Ye pattern is waqt hota hai jab price ek makhsoos area mein move karta hai, jiski wajah se ek box ki shakal ban jati hai. Rectangle ke upper aur lower hadood resistance aur support levels ke tor par kaam karte hain. Is pattern se breakout aksar prevailing trend ka jari rakhne ka ishara karta hai, jo traders ko positions mein dakhil hone ya bahar jaane ke liye aham signals farahem karta hai.

      Symmetrical triangle aur rectangle patterns technical analysts ke liye ahem hain kyun ke ye potential price targets aur risk management ke liye malumat farahem karte hain. In patterns ki dynamics ko samajh kar, traders ko favorable levels par trades mein dakhil hone aur stop-loss orders ka istemal karke risk ko control karne ke liye kargar strategies tayar karni chahiye.

      Yad rahe ke bilateral chart patterns puri tarah se saabit karne wale indicators nahi hote aur market participants ko hamesha trading decisions banane se pehle doosre technical aur bunyadi factors ka bhi khayal rakhna chahiye. Iske alawa, false breakouts bhi hosakte hain, is liye potential nuksan ko kam karne ke liye risk management strategies ka istemal zaroori hai.

      Ikhtitam mein, bilateral chart patterns technical analysis mein ahem kirdar ada karte hain, traders aur investors ko market ke trends aur potential price movements ke baare mein malumat farahem karte hain. Symmetrical triangle aur rectangle is ki do mashhoor misalein hain, jo market ke uncertainty aur consolidation ke baare mein malumat farahem karte hain. Kamyabi hasil karne wale traders apni puri analysis mein in patterns ko shaamil karte hain, inhe doosre technical tools aur bunyadi factors ke saath mila kar istemal karte hain taake maali markets ki din-gin mein kamyabi hasil kar sakein.
      • #4 Collapse

        Bilateral Chart Patterns: Market Ki Samajh Mein Madad

        Forex trading mein mukhtalif chart patterns ka istemal market ke mizaaj ko samajhne aur trading decisions banane mein kiya jata hai. In patterns mein se ek important category "bilateral chart patterns" hai. Is post mein, hum bilateral chart patterns ki tafseelat aur unke istemal ke bare mein baat karenge.

        Bilateral Chart Patterns Kya Hote Hain:

        Bilateral chart patterns woh patterns hote hain jo market mein hone wale moves ko indicate karte hain, lekin ye moves upar ya niche dono taraf ho sakte hain. In patterns ka naam "bilateral" is wajah se hai kyunki ye dono directions mein move hone ke possibilities ko darust karte hain.


        Common Bilateral Chart Patterns

        Symmetrical Triangle:

        Symmetrical triangle ek aam bilateral chart pattern hai. Isme price ek triangle ke andar chalti hai, jismein high aur low levels aapas mein milte hain. Jab ye triangle complete hota hai, toh market mein breakout hone ke chances badh jate hain, lekin ye breakout upar ya niche ho sakta hai.

        Rectangle Pattern:

        Rectangle pattern bhi bilateral chart pattern ka ek example hai. Isme price ek rectangle ke andar trade karte hai, jismein upper aur lower levels horizontal lines ke zariye define hote hain. Breakout ke baad, price upar ya niche ja sakti hai.

        Pennant Pattern:

        Pennant pattern bhi ek bilateral chart pattern hai jo market mein hone wale continuation moves ko represent karta hai. Ye ek chhota triangle hota hai jismein price consolidate hoti hai. Jab ye pattern complete hota hai, toh market mein phir se move hone ke chances hote hain.

        Bilateral Chart Patterns Ka Tareeqa

        Identify Karna:

        Bilateral chart patterns ko identify karna zaroori hai. Aapko price chart par symmetrical triangles, rectangles, ya pennants ki shape dekhai degi. In patterns ko sahi se identify karna aapki trading analysis mein madad karega.

        Breakout Ke Baad Entry Points:

        Jab aap bilateral chart pattern identify kar lete hain, toh breakout ke baad entry points decide kar sakte hain. Breakout ke baad, price ka movement upar ya niche hone par aap apne trades ka faisla kar sakte hain.

        Volume Ka Tawajju Dena:

        Bilateral chart patterns ke breakout mein volume ka bhi khaas tawajju dena zaroori hai. Agar breakout volume ke sath hota hai, toh ye confirmatory signal hota hai aur aapko trades ke liye confidence deta hai.
        Bilateral Chart Patterns Ke Fayde

        Directional Flexibility:

        Bilateral chart patterns traders ko directional flexibility dete hain. Agar aapko confirmatory signals milte hain, toh aap upar ya niche dono directions mein trades kar sakte hain.


        Consolidation Ke Badle Move Ka Indicator:

        Ye patterns market mein hone wale consolidation ke baad hone wale moves ka indicator hote hain. In patterns ko sahi se samajhne se aap market ke upcoming moves ko anticipate kar sakte hain.

        Risk Management:

        Bilateral chart patterns ka istemal karke traders apne risk ko manage kar sakte hain. Breakout ke baad, stop-loss orders ka istemal karke nuksan se bacha ja sakta hai.

        Bilateral chart patterns, forex trading mein market ki samajh mein madadgar sabit hote hain. In patterns ko sahi se identify karke aur confirmatory signals ke sath unke breakout ke baad, traders apne trading decisions ko improve kar sakte hain. Hamesha yaad rahe ke market dynamics mein tabdili hoti rehti hai, isliye har pattern ko carefully observe karna aur doosre technical indicators ke sath combine karna zaroori hai.
        • #5 Collapse

          Explanation Of Bilateral Chart Patterns
          Click image for larger version

Name:	download (1).jpg
Views:	63
Size:	18.8 کلوبائٹ
ID:	12798413
          Bilateral chart patterns are an essential component of technical analysis in financial markets. These patterns indicate a period of consolidation or indecision in the market, where buyers and sellers are in a tug of war, leading to a potential breakout in either direction. In this discussion, we will explore the key aspects of bilateral chart patterns, their significance, and how traders can leverage them to make informed decisions.

          Bilateral chart patterns are characterized by the formation of a distinct geometric shape on a price chart. These patterns typically represent a temporary pause in the prevailing trend, as the market participants reassess their positions. There are two primary types of bilateral chart patterns: rectangles and triangles.
          1. Rectangles (قائم مستطیل): A rectangle pattern is formed when the price moves within a horizontal range, creating parallel lines that act as support and resistance levels. These levels signify the boundaries within which the price is consolidating. Traders often observe rectangles as a continuation pattern, suggesting that the market is catching its breath before resuming the previous trend. Rectangles are marked by a series of highs and lows that remain relatively flat, forming a box-like shape on the chart.

            The breakout from a rectangle can occur in either direction – upwards or downwards. To confirm a breakout, traders look for a decisive move beyond the established support or resistance level, accompanied by increased trading volume. This breakout indicates a shift in market sentiment and provides traders with a potential opportunity to enter a new position in the direction of the breakout.

            When analyzing a rectangle pattern, it's crucial to consider the duration of the consolidation phase and the strength of the subsequent breakout. A longer consolidation period often suggests a more powerful move once the price breaks out.
          2. Triangles (تکون): Triangles are another common type of bilateral chart pattern and are characterized by converging trendlines. There are three main types of triangles: ascending triangles, descending triangles, and symmetrical triangles.
            • Ascending Triangle (برھتا تکون): An ascending triangle is formed when there is a horizontal resistance level and an ascending trendline acting as support. This pattern suggests that buyers are becoming more aggressive, pushing the price against the resistance level. A breakout above the resistance confirms the bullish sentiment.
            • Descending Triangle (گھٹتا تکون): Conversely, a descending triangle is formed when there is a horizontal support level and a descending trendline acting as resistance. This pattern indicates increasing selling pressure, and a breakout below the support level confirms the bearish sentiment.
            • Symmetrical Triangle (ہم اہم تکون): A symmetrical triangle is characterized by converging trendlines without a clear bias towards bullish or bearish sentiment. The market is in a state of equilibrium, and a breakout in either direction signifies a shift in the balance of power.

            Triangles are often seen as continuation patterns, indicating that the market is taking a breather before potentially resuming the existing trend. As with rectangles, traders look for breakout confirmation through increased volume.

          In summary, bilateral chart patterns provide valuable insights into market dynamics and potential future price movements. Traders use these patterns to identify consolidation phases, anticipate potential breakouts, and make informed decisions. It's essential to combine chart patterns with other technical indicators and risk management strategies for a comprehensive approach to trading. Additionally, staying updated on market news and events can enhance the effectiveness of technical analysis.
          • #6 Collapse

            Explanation of bilateral chart patterns


            Bilateral chart patterns, ya symmetric chart patterns, technical analysis mein istemal hone wale patterns hain jo market ke price movements ko analyze karne ke liye istemal hote hain. In patterns mein price ke movements symmetric hoti hain, yaani ki upar ya neeche ki taraf barabar se balance hote hain. Yeh patterns usually trend reversal ya trend continuation ko indicate karne ke liye istemal kiye jate hain.


            Yahan kuch common bilateral chart patterns hain:
            1. Symmetrical Triangle (Barabari Wala Tircha):
              • Symmetrical triangle ek triangular pattern hai jismein price higher lows aur lower highs ke beech mein consolidate hoti hai.
              • Jab ye triangle ban jata hai, traders ko ye ishara milta hai ke market mein indecision hai aur ek big move hone wala hai.
              • Price breakout ke baad, trend direction clear ho jati hai aur traders ko trend ke sath chalne ka mauka milta hai.
            2. Rectangles (Chowkidaar):
              • Rectangle pattern ek sideways trading range ko darust karta hai jismein price horizontal support aur resistance ke darmiyan move karta hai.
              • Ye pattern indicate karta hai ke market mein temporary consolidation hai aur future mein ek directional move hone ka intezar hai.
              • Rectangle breakout ke baad, market mein strong move hota hai jo trend continuation ya reversal ko show karta hai.
            3. Pennants (Jhilmile Wala Dasta):
              • Pennant pattern ek small symmetrical triangle ke jaise hota hai, lekin iska formation ek flag ke tarah hota hai.
              • Price ek trend ke baad thoda sa consolidate hota hai aur phir ek chhota sa triangular pattern banata hai.
              • Jab breakout hota hai, toh ek strong move follow hota hai.
            4. Diamonds (Heera):
              • Diamond pattern ek rare pattern hai jo price ke fluctuations ko represent karta hai.
              • Ye pattern usually ek consolidation phase ko darust karta hai, jismein price ek diamond shape banata hai.
              • Diamond breakout ke baad, market mein significant move hota hai.

            Bilateral chart patterns ka istemal traders ko ye samajhne mein madad karta hai ke market mein kis tarah ka trend hai aur kya future mein ek potential reversal hone wala hai ya phir current trend continue hoga. In patterns ko samajh kar traders apne trading decisions ko better inform kar sakte hain aur market movements ke sath adapt ho sakte hain.
            • #7 Collapse

              -:Bilateral Chart Patterns:-


              Bilateral chart patterns forex market mein technical analysis ke patterns hain jo indicate karte hain ke mojooda trend ka mumaideed jari rahega. Inke mukhafaf reversal patterns ke khilaaf, bilateral patterns ye zahir karte hain ke jab pattern complete ho jaye to mojooda trend jari rahega. Yahan do aam bilateral chart patterns hain.


              -:Bilateral Chart Patterns ki eqsaam:-
              Rectangle Pattern:
              • Rectangle pattern tab banta hai jab price movements parallel support aur resistance levels banate hain, jisse ek rectangular shape banti hai.
              • Traders rectangle patterns ko aksar consolidation zones samajhte hain, jahan market mojooda trend ko jari rakhne se pehle saans le rahi hai.
              • Uptrend mein, rectangle pattern continuation pattern hota hai, jo batata hai ke pattern upside mein break hone ke baad ek potential upward movement ko darust kar sakta hai.
              • Downtrend mein bhi rectangle pattern ek continuation pattern hota hai, jo batata hai ke pattern downside mein break hone ke baad ek potential downward movement ko darust kar sakta hai.
              Symmetrical Triangle Pattern:
              • Symmetrical triangle tab banta hai jab price action ke highs aur lows ek doosre ke qareeb aa jate hain, jisse ek triangle shape ban jata hai.
              • Ye pattern market mein faisla na hone ka doran darust hota hai, jahan buyers aur sellers barabar mein hote hain.
              • Continuation pattern ke tor par symmetrical triangle often prevailing trend ki taraf breakout karwata hai.
              • Traders ek decisive breakout ka intezar karte hain, jo prevailing trend ki taraf hota hai.
              Head and Shoulders Pattern:
              • Head and Shoulders pattern ek reversal pattern hai, lekin iska ek variation, known as the "Inverse Head and Shoulders," can also act as a continuation pattern.
              • Head and Shoulders pattern main three peaks hote hain: ek higher peak (head) and do lower peaks (shoulders).
              • Agar trend downward hai aur Inverse Head and Shoulders pattern form hota hai, toh ye ek bullish continuation signal ho sakta hai.
              Cup and Handle Pattern:
              • Cup and Handle pattern ek bullish continuation pattern hai.
              • Cup shape ek rounded bottom ko represent karta hai, jise follow karta hai ek small consolidation phase, jo handle kehlata hai.
              • Ye pattern indicate karta hai ke price phir se upward move kar sakta hai.
              Ascending and Descending Triangles:
              • Ascending triangles bullish continuation patterns hote hain, jabke descending triangles bearish continuation patterns hote hain.
              • Ascending triangle main price higher highs banta hai aur ek horizontal resistance line hoti hai, jo indicate karta hai ke uptrend continue ho sakta hai.
              • Descending triangle main price lower lows banta hai aur ek horizontal support line hoti hai, jo indicate karta hai ke downtrend continue ho sakta hai.
              • #8 Collapse

                Explanation of bilateral chart patterns


                Click image for larger version

Name:	download (3).png
Views:	69
Size:	9.5 کلوبائٹ
ID:	12798453


                Bilateral chart patterns market analysis mein aham hotay hain. Ye patterns traders ko price movement ka trend samajhnay mein madad detay hain. In patterns mein price ka movement aksar ek rectangle ya wedge ki shakal mein hota hai. Yeh indicate karta hai ke market mein buying aur selling forces barabar hain aur kisi ek direction mein strong movement ki ummed kam hoti hai. Yeh patterns typically trend reversal ya trend continuation ke indicators ke tor par istemal hotay hain.

                Yeh kuch key points hain jo bilateral chart patterns ke baray mein hain:
                1. Symmetrical Triangles: Ye pattern jab hota hai jab price higher lows aur lower highs ke darmiyan move karta hai. Ye indicate karta hai ke market mein uncertainty hai aur breakout ki ummed hoti hai, jo ke upar ya neechay ho sakta hai.
                2. Rectangles: Rectangle pattern mein price horizontal support aur resistance lines ke darmiyan move karta hai. Ye bhi ek consolidation phase ko darust karta hai, jahan buyers aur sellers mein balance hota hai.
                3. Wedges: Wedge patterns mein price ek triangle ki shakal mein move karta hai, jahan lines converge hoti hain. Ye bullish ya bearish ho sakti hain aur trend continuation ya reversal indicate karti hain.
                4. Breakouts: Jab price bilateral pattern se bahar nikalta hai, breakout hota hai. Ye traders ke liye signal hota hai ke market mein new trend shuru ho sakta hai.

                Bilateral chart patterns ko samajh kar traders apni trading strategies banate hain. In patterns ki samajh se, wo price movement ke possible directions aur entry/exit points ka andaza lagate hain. Lekin, hamesha yaad rahe ke patterns ke base par trading mein risk management ko bhi ahmiyat di jani chahiye.

                In sab ke ilawa, yeh zaroori hai ke traders current market conditions aur dusri technical indicators ko bhi madad ke tor par consider karen taake sahi faislay kiya ja sake.


                • <a href="https://www.instaforex.org/ru/?x=ruforum">InstaForex</a>
                • #9 Collapse

                  Explanation Of Bilateral Chart Patterns
                  Click image for larger version

Name:	download (3).png
Views:	97
Size:	6.7 کلوبائٹ
ID:	12798459


                  1. Bilateral Chart Patterns (Doh Taraf Ki Charaiyan)


                  Bilateral chart patterns hain wo technical analysis ke tools jo market mein aane wale price movement ko predict karne mein madad karte hain. Ye patterns market mein consolidation ya range-bound phase ko represent karte hain, jahan price ek horizontal range ke andar move karta hai.
                  2. Symmetrical Triangle (Hamwar Samatali Trikona)


                  Symmetrical triangle ek aesa pattern hai jisme price apne previous high aur low ke darmiyan chalta hai, ek triangular shape banate hue. Is pattern ki pehchan ka tariqa ye hai ke price lines ek dosre se cross karte hain. Jab ye triangle complete hota hai, market mein breakout hone ka imkan hota hai.
                  3. Rectangle (Chaurasi)


                  Rectangle pattern ek range-bound phase ko represent karta hai, jisme price ek rectangle ya square shape mein move karta hai. Is pattern mein resistance aur support lines ek dosre ke parallel hote hain. Breakout hone par, market mein strong move dekha ja sakta hai.
                  4. Wedge Patterns (Tikoni Charaiyan)


                  Wedge patterns do tarah ke hote hain: rising wedge (tez uptrend ke baad hone wala reversal) aur falling wedge (tez downtrend ke baad hone wala reversal). In patterns mein price ek wedge ya triangle mein move karta hai aur jab breakout hota hai, trend reversal ka indication hota hai.
                  5. Pennant (Jhanday)


                  Pennant ek small symmetrical triangle hota hai jo market mein temporary pause ko darust karta hai. Is pattern mein price ek chhote flag ki tarah move karta hai aur breakout ke baad, strong move dekha ja sakta hai.
                  6. Conclusion (Nateeja)


                  Bilateral chart patterns market ke future direction ka hint dete hain. Inko samajh kar traders aur investors apne trading strategies ko plan kar sakte hain. Hamesha yaad rahe ke chart patterns sirf ek tool hain aur dusre technical indicators ke saath milake istemal karna behtar hota hai trading ke liye.

                  اب آن لائن

                  Working...
                  X